Augusta Airbnb Market Analysis 2026: Short Term Rental Data & Vacation Rental Statistics in Georgia, United States
Is Airbnb profitable in Augusta in 2026? Explore comprehensive Airbnb analytics for Augusta, Georgia, United States to uncover income potential. This 2026 STR market report for Augusta, based on AirROI data from February 2025 to January 2026, reveals key trends in the bustling market of 1,048 active listings.
Whether you're considering an Airbnb investment in Augusta, optimizing your existing vacation rental, or exploring rental arbitrage opportunities, understanding the Augusta Airbnb data is crucial. Leveraging the low regulation environment is key to maximizing your short term rental income potential. Let's dive into the specifics.
Key Augusta Airbnb Performance Metrics Overview
Monthly Airbnb Revenue Variations & Income Potential in Augusta (2026)
Understanding the monthly revenue variations for Airbnb listings in Augusta is key to maximizing your short term rental income potential. Seasonality significantly impacts earnings. Our analysis, based on data from the past 12 months, shows that the peak revenue month for STRs in Augusta is typically March, while January often presents the lowest earnings, highlighting opportunities for strategic pricing adjustments during shoulder and low seasons. Explore the typical Airbnb income in Augusta across different performance tiers:
- Best-in-class properties (Top 10%) achieve $8,044+ monthly, often utilizing dynamic pricing and superior guest experiences.
- Strong performing properties (Top 25%) earn $4,238 or more, indicating effective management and desirable locations/amenities.
- Typical properties (Median) generate around $2,191 per month, representing the average market performance.
- Entry-level properties (Bottom 25%) see earnings around $1,025, often with potential for optimization.
Average Monthly Airbnb Earnings Trend in Augusta
Augusta Airbnb Occupancy Rate Trends (2026)
Maximize your bookings by understanding the Augusta STR occupancy trends. Seasonal demand shifts significantly influence how often properties are booked. Typically, Marchsees the highest demand (peak season occupancy), while January experiences the lowest (low season). Effective strategies, like adjusting minimum stays or offering promotions, can boost occupancy during slower periods. Here's how different property tiers perform in Augusta:
- Best-in-class properties (Top 10%) achieve 79%+ occupancy, indicating high desirability and potentially optimized availability.
- Strong performing properties (Top 25%) maintain 59% or higher occupancy, suggesting good market fit and guest satisfaction.
- Typical properties (Median) have an occupancy rate around 35%.
- Entry-level properties (Bottom 25%) average 17% occupancy, potentially facing higher vacancy.
Average Monthly Occupancy Rate Trend in Augusta
Average Daily Rate (ADR) Airbnb Trends in Augusta (2026)
Effective short term rental pricing strategy in Augusta involves understanding monthly ADR fluctuations. The Average Daily Rate (ADR) for Airbnb in Augusta typically peaks in April and dips lowest during August. Leveraging Airbnb dynamic pricing tools or strategies based on this seasonality can significantly boost revenue. Here's a look at the typical nightly rates achieved:
- Best-in-class properties (Top 10%) command rates of $1,105+ per night, often due to premium features or locations.
- Strong performing properties (Top 25%) achieve nightly rates of $504 or more.
- Typical properties (Median) charge around $195 per night.
- Entry-level properties (Bottom 25%) earn around $119 per night.
Average Daily Rate (ADR) Trend by Month in Augusta
Get Live Augusta Market Intelligence 👇

Explore Real-time Analytics
Airbnb Seasonality Analysis & Trends in Augusta (2026)
Peak Season (March, April, July)
- Revenue averages $6,493 per month
- Occupancy rates average 48.6%
- Daily rates average $431
Shoulder Season
- Revenue averages $2,590 per month
- Occupancy maintains around 37.4%
- Daily rates hold near $399
Low Season (January, September, November)
- Revenue drops to average $2,097 per month
- Occupancy decreases to average 33.6%
- Daily rates adjust to average $416
Seasonality Insights for Augusta
- The Airbnb seasonality in Augusta shows highly seasonal trends requiring careful strategy. While the sections above show seasonal averages, it's also insightful to look at the extremes:
- During the high season, the absolute peak month showcases Augusta's highest earning potential, with monthly revenues capable of climbing to $8,783, occupancy reaching a high of 53.4%, and ADRs peaking at $494.
- Conversely, the slowest single month of the year, typically falling within the low season, marks the market's lowest point. In this month, revenue might dip to $1,971, occupancy could drop to 28.4%, and ADRs may adjust down to $385.
- Understanding both the seasonal averages and these monthly peaks and troughs in revenue, occupancy, and ADR is crucial for maximizing your Airbnb profit potential in Augusta.
Seasonal Strategies for Maximizing Profit
- Peak Season: Maximize revenue through premium pricing and potentially longer minimum stays. Ensure high availability.
- Low Season: Offer competitive pricing, special promotions (e.g., extended stay discounts), and flexible cancellation policies. Target off-season travelers like remote workers or budget-conscious guests.
- Shoulder Seasons: Implement dynamic pricing that balances peak and low rates. Target weekend travelers or specific events. Offer slightly more flexible terms than peak season.
- Regularly analyze your own performance against these Augusta seasonality benchmarks and adjust your pricing and availability strategy accordingly.
Best Areas for Airbnb Investment in Augusta (2026)
Exploring the top neighborhoods for short-term rentals in Augusta? This section highlights key areas, outlining why they are attractive for hosts and guests, along with notable local attractions. Consider these locations based on your target guest profile and investment strategy.
| Neighborhood / Area | Why Host Here? (Target Guests & Appeal) | Key Attractions & Landmarks |
|---|---|---|
| Downtown Augusta | The heart of Augusta, known for its vibrant atmosphere and historic sites. Ideal for those looking to experience local culture and entertainment events. | Augusta Riverwalk, Marty's on Broad, Imperial Theatre, Augusta Museum of History, The Bell Auditorium |
| Summerville | A charming residential neighborhood with historic homes and beautiful scenery. Popular with families and travelers seeking a peaceful retreat with close access to local parks. | Summerville Historic District, Fish Pond Park, Pendleton King Park, The Laurel and Hardy Museum of Harlem GA |
| Riverwatch | An upscale area known for its scenic views of the Savannah River, perfect for guests looking for modern amenities and dining options. | Riverwalk Augusta, The District, Reed Creek Park |
| Lake Olmstead | A serene location perfect for outdoor enthusiasts, with a focus on recreational activities such as fishing and hiking, appealing to nature lovers. | Lake Olmstead Park, Augusta GreenJackets Baseball, Joe Tucker Park |
| National Hills | A bustling district known for its shopping and dining options, making it suitable for guests seeking convenience and a lively atmosphere. | Washington Road Shopping, National Hills Shopping Center |
| West Augusta | A growing suburb with a mix of residential and commercial spaces, appealing to families and business travelers alike. | Augusta National Golf Club, Shopping at Augusta Mall |
| Evans | A suburban area close to Augusta with family-friendly neighborhoods, making it ideal for longer stays and family-oriented trips. | Lake Thurmond, Evans Towne Center Park |
| Fort Gordon | Housing a military base, this area attracts military personnel and their families, appealing for short-term rentals and long-term stays. | Fort Gordon Military Base, Local parks and recreational areas |
Understanding Airbnb License Requirements & STR Laws in Augusta (2026)
While Augusta, Georgia, United States currently shows low STR regulations, specific Airbnb license requirements might still exist or change. Always verify the latest short term rental regulations and Airbnb license requirements directly with local government authorities for Augusta to ensure full compliance before hosting.
(Source: AirROI data, 2026, finding no licensed listings among those analyzed)
Top Performing Airbnb Properties in Augusta (2026)
Benchmark your potential! Explore examples of top-performing Airbnb properties in Augustabased on Trailing Twelve Month (TTM) revenue. Analyze their characteristics, revenue, occupancy rate, and ADR to understand what drives success in this market.
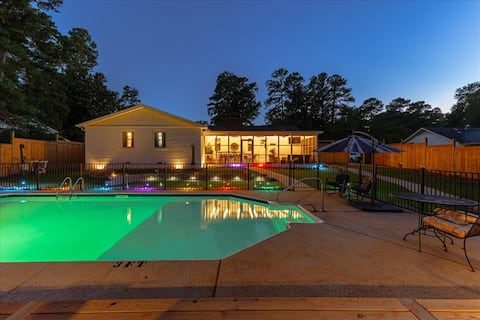
Large and Lux-Extended Stays / Pool / Golf
Entire Place • 4 bedrooms

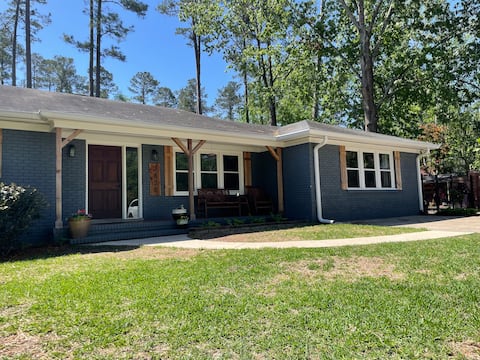
Augusta Oasis- Heated pool-Hot tub-Dog friendly!
Entire Place • 5 bedrooms
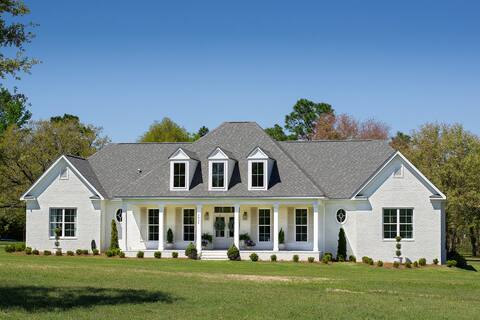
Masters 2026, walk to the course!
Entire Place • 4 bedrooms
Masters Rental
Entire Place • 5 bedrooms
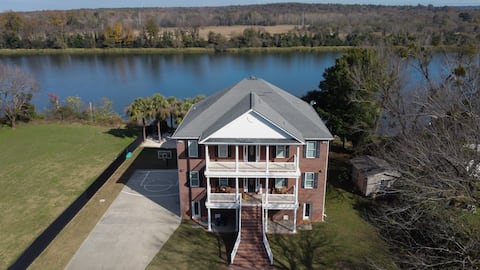
Masters River Retreat
Entire Place • 4 bedrooms
Master's Week Rental
Entire Place • 5 bedrooms
Note: Performance varies based on location, size, amenities, seasonality, and management quality. Data reflects the past 12 months.
Top Performing Airbnb Hosts in Augusta (2026)
Learn from the best! This table showcases top-performing Airbnb hosts in Augusta based on the number of properties managed and estimated total revenue over the past year. Analyze their scale and performance metrics.
| Host Name | Properties | Grossing Revenue | Stay Reviews | Avg Rating |
|---|---|---|---|---|
| Chris | 18 | $898,522 | 691 | 4.90/5.0 |
| Amie | 12 | $697,123 | 415 | 4.88/5.0 |
| Rose | 21 | $693,934 | 1233 | 4.86/5.0 |
| Deanna | 25 | $582,797 | 451 | 4.92/5.0 |
| Andrew | 5 | $391,705 | 332 | 4.89/5.0 |
| Shelly | 12 | $357,334 | 415 | 4.83/5.0 |
| Trey | 4 | $272,779 | 234 | 4.99/5.0 |
| Anna | 11 | $245,557 | 1112 | 4.88/5.0 |
| Jimmy | 10 | $236,058 | 2930 | 4.71/5.0 |
| Raiden | 8 | $214,873 | 572 | 4.85/5.0 |
Analyzing the strategies of top hosts, such as their property selection, pricing, and guest communication, can offer valuable lessons for optimizing your own Airbnb operations in Augusta.
Dive Deeper: Advanced Augusta STR Market Data (2026)
Ready to unlock more insights? AirROI provides access to advanced metrics and comprehensive Airbnb data for Augusta. Explore detailed analytics beyond this report to refine your investment strategy, optimize pricing, and maximize your vacation rental profits.
Explore Advanced MetricsAugusta Short-Term Rental Market Composition (2026): Property & Room Types
Room Type Distribution
Property Type Distribution
Market Composition Insights for Augusta
- The Augusta Airbnb market composition is heavily skewed towards Entire Home/Apt listings, which make up 89.4% of the 1,048 active rentals. This indicates strong guest preference for privacy and space.
- Looking at the property type distribution in Augusta, House properties are the most common (77.1%), reflecting the local real estate landscape.
- Houses represent a significant 77.1% portion, catering likely to families or larger groups.
- Smaller segments like hotel/boutique, others, outdoor/unique (combined 5.1%) offer potential for unique stay experiences.
Augusta Airbnb Room Capacity Analysis (2026): Bedroom Distribution
Distribution of Listings by Number of Bedrooms
Room Capacity Insights for Augusta
- The dominant room capacity in Augusta is 2 bedrooms listings, making up 29.1% of the market. This suggests a strong demand for properties suitable for couples or solo travelers.
- Together, 2 bedrooms and 3 bedrooms properties represent 57.3% of the active Airbnb listings in Augusta, indicating a high concentration in these sizes.
- A significant 46.4% of listings offer 3+ bedrooms, catering to larger groups and families seeking more space in Augusta.
Augusta Vacation Rental Guest Capacity Trends (2026)
Distribution of Listings by Guest Capacity
Guest Capacity Insights for Augusta
- The most common guest capacity trend in Augusta vacation rentals is listings accommodating 6 guests (23.4%). This suggests the primary traveler segment is likely larger groups.
- Properties designed for 6 guests and 8+ guests dominate the Augusta STR market, accounting for 45.0% of listings.
- 48.6% of properties accommodate 6+ guests, serving the market segment for larger families or group travel in Augusta.
- On average, properties in Augusta are equipped to host 4.8 guests.
Augusta Airbnb Booking Patterns (2026): Available vs. Booked Days
Available Days Distribution
Booked Days Distribution
Booking Pattern Insights for Augusta
- The most common availability pattern in Augusta falls within the 271-366 days range, representing 63.2% of listings. This suggests many properties have significant open periods on their calendars.
- Approximately 88.7% of listings show high availability (181+ days open annually), indicating potential for increased bookings or specific owner usage patterns.
- For booked days, the 31-90 days range is most frequent in Augusta (39.4%), reflecting common guest stay durations or potential owner blocking patterns.
- A notable 11.9% of properties secure long booking periods (181+ days booked per year), highlighting successful long-term rental strategies or significant owner usage.
Augusta Airbnb Minimum Stay Requirements Analysis
Distribution of Listings by Minimum Night Requirement
1 Night
258 listings
24.6% of total
2 Nights
208 listings
19.8% of total
3 Nights
79 listings
7.5% of total
4-6 Nights
92 listings
8.8% of total
7-29 Nights
93 listings
8.9% of total
30+ Nights
318 listings
30.3% of total
Key Insights
- The most prevalent minimum stay requirement in Augusta is 30+ Nights, adopted by 30.3% of listings. This highlights the market's preference for longer commitments.
- A significant segment (30.3%) caters to monthly stays (30+ nights) in Augusta, pointing to opportunities in the extended-stay market.
Recommendations
- Align with the market by considering a 30+ Nights minimum stay, as 30.3% of Augusta hosts use this setting.
- If feasible, allowing 1-night stays, especially midweek or during low season, could capture last-minute bookings, as only 24.6% currently do.
- Explore offering discounts for stays of 30+ nights to attract the 30.3% of the market seeking extended stays.
- Adjust minimum nights based on seasonality – potentially shorter during low season and longer during peak demand periods in Augusta.
Augusta Airbnb Cancellation Policy Trends Analysis (2026)
Super Strict 30 Days
2 listings
0.2% of total
Limited
12 listings
1.2% of total
Super Strict 60 Days
8 listings
0.8% of total
Flexible
221 listings
21.3% of total
Moderate
222 listings
21.4% of total
Firm
422 listings
40.6% of total
Strict
152 listings
14.6% of total
Cancellation Policy Insights for Augusta
- The prevailing Airbnb cancellation policy trend in Augusta is Firm, used by 40.6% of listings.
- A majority (55.2%) of hosts in Augusta utilize Firm or Strict policies, indicating a market where hosts prioritize booking security.
Recommendations for Hosts
- Consider adopting a Firm policy to align with the 40.6% market standard in Augusta.
- Using a Strict policy might deter some guests, as only 14.6% of listings use it. Evaluate if potential revenue protection outweighs possible lower booking rates.
- Regularly review your cancellation policy against competitors and market demand shifts in Augusta.
Augusta STR Booking Lead Time Analysis (2026)
Average Booking Lead Time by Month
Booking Lead Time Insights for Augusta
- The overall average booking lead time for vacation rentals in Augusta is 52 days.
- Guests book furthest in advance for stays during April (average 93 days), likely coinciding with peak travel demand or local events.
- The shortest booking windows occur for stays in January (average 13 days), indicating more last-minute travel plans during this time.
- Seasonally, Spring (50 days avg.) sees the longest lead times, while Summer (20 days avg.) has the shortest, reflecting typical travel planning cycles.
Recommendations for Hosts
- Use the overall average lead time (52 days) as a baseline for your pricing and availability strategy in Augusta.
- For April stays, consider implementing length-of-stay discounts or slightly higher rates for bookings made less than 93 days out to capitalize on advance planning.
- During January, focus on last-minute booking availability and promotions, as guests book with very short notice (13 days avg.).
- Target marketing efforts for the Spring season well in advance (at least 50 days) to capture early planners.
- Monitor your own booking lead times against these Augusta averages to identify opportunities for dynamic pricing adjustments.
Popular & Essential Airbnb Amenities in Augusta (2026)
Amenity Prevalence
Amenity Insights for Augusta
- Essential amenities in Augusta that guests expect include: Air conditioning, Wifi, TV, Free parking on premises, Smoke alarm, Kitchen. Lacking these (any) could significantly impact bookings.
- Popular amenities like Washer, Heating, Refrigerator are common but not universal. Offering these can provide a competitive edge.
Recommendations for Hosts
- Ensure your listing includes all essential amenities for Augusta: Air conditioning, Wifi, TV, Free parking on premises, Smoke alarm, Kitchen.
- Prioritize adding missing essentials: Air conditioning, Wifi, TV, Free parking on premises, Smoke alarm, Kitchen.
- Consider adding popular differentiators like Washer or Heating to increase appeal.
- Highlight unique or less common amenities you offer (e.g., hot tub, dedicated workspace, EV charger) in your listing description and photos.
- Regularly check competitor amenities in Augusta to stay competitive.
Augusta Airbnb Guest Demographics & Profile Analysis (2026)
Guest Profile Summary for Augusta
- The typical guest profile for Airbnb in Augusta consists of primarily domestic travelers (97%), often arriving from nearby Atlanta, typically belonging to the Post-2000s (Gen Z/Alpha) group (50%), primarily speaking English or Spanish.
- Domestic travelers account for 96.5% of guests.
- Key international markets include United States (96.5%) and DC (0.5%).
- Top languages spoken are English (76.8%) followed by Spanish (14.8%).
- A significant demographic segment is the Post-2000s (Gen Z/Alpha) group, representing 50% of guests.
Recommendations for Hosts
- Target domestic marketing efforts towards travelers from Atlanta and Augusta.
- Tailor amenities and listing descriptions to appeal to the dominant Post-2000s (Gen Z/Alpha) demographic (e.g., highlight fast WiFi, smart home features, local guides).
- Highlight unique local experiences or amenities relevant to the primary guest profile.
- Consider seasonal promotions aligned with peak travel times for key origin markets.
Nearby Short-Term Rental Market Comparison
How does the Augusta Airbnb market stack up against its neighbors? Compare key performance metrics like average monthly revenue, ADR, and occupancy rates in surrounding areas to understand the broader regional STR landscape.
| Market | Active Properties | Monthly Revenue | Daily Rate | Avg. Occupancy |
|---|---|---|---|---|
| Bogart | 13 | $5,528 | $637.81 | 35% |
| Whitemarsh Island | 82 | $4,450 | $305.48 | 49% |
| Six Mile | 57 | $4,396 | $449.78 | 42% |
| Commerce | 19 | $4,298 | $285.34 | 45% |
| Eatonton | 236 | $4,178 | $502.80 | 33% |
| West Union | 30 | $4,126 | $564.92 | 32% |
| Sautee | 14 | $4,105 | $408.17 | 39% |
| Appling | 21 | $4,080 | $617.34 | 35% |
| Chapin | 93 | $3,971 | $386.37 | 43% |
| Seneca | 267 | $3,623 | $426.33 | 35% |