Zephyrhills Airbnb Market Analysis 2026: Short Term Rental Data & Vacation Rental Statistics in Florida, United States
Is Airbnb profitable in Zephyrhills in 2026? Explore comprehensive Airbnb analytics for Zephyrhills, Florida, United States to uncover income potential. This 2026 STR market report for Zephyrhills, based on AirROI data from February 2025 to January 2026, reveals key trends in the niche market of 123 active listings.
Whether you're considering an Airbnb investment in Zephyrhills, optimizing your existing vacation rental, or exploring rental arbitrage opportunities, understanding the Zephyrhills Airbnb data is crucial. Leveraging the low regulation environment is key to maximizing your short term rental income potential. Let's dive into the specifics.
Key Zephyrhills Airbnb Performance Metrics Overview
Monthly Airbnb Revenue Variations & Income Potential in Zephyrhills (2026)
Understanding the monthly revenue variations for Airbnb listings in Zephyrhills is key to maximizing your short term rental income potential. Seasonality significantly impacts earnings. Our analysis, based on data from the past 12 months, shows that the peak revenue month for STRs in Zephyrhills is typically March, while May often presents the lowest earnings, highlighting opportunities for strategic pricing adjustments during shoulder and low seasons. Explore the typical Airbnb income in Zephyrhills across different performance tiers:
- Best-in-class properties (Top 10%) achieve $4,137+ monthly, often utilizing dynamic pricing and superior guest experiences.
- Strong performing properties (Top 25%) earn $2,937 or more, indicating effective management and desirable locations/amenities.
- Typical properties (Median) generate around $1,854 per month, representing the average market performance.
- Entry-level properties (Bottom 25%) see earnings around $863, often with potential for optimization.
Average Monthly Airbnb Earnings Trend in Zephyrhills
Zephyrhills Airbnb Occupancy Rate Trends (2026)
Maximize your bookings by understanding the Zephyrhills STR occupancy trends. Seasonal demand shifts significantly influence how often properties are booked. Typically, Marchsees the highest demand (peak season occupancy), while May experiences the lowest (low season). Effective strategies, like adjusting minimum stays or offering promotions, can boost occupancy during slower periods. Here's how different property tiers perform in Zephyrhills:
- Best-in-class properties (Top 10%) achieve 81%+ occupancy, indicating high desirability and potentially optimized availability.
- Strong performing properties (Top 25%) maintain 63% or higher occupancy, suggesting good market fit and guest satisfaction.
- Typical properties (Median) have an occupancy rate around 43%.
- Entry-level properties (Bottom 25%) average 23% occupancy, potentially facing higher vacancy.
Average Monthly Occupancy Rate Trend in Zephyrhills
Average Daily Rate (ADR) Airbnb Trends in Zephyrhills (2026)
Effective short term rental pricing strategy in Zephyrhills involves understanding monthly ADR fluctuations. The Average Daily Rate (ADR) for Airbnb in Zephyrhills typically peaks in January and dips lowest during April. Leveraging Airbnb dynamic pricing tools or strategies based on this seasonality can significantly boost revenue. Here's a look at the typical nightly rates achieved:
- Best-in-class properties (Top 10%) command rates of $219+ per night, often due to premium features or locations.
- Strong performing properties (Top 25%) achieve nightly rates of $172 or more.
- Typical properties (Median) charge around $124 per night.
- Entry-level properties (Bottom 25%) earn around $96 per night.
Average Daily Rate (ADR) Trend by Month in Zephyrhills
Get Live Zephyrhills Market Intelligence 👇

Explore Real-time Analytics
Airbnb Seasonality Analysis & Trends in Zephyrhills (2026)
Peak Season (March, February, December)
- Revenue averages $2,593 per month
- Occupancy rates average 56.6%
- Daily rates average $138
Shoulder Season
- Revenue averages $2,048 per month
- Occupancy maintains around 42.5%
- Daily rates hold near $143
Low Season (May, August, September)
- Revenue drops to average $1,666 per month
- Occupancy decreases to average 36.0%
- Daily rates adjust to average $134
Seasonality Insights for Zephyrhills
- The Airbnb seasonality in Zephyrhills shows moderate seasonality with distinct peak and low periods. While the sections above show seasonal averages, it's also insightful to look at the extremes:
- During the high season, the absolute peak month showcases Zephyrhills's highest earning potential, with monthly revenues capable of climbing to $2,944, occupancy reaching a high of 63.9%, and ADRs peaking at $158.
- Conversely, the slowest single month of the year, typically falling within the low season, marks the market's lowest point. In this month, revenue might dip to $1,558, occupancy could drop to 34.4%, and ADRs may adjust down to $128.
- Understanding both the seasonal averages and these monthly peaks and troughs in revenue, occupancy, and ADR is crucial for maximizing your Airbnb profit potential in Zephyrhills.
Seasonal Strategies for Maximizing Profit
- Peak Season: Maximize revenue through premium pricing and potentially longer minimum stays. Ensure high availability.
- Low Season: Offer competitive pricing, special promotions (e.g., extended stay discounts), and flexible cancellation policies. Target off-season travelers like remote workers or budget-conscious guests.
- Shoulder Seasons: Implement dynamic pricing that balances peak and low rates. Target weekend travelers or specific events. Offer slightly more flexible terms than peak season.
- Regularly analyze your own performance against these Zephyrhills seasonality benchmarks and adjust your pricing and availability strategy accordingly.
Best Areas for Airbnb Investment in Zephyrhills (2026)
Exploring the top neighborhoods for short-term rentals in Zephyrhills? This section highlights key areas, outlining why they are attractive for hosts and guests, along with notable local attractions. Consider these locations based on your target guest profile and investment strategy.
| Neighborhood / Area | Why Host Here? (Target Guests & Appeal) | Key Attractions & Landmarks |
|---|---|---|
| Zephyrhills Downtown | The heart of Zephyrhills, featuring charming shops, local eateries, and community events. Great for travelers wanting to experience the local culture and history of the town. | Zephyrhills Museum, Local art galleries, Community parks, Dining options, Farmers Market |
| Silver Lake | A picturesque area located near lakes, ideal for outdoor enthusiasts and families looking for a relaxing getaway with opportunities for fishing, boating, and picnicking. | Silver Lake, Zephyr Park, Fishing spots, Walking trails, Picnic areas |
| Sandy Ridge | A thriving community known for its close-knit nature and beautiful surroundings, attracting families and vacationers who enjoy a tranquil environment with easy access to recreation. | Community parks, Sports fields, Walking paths, Nature trails, Local shops |
| Rolling Oaks | A serene neighborhood that offers a peaceful atmosphere away from the hustle and bustle, suitable for those seeking a quiet stay while still being close to local attractions. | Nature trails, Community gardens, Local cafes, Parks, Quiet streets |
| Lake Bernadette | A suburban neighborhood with a golf course and recreational facilities, appealing to golfers and families looking for upscale living with plenty of activities. | Lake Bernadette Golf Course, The Clubhouse, Walking trails, Parks, Golfing |
| Cypress Creek | A growing area with modern amenities and easy access to major roads, perfect for visitors looking to explore nearby cities while enjoying a comfortable stay. | Cypress Creek Park, Local restaurants, Shopping centers, Nearby nature spots, Parks |
| Zephyr Lake | A lovely spot surrounded by nature, great for those who appreciate the outdoors and want to enjoy water activities like kayaking and fishing. | Zephyr Lake, Fishing spots, Kayaking areas, Nature trails, Picnic spots |
| Eiland Park | A well-connected area with convenient access to schools and shopping, making it suitable for families and long-term visitors looking for a home-feel atmosphere. | Community parks, Local schools, Shopping centers, Family-friendly venues, Nearby restaurants |
Understanding Airbnb License Requirements & STR Laws in Zephyrhills (2026)
While Zephyrhills, Florida, United States currently shows low STR regulations, specific Airbnb license requirements might still exist or change. Always verify the latest short term rental regulations and Airbnb license requirements directly with local government authorities for Zephyrhills to ensure full compliance before hosting.
(Source: AirROI data, 2026, finding no licensed listings among those analyzed)
Top Performing Airbnb Properties in Zephyrhills (2026)
Benchmark your potential! Explore examples of top-performing Airbnb properties in Zephyrhillsbased on Trailing Twelve Month (TTM) revenue. Analyze their characteristics, revenue, occupancy rate, and ADR to understand what drives success in this market.

3BD3bath house w/heated Pool & entertainment space
Entire Place • 3 bedrooms
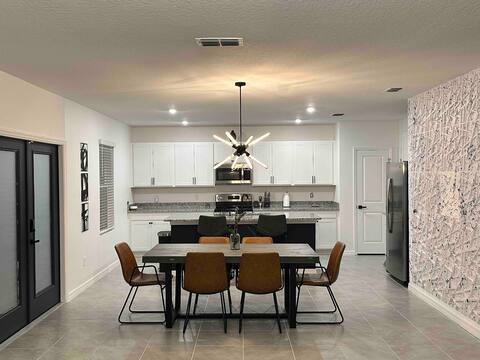
Aesthetic Contemporary Escape in Zephyrhills
Entire Place • 5 bedrooms
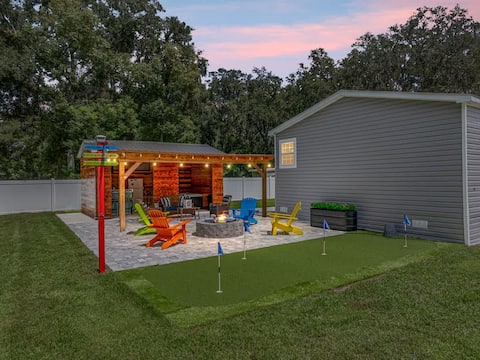
The Cozy Cabana
Entire Place • 3 bedrooms

Cute farmhouse in a park like setting on 10 acres
Entire Place • 2 bedrooms

Villa Salem
Entire Place • 3 bedrooms
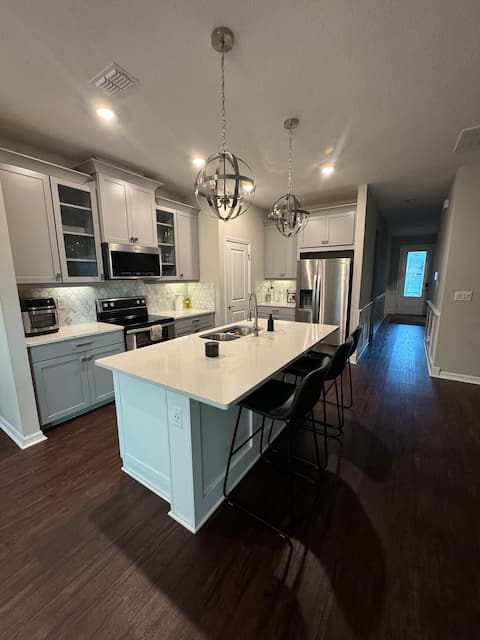
3/2 near Epperson Lagoon!
Entire Place • 3 bedrooms
Note: Performance varies based on location, size, amenities, seasonality, and management quality. Data reflects the past 12 months.
Top Performing Airbnb Hosts in Zephyrhills (2026)
Learn from the best! This table showcases top-performing Airbnb hosts in Zephyrhills based on the number of properties managed and estimated total revenue over the past year. Analyze their scale and performance metrics.
| Host Name | Properties | Grossing Revenue | Stay Reviews | Avg Rating |
|---|---|---|---|---|
| Kim | 10 | $154,570 | 109 | 4.71/5.0 |
| Christine | 4 | $115,378 | 529 | 4.99/5.0 |
| Jason | 4 | $98,531 | 75 | 4.90/5.0 |
| Victor | 3 | $75,563 | 167 | 4.94/5.0 |
| Emily | 4 | $65,067 | 121 | 4.74/5.0 |
| Camilo | 2 | $61,154 | 94 | 4.91/5.0 |
| Jimmy | 1 | $58,730 | 42 | 4.98/5.0 |
| Pedro | 1 | $53,895 | 32 | 4.81/5.0 |
| Carmen | 6 | $50,538 | 580 | 4.94/5.0 |
| Brian | 1 | $45,464 | 35 | 5.00/5.0 |
Analyzing the strategies of top hosts, such as their property selection, pricing, and guest communication, can offer valuable lessons for optimizing your own Airbnb operations in Zephyrhills.
Dive Deeper: Advanced Zephyrhills STR Market Data (2026)
Ready to unlock more insights? AirROI provides access to advanced metrics and comprehensive Airbnb data for Zephyrhills. Explore detailed analytics beyond this report to refine your investment strategy, optimize pricing, and maximize your vacation rental profits.
Explore Advanced MetricsZephyrhills Short-Term Rental Market Composition (2026): Property & Room Types
Room Type Distribution
Property Type Distribution
Market Composition Insights for Zephyrhills
- The Zephyrhills Airbnb market composition is heavily skewed towards Entire Home/Apt listings, which make up 84.6% of the 123 active rentals. This indicates strong guest preference for privacy and space.
- Looking at the property type distribution in Zephyrhills, House properties are the most common (66.7%), reflecting the local real estate landscape.
- Houses represent a significant 66.7% portion, catering likely to families or larger groups.
- The presence of 6.5% Hotel/Boutique listings indicates integration with traditional hospitality.
- Smaller segments like others, outdoor/unique (combined 5.7%) offer potential for unique stay experiences.
Zephyrhills Airbnb Room Capacity Analysis (2026): Bedroom Distribution
Distribution of Listings by Number of Bedrooms
Room Capacity Insights for Zephyrhills
- The dominant room capacity in Zephyrhills is 2 bedrooms listings, making up 35.8% of the market. This suggests a strong demand for properties suitable for couples or solo travelers.
- Together, 2 bedrooms and 1 bedroom properties represent 62.6% of the active Airbnb listings in Zephyrhills, indicating a high concentration in these sizes.
- A significant 26.8% of listings offer 3+ bedrooms, catering to larger groups and families seeking more space in Zephyrhills.
Zephyrhills Vacation Rental Guest Capacity Trends (2026)
Distribution of Listings by Guest Capacity
Guest Capacity Insights for Zephyrhills
- The most common guest capacity trend in Zephyrhills vacation rentals is listings accommodating 4 guests (30.9%). This suggests the primary traveler segment is likely small families or groups.
- Properties designed for 4 guests and 6 guests dominate the Zephyrhills STR market, accounting for 53.7% of listings.
- 35.0% of properties accommodate 6+ guests, serving the market segment for larger families or group travel in Zephyrhills.
- On average, properties in Zephyrhills are equipped to host 4.3 guests.
Zephyrhills Airbnb Booking Patterns (2026): Available vs. Booked Days
Available Days Distribution
Booked Days Distribution
Booking Pattern Insights for Zephyrhills
- The most common availability pattern in Zephyrhills falls within the 271-366 days range, representing 50.4% of listings. This suggests many properties have significant open periods on their calendars.
- Approximately 82.9% of listings show high availability (181+ days open annually), indicating potential for increased bookings or specific owner usage patterns.
- For booked days, the 31-90 days range is most frequent in Zephyrhills (41.5%), reflecting common guest stay durations or potential owner blocking patterns.
- A notable 17.9% of properties secure long booking periods (181+ days booked per year), highlighting successful long-term rental strategies or significant owner usage.
Zephyrhills Airbnb Minimum Stay Requirements Analysis
Distribution of Listings by Minimum Night Requirement
1 Night
22 listings
17.9% of total
2 Nights
18 listings
14.6% of total
3 Nights
30 listings
24.4% of total
4-6 Nights
5 listings
4.1% of total
7-29 Nights
10 listings
8.1% of total
30+ Nights
38 listings
30.9% of total
Key Insights
- The most prevalent minimum stay requirement in Zephyrhills is 30+ Nights, adopted by 30.9% of listings. This highlights the market's preference for longer commitments.
- A significant segment (30.9%) caters to monthly stays (30+ nights) in Zephyrhills, pointing to opportunities in the extended-stay market.
Recommendations
- Align with the market by considering a 30+ Nights minimum stay, as 30.9% of Zephyrhills hosts use this setting.
- If feasible, allowing 1-night stays, especially midweek or during low season, could capture last-minute bookings, as only 17.9% currently do.
- Explore offering discounts for stays of 30+ nights to attract the 30.9% of the market seeking extended stays.
- Adjust minimum nights based on seasonality – potentially shorter during low season and longer during peak demand periods in Zephyrhills.
Zephyrhills Airbnb Cancellation Policy Trends Analysis (2026)
Limited
6 listings
4.9% of total
Flexible
23 listings
18.7% of total
Moderate
28 listings
22.8% of total
Firm
44 listings
35.8% of total
Strict
22 listings
17.9% of total
Cancellation Policy Insights for Zephyrhills
- The prevailing Airbnb cancellation policy trend in Zephyrhills is Firm, used by 35.8% of listings.
- A majority (53.7%) of hosts in Zephyrhills utilize Firm or Strict policies, indicating a market where hosts prioritize booking security.
Recommendations for Hosts
- Consider adopting a Firm policy to align with the 35.8% market standard in Zephyrhills.
- Regularly review your cancellation policy against competitors and market demand shifts in Zephyrhills.
Zephyrhills STR Booking Lead Time Analysis (2026)
Average Booking Lead Time by Month
Booking Lead Time Insights for Zephyrhills
- The overall average booking lead time for vacation rentals in Zephyrhills is 35 days.
- Guests book furthest in advance for stays during February (average 59 days), likely coinciding with peak travel demand or local events.
- The shortest booking windows occur for stays in July (average 12 days), indicating more last-minute travel plans during this time.
- Seasonally, Winter (49 days avg.) sees the longest lead times, while Summer (15 days avg.) has the shortest, reflecting typical travel planning cycles.
Recommendations for Hosts
- Use the overall average lead time (35 days) as a baseline for your pricing and availability strategy in Zephyrhills.
- For February stays, consider implementing length-of-stay discounts or slightly higher rates for bookings made less than 59 days out to capitalize on advance planning.
- During July, focus on last-minute booking availability and promotions, as guests book with very short notice (12 days avg.).
- Target marketing efforts for the Winter season well in advance (at least 49 days) to capture early planners.
- Monitor your own booking lead times against these Zephyrhills averages to identify opportunities for dynamic pricing adjustments.
Popular & Essential Airbnb Amenities in Zephyrhills (2026)
Amenity Prevalence
Amenity Insights for Zephyrhills
- Essential amenities in Zephyrhills that guests expect include: Air conditioning, Free parking on premises, Wifi, TV. Lacking these (any) could significantly impact bookings.
- Popular amenities like Smoke alarm, Kitchen, Hot water are common but not universal. Offering these can provide a competitive edge.
Recommendations for Hosts
- Ensure your listing includes all essential amenities for Zephyrhills: Air conditioning, Free parking on premises, Wifi, TV.
- Prioritize adding missing essentials: Free parking on premises, Wifi, TV.
- Consider adding popular differentiators like Smoke alarm or Kitchen to increase appeal.
- Highlight unique or less common amenities you offer (e.g., hot tub, dedicated workspace, EV charger) in your listing description and photos.
- Regularly check competitor amenities in Zephyrhills to stay competitive.
Zephyrhills Airbnb Guest Demographics & Profile Analysis (2026)
Guest Profile Summary for Zephyrhills
- The typical guest profile for Airbnb in Zephyrhills consists of primarily domestic travelers (94%), often arriving from nearby Tampa, typically belonging to the Post-2000s (Gen Z/Alpha) group (50%), primarily speaking English or Spanish.
- Domestic travelers account for 94.2% of guests.
- Key international markets include United States (94.2%) and Canada (1.1%).
- Top languages spoken are English (67.1%) followed by Spanish (21.7%).
- A significant demographic segment is the Post-2000s (Gen Z/Alpha) group, representing 50% of guests.
Recommendations for Hosts
- Target domestic marketing efforts towards travelers from Tampa and Orlando.
- Tailor amenities and listing descriptions to appeal to the dominant Post-2000s (Gen Z/Alpha) demographic (e.g., highlight fast WiFi, smart home features, local guides).
- Highlight unique local experiences or amenities relevant to the primary guest profile.
- Consider seasonal promotions aligned with peak travel times for key origin markets.
Nearby Short-Term Rental Market Comparison
How does the Zephyrhills Airbnb market stack up against its neighbors? Compare key performance metrics like average monthly revenue, ADR, and occupancy rates in surrounding areas to understand the broader regional STR landscape.
| Market | Active Properties | Monthly Revenue | Daily Rate | Avg. Occupancy |
|---|---|---|---|---|
| Anna Maria island | 587 | $7,996 | $823.96 | 41% |
| Anna Maria | 56 | $6,434 | $692.96 | 52% |
| Reunion | 12 | $6,321 | $580.45 | 44% |
| Vilano Beach | 173 | $5,571 | $442.95 | 45% |
| Indian Rocks Beach | 842 | $5,560 | $419.63 | 49% |
| Siesta Key | 1,175 | $5,206 | $518.91 | 42% |
| Belleair Beach | 94 | $5,086 | $339.65 | 53% |
| Bradenton Beach | 122 | $4,977 | $507.12 | 42% |
| Thonotosassa | 17 | $4,309 | $347.75 | 50% |
| Seminole | 519 | $4,223 | $316.69 | 52% |