Winding Cypress Airbnb Market Analysis 2026: Short Term Rental Data & Vacation Rental Statistics in Florida, United States
Is Airbnb profitable in Winding Cypress in 2026? Explore comprehensive Airbnb analytics for Winding Cypress, Florida, United States to uncover income potential. This 2026 STR market report for Winding Cypress, based on AirROI data from February 2025 to January 2026, reveals key trends in the niche market of 40 active listings.
Whether you're considering an Airbnb investment in Winding Cypress, optimizing your existing vacation rental, or exploring rental arbitrage opportunities, understanding the Winding Cypress Airbnb data is crucial. Leveraging the low regulation environment is key to maximizing your short term rental income potential. Let's dive into the specifics.
Key Winding Cypress Airbnb Performance Metrics Overview
Monthly Airbnb Revenue Variations & Income Potential in Winding Cypress (2026)
Understanding the monthly revenue variations for Airbnb listings in Winding Cypress is key to maximizing your short term rental income potential. Seasonality significantly impacts earnings. Our analysis, based on data from the past 12 months, shows that the peak revenue month for STRs in Winding Cypress is typically February, while June often presents the lowest earnings, highlighting opportunities for strategic pricing adjustments during shoulder and low seasons. Explore the typical Airbnb income in Winding Cypress across different performance tiers:
- Best-in-class properties (Top 10%) achieve $4,896+ monthly, often utilizing dynamic pricing and superior guest experiences.
- Strong performing properties (Top 25%) earn $3,573 or more, indicating effective management and desirable locations/amenities.
- Typical properties (Median) generate around $2,399 per month, representing the average market performance.
- Entry-level properties (Bottom 25%) see earnings around $1,238, often with potential for optimization.
Average Monthly Airbnb Earnings Trend in Winding Cypress
Winding Cypress Airbnb Occupancy Rate Trends (2026)
Maximize your bookings by understanding the Winding Cypress STR occupancy trends. Seasonal demand shifts significantly influence how often properties are booked. Typically, Februarysees the highest demand (peak season occupancy), while June experiences the lowest (low season). Effective strategies, like adjusting minimum stays or offering promotions, can boost occupancy during slower periods. Here's how different property tiers perform in Winding Cypress:
- Best-in-class properties (Top 10%) achieve 72%+ occupancy, indicating high desirability and potentially optimized availability.
- Strong performing properties (Top 25%) maintain 54% or higher occupancy, suggesting good market fit and guest satisfaction.
- Typical properties (Median) have an occupancy rate around 33%.
- Entry-level properties (Bottom 25%) average 21% occupancy, potentially facing higher vacancy.
Average Monthly Occupancy Rate Trend in Winding Cypress
Average Daily Rate (ADR) Airbnb Trends in Winding Cypress (2026)
Effective short term rental pricing strategy in Winding Cypress involves understanding monthly ADR fluctuations. The Average Daily Rate (ADR) for Airbnb in Winding Cypress typically peaks in January and dips lowest during July. Leveraging Airbnb dynamic pricing tools or strategies based on this seasonality can significantly boost revenue. Here's a look at the typical nightly rates achieved:
- Best-in-class properties (Top 10%) command rates of $348+ per night, often due to premium features or locations.
- Strong performing properties (Top 25%) achieve nightly rates of $259 or more.
- Typical properties (Median) charge around $202 per night.
- Entry-level properties (Bottom 25%) earn around $163 per night.
Average Daily Rate (ADR) Trend by Month in Winding Cypress
Get Live Winding Cypress Market Intelligence 👇

Explore Real-time Analytics
Airbnb Seasonality Analysis & Trends in Winding Cypress (2026)
Peak Season (February, March, April)
- Revenue averages $4,547 per month
- Occupancy rates average 56.8%
- Daily rates average $231
Shoulder Season
- Revenue averages $2,241 per month
- Occupancy maintains around 34.3%
- Daily rates hold near $226
Low Season (May, June, September)
- Revenue drops to average $1,656 per month
- Occupancy decreases to average 30.0%
- Daily rates adjust to average $203
Seasonality Insights for Winding Cypress
- The Airbnb seasonality in Winding Cypress shows highly seasonal trends requiring careful strategy. While the sections above show seasonal averages, it's also insightful to look at the extremes:
- During the high season, the absolute peak month showcases Winding Cypress's highest earning potential, with monthly revenues capable of climbing to $5,244, occupancy reaching a high of 64.1%, and ADRs peaking at $270.
- Conversely, the slowest single month of the year, typically falling within the low season, marks the market's lowest point. In this month, revenue might dip to $1,527, occupancy could drop to 26.4%, and ADRs may adjust down to $194.
- Understanding both the seasonal averages and these monthly peaks and troughs in revenue, occupancy, and ADR is crucial for maximizing your Airbnb profit potential in Winding Cypress.
Seasonal Strategies for Maximizing Profit
- Peak Season: Maximize revenue through premium pricing and potentially longer minimum stays. Ensure high availability.
- Low Season: Offer competitive pricing, special promotions (e.g., extended stay discounts), and flexible cancellation policies. Target off-season travelers like remote workers or budget-conscious guests.
- Shoulder Seasons: Implement dynamic pricing that balances peak and low rates. Target weekend travelers or specific events. Offer slightly more flexible terms than peak season.
- Regularly analyze your own performance against these Winding Cypress seasonality benchmarks and adjust your pricing and availability strategy accordingly.
Best Areas for Airbnb Investment in Winding Cypress (2026)
Exploring the top neighborhoods for short-term rentals in Winding Cypress? This section highlights key areas, outlining why they are attractive for hosts and guests, along with notable local attractions. Consider these locations based on your target guest profile and investment strategy.
| Neighborhood / Area | Why Host Here? (Target Guests & Appeal) | Key Attractions & Landmarks |
|---|---|---|
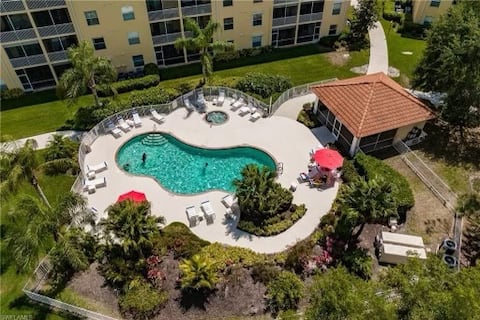
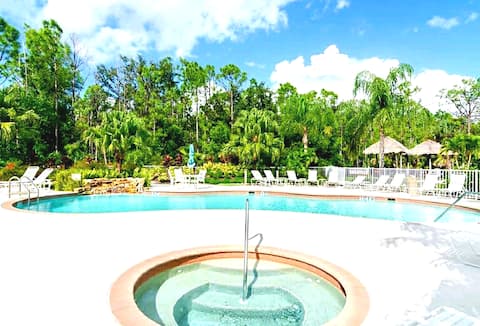
| Winding Cypress | A beautiful gated community in Naples with a focus on nature and outdoor activities. Ideal for those seeking a peaceful retreat in sunny Florida, attracting families and retirees alike. | Nature trails, Lakeside clubhouse, Resort-style pool, Fitness center, Tennis courts |
| Naples Beach | One of Florida's most desirable beach destinations known for its beautiful white sand beaches and upscale dining and shopping. A prime area for attracting vacationers wanting a luxurious beach experience. | Naples Pier, Tin City, Clam Pass Park, Fifth Avenue South, Crayton Cove |
| Downtown Naples | The heart of Naples, featuring vibrant shopping, dining, and cultural experiences. Extremely popular with tourists and offers numerous upscale options for accommodation. | Naples Art Association, The Baker Museum, Naples Botanical Garden, The Village Shops on Venetian Bay, Cultural events year-round |
| Marco Island | A popular island destination close to Winding Cypress, known for its beautiful beaches and water activities. It's a favorite spot for families and beach lovers. | South Marco Beach, Tigertail Beach, Marco Island Historical Museum, Cape Romano, Watersports rentals |
| Golden Gate Estates | A vast area with a mix of residential properties and natural landscapes, suitable for guests looking for a more relaxed and private vacation experience. | Big Cypress National Preserve, Picayune Strand State Forest, Local farms and markets, Wildflower preserve |
| Vanderbilt Beach | A sought-after beach area known for upscale living and beautiful sunsets. Excellent for vacation rentals that cater to beachgoers. | Vanderbilt Beach Park, Delnor-Wiggins Pass State Park, Tennis facilities, Water sports rentals, Dining options by the beach |
| Pelican Bay | An upscale community that offers high-end homes and direct access to beautiful beaches. Attractive to those looking for a luxury stay. | Pelican Bay Beach, Artis—Naples, The Commons, Nearby shopping and dining, Nature preserves |
| Lely Resort | A luxury community known for its golf courses and resort-style amenities. Attractive for vacationers looking for leisure and relaxation. | Lely Resort Golf and Country Club, The Players Club and Spa, Nature trails, Community events, Swimming pools |
Understanding Airbnb License Requirements & STR Laws in Winding Cypress (2026)
While Winding Cypress, Florida, United States currently shows low STR regulations, specific Airbnb license requirements might still exist or change. Always verify the latest short term rental regulations and Airbnb license requirements directly with local government authorities for Winding Cypress to ensure full compliance before hosting.
(Source: AirROI data, 2026, finding no licensed listings among those analyzed)
Top Performing Airbnb Properties in Winding Cypress (2026)
Benchmark your potential! Explore examples of top-performing Airbnb properties in Winding Cypressbased on Trailing Twelve Month (TTM) revenue. Analyze their characteristics, revenue, occupancy rate, and ADR to understand what drives success in this market.
Coral Falls Lely 2b/2b(South Naples) 1st floor
Entire Place • 2 bedrooms
Fully Renovated Naples, FL Condo at Lely Resort
Entire Place • 2 bedrooms
Luxe Top-Floor Condo in Beautiful Lely Resort
Entire Place • 2 bedrooms

Great Find! Free Breakfast, Onsite Pool & Fitness
Entire Place • 1 bedroom
5* Star Coral Falls, in Lely, Naples Florida
Entire Place • 2 bedrooms
Immaculate Naples Condo! Close to Marco Island!
Entire Place • 2 bedrooms
Note: Performance varies based on location, size, amenities, seasonality, and management quality. Data reflects the past 12 months.
Top Performing Airbnb Hosts in Winding Cypress (2026)
Learn from the best! This table showcases top-performing Airbnb hosts in Winding Cypress based on the number of properties managed and estimated total revenue over the past year. Analyze their scale and performance metrics.
| Host Name | Properties | Grossing Revenue | Stay Reviews | Avg Rating |
|---|---|---|---|---|
| Evolve | 3 | $80,427 | 57 | 4.92/5.0 |
| RoomPicks By Victoria | 3 | $63,203 | 169 | 4.75/5.0 |
| Chris | 1 | $56,217 | 21 | 4.86/5.0 |
| Sarah | 1 | $46,409 | 11 | 5.00/5.0 |
| Stefanie | 2 | $39,110 | 15 | 5.00/5.0 |
| Constance | 1 | $34,275 | 41 | 4.95/5.0 |
| Chris | 1 | $34,102 | 14 | 4.93/5.0 |
| Lidia | 1 | $30,354 | 36 | 5.00/5.0 |
| Angela | 1 | $26,025 | 15 | 4.93/5.0 |
| Jenifer | 1 | $20,901 | 32 | 5.00/5.0 |
Analyzing the strategies of top hosts, such as their property selection, pricing, and guest communication, can offer valuable lessons for optimizing your own Airbnb operations in Winding Cypress.
Dive Deeper: Advanced Winding Cypress STR Market Data (2026)
Ready to unlock more insights? AirROI provides access to advanced metrics and comprehensive Airbnb data for Winding Cypress. Explore detailed analytics beyond this report to refine your investment strategy, optimize pricing, and maximize your vacation rental profits.
Explore Advanced MetricsWinding Cypress Short-Term Rental Market Composition (2026): Property & Room Types
Room Type Distribution
Property Type Distribution
Market Composition Insights for Winding Cypress
- The Winding Cypress Airbnb market composition is heavily skewed towards Entire Home/Apt listings, which make up 100% of the 40 active rentals. This indicates strong guest preference for privacy and space.
- Looking at the property type distribution in Winding Cypress, Apartment/Condo properties are the most common (62.5%), reflecting the local real estate landscape.
- Houses represent a significant 37.5% portion, catering likely to families or larger groups.
Winding Cypress Airbnb Room Capacity Analysis (2026): Bedroom Distribution
Distribution of Listings by Number of Bedrooms
Room Capacity Insights for Winding Cypress
- The dominant room capacity in Winding Cypress is 2 bedrooms listings, making up 65% of the market. This suggests a strong demand for properties suitable for couples or solo travelers.
- Together, 2 bedrooms and 3 bedrooms properties represent 92.5% of the active Airbnb listings in Winding Cypress, indicating a high concentration in these sizes.
- A significant 30.0% of listings offer 3+ bedrooms, catering to larger groups and families seeking more space in Winding Cypress.
Winding Cypress Vacation Rental Guest Capacity Trends (2026)
Distribution of Listings by Guest Capacity
Guest Capacity Insights for Winding Cypress
- The most common guest capacity trend in Winding Cypress vacation rentals is listings accommodating 6 guests (50%). This suggests the primary traveler segment is likely larger groups.
- Properties designed for 6 guests and 4 guests dominate the Winding Cypress STR market, accounting for 80.0% of listings.
- 65.0% of properties accommodate 6+ guests, serving the market segment for larger families or group travel in Winding Cypress.
- On average, properties in Winding Cypress are equipped to host 5.5 guests.
Winding Cypress Airbnb Booking Patterns (2026): Available vs. Booked Days
Available Days Distribution
Booked Days Distribution
Booking Pattern Insights for Winding Cypress
- The most common availability pattern in Winding Cypress falls within the 271-366 days range, representing 75% of listings. This suggests many properties have significant open periods on their calendars.
- Approximately 95.0% of listings show high availability (181+ days open annually), indicating potential for increased bookings or specific owner usage patterns.
- For booked days, the 31-90 days range is most frequent in Winding Cypress (35%), reflecting common guest stay durations or potential owner blocking patterns.
- A notable 7.5% of properties secure long booking periods (181+ days booked per year), highlighting successful long-term rental strategies or significant owner usage.
Winding Cypress Airbnb Minimum Stay Requirements Analysis
Distribution of Listings by Minimum Night Requirement
1 Night
4 listings
10% of total
3 Nights
1 listings
2.5% of total
4-6 Nights
9 listings
22.5% of total
7-29 Nights
15 listings
37.5% of total
30+ Nights
11 listings
27.5% of total
Key Insights
- The most prevalent minimum stay requirement in Winding Cypress is 7-29 Nights, adopted by 37.5% of listings. This highlights the market's preference for shorter, flexible bookings.
- Very short stays (1-2 nights) are less common (10.0%), suggesting hosts prefer slightly longer bookings to optimize turnover.
- A significant segment (27.5%) caters to monthly stays (30+ nights) in Winding Cypress, pointing to opportunities in the extended-stay market.
Recommendations
- Align with the market by considering a 7-29 Nights minimum stay, as 37.5% of Winding Cypress hosts use this setting.
- If feasible, allowing 1-night stays, especially midweek or during low season, could capture last-minute bookings, as only 10% currently do.
- Explore offering discounts for stays of 30+ nights to attract the 27.5% of the market seeking extended stays.
- Adjust minimum nights based on seasonality – potentially shorter during low season and longer during peak demand periods in Winding Cypress.
Winding Cypress Airbnb Cancellation Policy Trends Analysis (2026)
Super Strict 30 Days
1 listings
2.5% of total
Super Strict 60 Days
1 listings
2.5% of total
Moderate
7 listings
17.5% of total
Firm
18 listings
45% of total
Strict
13 listings
32.5% of total
Cancellation Policy Insights for Winding Cypress
- The prevailing Airbnb cancellation policy trend in Winding Cypress is Firm, used by 45% of listings.
- A majority (77.5%) of hosts in Winding Cypress utilize Firm or Strict policies, indicating a market where hosts prioritize booking security.
Recommendations for Hosts
- Consider adopting a Firm policy to align with the 45% market standard in Winding Cypress.
- With 32.5% using Strict terms, this is a viable option in Winding Cypress, particularly for high-value properties or during peak demand periods.
- Regularly review your cancellation policy against competitors and market demand shifts in Winding Cypress.
Winding Cypress STR Booking Lead Time Analysis (2026)
Average Booking Lead Time by Month
Booking Lead Time Insights for Winding Cypress
- The overall average booking lead time for vacation rentals in Winding Cypress is 64 days.
- Guests book furthest in advance for stays during March (average 143 days), likely coinciding with peak travel demand or local events.
- The shortest booking windows occur for stays in October (average 24 days), indicating more last-minute travel plans during this time.
- Seasonally, Spring (100 days avg.) sees the longest lead times, while Summer (32 days avg.) has the shortest, reflecting typical travel planning cycles.
Recommendations for Hosts
- Use the overall average lead time (64 days) as a baseline for your pricing and availability strategy in Winding Cypress.
- For March stays, consider implementing length-of-stay discounts or slightly higher rates for bookings made less than 143 days out to capitalize on advance planning.
- Target marketing efforts for the Spring season well in advance (at least 100 days) to capture early planners.
- Monitor your own booking lead times against these Winding Cypress averages to identify opportunities for dynamic pricing adjustments.
Popular & Essential Airbnb Amenities in Winding Cypress (2026)
Amenity Prevalence
Amenity Insights for Winding Cypress
- Essential amenities in Winding Cypress that guests expect include: Washer, Kitchen, Wifi, Free parking on premises, Dryer, Pool, TV, Air conditioning, Smoke alarm. Lacking these (any) could significantly impact bookings.
- Popular amenities like Hangers are common but not universal. Offering these can provide a competitive edge.
Recommendations for Hosts
- Ensure your listing includes all essential amenities for Winding Cypress: Washer, Kitchen, Wifi, Free parking on premises, Dryer, Pool, TV, Air conditioning, Smoke alarm.
- Prioritize adding missing essentials: Dryer, Pool, TV, Air conditioning, Smoke alarm.
- Consider adding popular differentiators like Hangers to increase appeal.
- Highlight unique or less common amenities you offer (e.g., hot tub, dedicated workspace, EV charger) in your listing description and photos.
- Regularly check competitor amenities in Winding Cypress to stay competitive.
Winding Cypress Airbnb Guest Demographics & Profile Analysis (2026)
Guest Profile Summary for Winding Cypress
- The typical guest profile for Airbnb in Winding Cypress consists of primarily domestic travelers (77%), often arriving from nearby Toronto, typically belonging to the Post-2000s (Gen Z/Alpha) group (50%), primarily speaking English or Spanish.
- Domestic travelers account for 77.4% of guests.
- Key international markets include United States (77.4%) and Canada (7.5%).
- Top languages spoken are English (72%) followed by Spanish (12%).
- A significant demographic segment is the Post-2000s (Gen Z/Alpha) group, representing 50% of guests.
Recommendations for Hosts
- Target domestic marketing efforts towards travelers from Toronto and Wales.
- Tailor amenities and listing descriptions to appeal to the dominant Post-2000s (Gen Z/Alpha) demographic (e.g., highlight fast WiFi, smart home features, local guides).
- Highlight unique local experiences or amenities relevant to the primary guest profile.
- Consider seasonal promotions aligned with peak travel times for key origin markets.
Nearby Short-Term Rental Market Comparison
How does the Winding Cypress Airbnb market stack up against its neighbors? Compare key performance metrics like average monthly revenue, ADR, and occupancy rates in surrounding areas to understand the broader regional STR landscape.
| Market | Active Properties | Monthly Revenue | Daily Rate | Avg. Occupancy |
|---|---|---|---|---|
| Sailfish Point | 19 | $16,709 | $1587.63 | 48% |
| Bal Harbour Village | 37 | $8,846 | $850.63 | 34% |
| Anna Maria island | 587 | $7,996 | $823.96 | 41% |
| Lake Clarke Shores | 26 | $6,710 | $516.52 | 46% |
| Anna Maria | 56 | $6,434 | $692.96 | 52% |
| Lighthouse Point | 75 | $6,205 | $472.94 | 51% |
| Boca Grande | 31 | $6,128 | $787.07 | 37% |
| Pinecrest | 11 | $6,117 | $861.24 | 43% |
| North Bay Village | 120 | $6,032 | $561.12 | 44% |
| Indian Rocks Beach | 842 | $5,560 | $419.63 | 49% |