Wellington Airbnb Market Analysis 2026: Short Term Rental Data & Vacation Rental Statistics in Florida, United States
Is Airbnb profitable in Wellington in 2026? Explore comprehensive Airbnb analytics for Wellington, Florida, United States to uncover income potential. This 2026 STR market report for Wellington, based on AirROI data from February 2025 to January 2026, reveals key trends in the niche market of 177 active listings.
Whether you're considering an Airbnb investment in Wellington, optimizing your existing vacation rental, or exploring rental arbitrage opportunities, understanding the Wellington Airbnb data is crucial. Navigating the high regulation landscape is key to maximizing your short term rental income potential. Let's dive into the specifics.
Key Wellington Airbnb Performance Metrics Overview
Monthly Airbnb Revenue Variations & Income Potential in Wellington (2026)
Understanding the monthly revenue variations for Airbnb listings in Wellington is key to maximizing your short term rental income potential. Seasonality significantly impacts earnings. Our analysis, based on data from the past 12 months, shows that the peak revenue month for STRs in Wellington is typically March, while September often presents the lowest earnings, highlighting opportunities for strategic pricing adjustments during shoulder and low seasons. Explore the typical Airbnb income in Wellington across different performance tiers:
- Best-in-class properties (Top 10%) achieve $8,858+ monthly, often utilizing dynamic pricing and superior guest experiences.
- Strong performing properties (Top 25%) earn $5,810 or more, indicating effective management and desirable locations/amenities.
- Typical properties (Median) generate around $3,433 per month, representing the average market performance.
- Entry-level properties (Bottom 25%) see earnings around $1,626, often with potential for optimization.
Average Monthly Airbnb Earnings Trend in Wellington
Wellington Airbnb Occupancy Rate Trends (2026)
Maximize your bookings by understanding the Wellington STR occupancy trends. Seasonal demand shifts significantly influence how often properties are booked. Typically, Marchsees the highest demand (peak season occupancy), while September experiences the lowest (low season). Effective strategies, like adjusting minimum stays or offering promotions, can boost occupancy during slower periods. Here's how different property tiers perform in Wellington:
- Best-in-class properties (Top 10%) achieve 85%+ occupancy, indicating high desirability and potentially optimized availability.
- Strong performing properties (Top 25%) maintain 68% or higher occupancy, suggesting good market fit and guest satisfaction.
- Typical properties (Median) have an occupancy rate around 46%.
- Entry-level properties (Bottom 25%) average 24% occupancy, potentially facing higher vacancy.
Average Monthly Occupancy Rate Trend in Wellington
Average Daily Rate (ADR) Airbnb Trends in Wellington (2026)
Effective short term rental pricing strategy in Wellington involves understanding monthly ADR fluctuations. The Average Daily Rate (ADR) for Airbnb in Wellington typically peaks in January and dips lowest during August. Leveraging Airbnb dynamic pricing tools or strategies based on this seasonality can significantly boost revenue. Here's a look at the typical nightly rates achieved:
- Best-in-class properties (Top 10%) command rates of $524+ per night, often due to premium features or locations.
- Strong performing properties (Top 25%) achieve nightly rates of $371 or more.
- Typical properties (Median) charge around $267 per night.
- Entry-level properties (Bottom 25%) earn around $168 per night.
Average Daily Rate (ADR) Trend by Month in Wellington
Get Live Wellington Market Intelligence 👇

Explore Real-time Analytics
Airbnb Seasonality Analysis & Trends in Wellington (2026)
Peak Season (March, February, December)
- Revenue averages $6,519 per month
- Occupancy rates average 59.4%
- Daily rates average $335
Shoulder Season
- Revenue averages $3,981 per month
- Occupancy maintains around 45.7%
- Daily rates hold near $315
Low Season (May, June, September)
- Revenue drops to average $2,793 per month
- Occupancy decreases to average 37.4%
- Daily rates adjust to average $287
Seasonality Insights for Wellington
- The Airbnb seasonality in Wellington shows highly seasonal trends requiring careful strategy. While the sections above show seasonal averages, it's also insightful to look at the extremes:
- During the high season, the absolute peak month showcases Wellington's highest earning potential, with monthly revenues capable of climbing to $7,504, occupancy reaching a high of 68.5%, and ADRs peaking at $366.
- Conversely, the slowest single month of the year, typically falling within the low season, marks the market's lowest point. In this month, revenue might dip to $2,685, occupancy could drop to 35.9%, and ADRs may adjust down to $280.
- Understanding both the seasonal averages and these monthly peaks and troughs in revenue, occupancy, and ADR is crucial for maximizing your Airbnb profit potential in Wellington.
Seasonal Strategies for Maximizing Profit
- Peak Season: Maximize revenue through premium pricing and potentially longer minimum stays. Ensure high availability.
- Low Season: Offer competitive pricing, special promotions (e.g., extended stay discounts), and flexible cancellation policies. Target off-season travelers like remote workers or budget-conscious guests.
- Shoulder Seasons: Implement dynamic pricing that balances peak and low rates. Target weekend travelers or specific events. Offer slightly more flexible terms than peak season.
- Regularly analyze your own performance against these Wellington seasonality benchmarks and adjust your pricing and availability strategy accordingly.
Best Areas for Airbnb Investment in Wellington (2026)
Exploring the top neighborhoods for short-term rentals in Wellington? This section highlights key areas, outlining why they are attractive for hosts and guests, along with notable local attractions. Consider these locations based on your target guest profile and investment strategy.
| Neighborhood / Area | Why Host Here? (Target Guests & Appeal) | Key Attractions & Landmarks |
|---|---|---|
| Palm Beach | Elegant coastal community known for its luxury lifestyle, beautiful beaches, and upscale shopping. Ideal for attracting affluent travelers seeking a high-end getaway. | Worth Avenue, Palm Beach Botanical Garden, Flagler Museum, Lake Trail, Ritz-Carlton Beach |
| Wellington Village Center | The heart of Wellington with convenient access to shops, restaurants, and parks. Perfect for families and travelers looking for a suburban experience with amenities. | Wellington Green Mall, Village Park, Wellington Community Center, International Polo Club, Crestwood Park |
| Binks Forest | Quiet suburban neighborhood known for its family-friendly atmosphere and proximity to equestrian events. Attracts visitors seeking a peaceful retreat close to outdoor activities. | Binks Forest Golf Club, Wellington Equestrian Festival, Pinewood Park, Greenview Shores Park |
| Geneva | Charming neighborhood close to major roads and amenities, appealing to both short-term visitors and families. Offers a blend of suburban life and accessibility to attractions. | Geneva Park, Wellington Theaters, Pinewood Golf Club, local dining options |
| South Shore | Residential area with a mix of new developments and established homes, ideal for hosting families and tourists seeking a quiet environment with recreational options. | South Shore Park, community recreation centers, local shops and cafes |
| Eastwood | Family-friendly neighborhood known for its parks and close-knit community vibe. Attractive for families looking for comfortable, spacious accommodations. | Eastwood Park, Wellington Mall, local schools, family entertainment centers |
| Cypress | A serene community with beautiful parks and access to nature, suited for visitors looking to unwind in tranquil surroundings. | Cypress Park, nature trails, outdoor sports facilities |
| Wellington Reserve | A gated community that offers security and privacy, appealing to visitors looking for a safe and peaceful living environment during their stay. | nearby shopping options, community events, pools and recreational areas |
Understanding Airbnb License Requirements & STR Laws in Wellington (2026)
Yes, Wellington, Florida, United States enforces high STR regulations. Obtaining a license and ensuring compliance is almost certainly required according to current 2026 STR laws. Always verify the latest short term rental regulations and Airbnb license requirements directly with local government authorities for Wellington to ensure full compliance before hosting.
(Source: AirROI data, 2026, based on 91% licensed listings)
Top Performing Airbnb Properties in Wellington (2026)
Benchmark your potential! Explore examples of top-performing Airbnb properties in Wellingtonbased on Trailing Twelve Month (TTM) revenue. Analyze their characteristics, revenue, occupancy rate, and ADR to understand what drives success in this market.
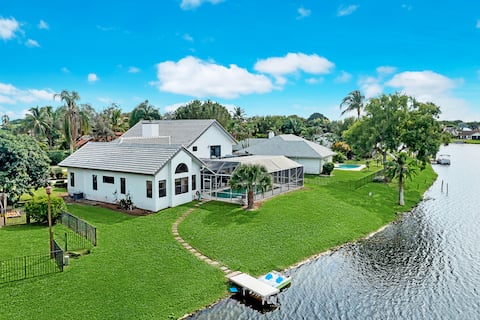
Equistarian Lakefront Escape: Heated Pool & Spa
Entire Place • 6 bedrooms
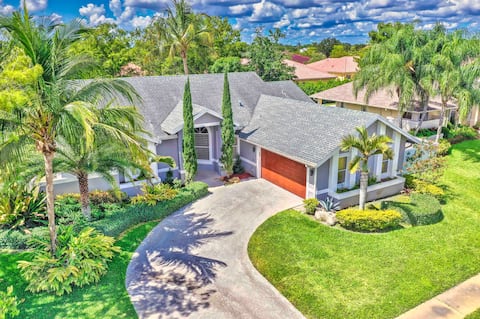
Cozy and Serene 4 bedrooms Family home with pool
Entire Place • 4 bedrooms
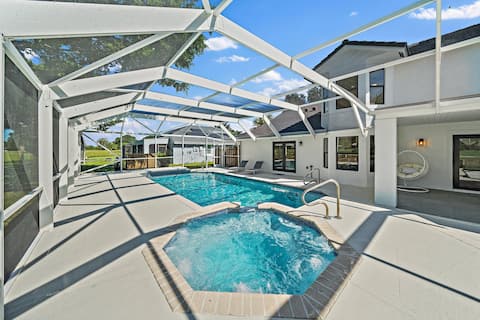
6BR Luxury Villa with Pool & Spa
Entire Place • 6 bedrooms
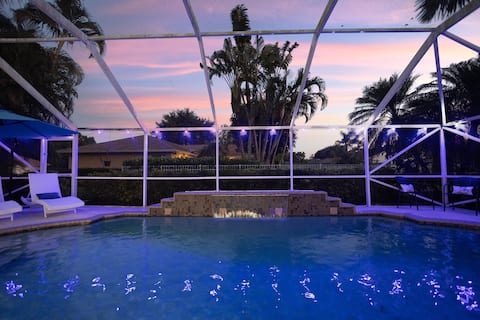
Sunshine Escape! Equestrian Resort! Wellinton-WPB
Entire Place • 4 bedrooms

Spectacular Wellington Oasis Breathtaking Gardens
Entire Place • 4 bedrooms
1 Paradize for equestrian lovers Sugar Pond Manor
Entire Place • 4 bedrooms
Note: Performance varies based on location, size, amenities, seasonality, and management quality. Data reflects the past 12 months.
Top Performing Airbnb Hosts in Wellington (2026)
Learn from the best! This table showcases top-performing Airbnb hosts in Wellington based on the number of properties managed and estimated total revenue over the past year. Analyze their scale and performance metrics.
| Host Name | Properties | Grossing Revenue | Stay Reviews | Avg Rating |
|---|---|---|---|---|
| Roman | 5 | $243,219 | 171 | 4.84/5.0 |
| Alex | 3 | $194,697 | 261 | 4.82/5.0 |
| Pinny And Ushey | 1 | $178,081 | 51 | 4.82/5.0 |
| Susan | 2 | $153,729 | 27 | 4.89/5.0 |
| Clare | 3 | $144,048 | 370 | 4.86/5.0 |
| Angela M. | 7 | $133,489 | 838 | 4.83/5.0 |
| Valeriya | 1 | $122,079 | 89 | 4.69/5.0 |
| Lisdey | 2 | $115,215 | 145 | 4.93/5.0 |
| Jodi | 1 | $106,074 | 85 | 4.82/5.0 |
| Evolve | 6 | $104,280 | 66 | 4.66/5.0 |
Analyzing the strategies of top hosts, such as their property selection, pricing, and guest communication, can offer valuable lessons for optimizing your own Airbnb operations in Wellington.
Dive Deeper: Advanced Wellington STR Market Data (2026)
Ready to unlock more insights? AirROI provides access to advanced metrics and comprehensive Airbnb data for Wellington. Explore detailed analytics beyond this report to refine your investment strategy, optimize pricing, and maximize your vacation rental profits.
Explore Advanced MetricsWellington Short-Term Rental Market Composition (2026): Property & Room Types
Room Type Distribution
Property Type Distribution
Market Composition Insights for Wellington
- The Wellington Airbnb market composition is heavily skewed towards Entire Home/Apt listings, which make up 96% of the 177 active rentals. This indicates strong guest preference for privacy and space.
- Looking at the property type distribution in Wellington, House properties are the most common (75.7%), reflecting the local real estate landscape.
- Houses represent a significant 75.7% portion, catering likely to families or larger groups.
- The presence of 5.1% Hotel/Boutique listings indicates integration with traditional hospitality.
- Smaller segments like outdoor/unique (combined 1.1%) offer potential for unique stay experiences.
Wellington Airbnb Room Capacity Analysis (2026): Bedroom Distribution
Distribution of Listings by Number of Bedrooms
Room Capacity Insights for Wellington
- The dominant room capacity in Wellington is 3 bedrooms listings, making up 28.8% of the market. This suggests a strong demand for properties suitable for families or small groups.
- Together, 3 bedrooms and 4 bedrooms properties represent 56.5% of the active Airbnb listings in Wellington, indicating a high concentration in these sizes.
- A significant 65.0% of listings offer 3+ bedrooms, catering to larger groups and families seeking more space in Wellington.
Wellington Vacation Rental Guest Capacity Trends (2026)
Distribution of Listings by Guest Capacity
Guest Capacity Insights for Wellington
- The most common guest capacity trend in Wellington vacation rentals is listings accommodating 8+ guests (36.7%). This suggests the primary traveler segment is likely larger groups.
- Properties designed for 8+ guests and 6 guests dominate the Wellington STR market, accounting for 63.3% of listings.
- 66.1% of properties accommodate 6+ guests, serving the market segment for larger families or group travel in Wellington.
- On average, properties in Wellington are equipped to host 5.7 guests.
Wellington Airbnb Booking Patterns (2026): Available vs. Booked Days
Available Days Distribution
Booked Days Distribution
Booking Pattern Insights for Wellington
- The most common availability pattern in Wellington falls within the 271-366 days range, representing 44.1% of listings. This suggests many properties have significant open periods on their calendars.
- Approximately 84.2% of listings show high availability (181+ days open annually), indicating potential for increased bookings or specific owner usage patterns.
- For booked days, the 91-180 days range is most frequent in Wellington (40.7%), reflecting common guest stay durations or potential owner blocking patterns.
- A notable 17.0% of properties secure long booking periods (181+ days booked per year), highlighting successful long-term rental strategies or significant owner usage.
Wellington Airbnb Minimum Stay Requirements Analysis
Distribution of Listings by Minimum Night Requirement
1 Night
23 listings
13% of total
2 Nights
31 listings
17.5% of total
3 Nights
19 listings
10.7% of total
4-6 Nights
25 listings
14.1% of total
7-29 Nights
23 listings
13% of total
30+ Nights
56 listings
31.6% of total
Key Insights
- The most prevalent minimum stay requirement in Wellington is 30+ Nights, adopted by 31.6% of listings. This highlights the market's preference for longer commitments.
- A significant segment (31.6%) caters to monthly stays (30+ nights) in Wellington, pointing to opportunities in the extended-stay market.
Recommendations
- Align with the market by considering a 30+ Nights minimum stay, as 31.6% of Wellington hosts use this setting.
- If feasible, allowing 1-night stays, especially midweek or during low season, could capture last-minute bookings, as only 13% currently do.
- Explore offering discounts for stays of 30+ nights to attract the 31.6% of the market seeking extended stays.
- Adjust minimum nights based on seasonality – potentially shorter during low season and longer during peak demand periods in Wellington.
Wellington Airbnb Cancellation Policy Trends Analysis (2026)
Limited
1 listings
0.6% of total
Super Strict 30 Days
2 listings
1.1% of total
Flexible
30 listings
17% of total
Moderate
36 listings
20.5% of total
Firm
66 listings
37.5% of total
Strict
41 listings
23.3% of total
Cancellation Policy Insights for Wellington
- The prevailing Airbnb cancellation policy trend in Wellington is Firm, used by 37.5% of listings.
- A majority (60.8%) of hosts in Wellington utilize Firm or Strict policies, indicating a market where hosts prioritize booking security.
Recommendations for Hosts
- Consider adopting a Firm policy to align with the 37.5% market standard in Wellington.
- Regularly review your cancellation policy against competitors and market demand shifts in Wellington.
Wellington STR Booking Lead Time Analysis (2026)
Average Booking Lead Time by Month
Booking Lead Time Insights for Wellington
- The overall average booking lead time for vacation rentals in Wellington is 49 days.
- Guests book furthest in advance for stays during February (average 84 days), likely coinciding with peak travel demand or local events.
- The shortest booking windows occur for stays in September (average 21 days), indicating more last-minute travel plans during this time.
- Seasonally, Winter (67 days avg.) sees the longest lead times, while Summer (24 days avg.) has the shortest, reflecting typical travel planning cycles.
Recommendations for Hosts
- Use the overall average lead time (49 days) as a baseline for your pricing and availability strategy in Wellington.
- For February stays, consider implementing length-of-stay discounts or slightly higher rates for bookings made less than 84 days out to capitalize on advance planning.
- Target marketing efforts for the Winter season well in advance (at least 67 days) to capture early planners.
- Monitor your own booking lead times against these Wellington averages to identify opportunities for dynamic pricing adjustments.
Popular & Essential Airbnb Amenities in Wellington (2026)
Amenity Prevalence
Amenity Insights for Wellington
- Essential amenities in Wellington that guests expect include: Free parking on premises, Wifi, TV, Air conditioning, Smoke alarm. Lacking these (any) could significantly impact bookings.
- Popular amenities like Kitchen, Hot water, Microwave are common but not universal. Offering these can provide a competitive edge.
Recommendations for Hosts
- Ensure your listing includes all essential amenities for Wellington: Free parking on premises, Wifi, TV, Air conditioning, Smoke alarm.
- Prioritize adding missing essentials: Free parking on premises, Wifi, TV, Air conditioning, Smoke alarm.
- Consider adding popular differentiators like Kitchen or Hot water to increase appeal.
- Highlight unique or less common amenities you offer (e.g., hot tub, dedicated workspace, EV charger) in your listing description and photos.
- Regularly check competitor amenities in Wellington to stay competitive.
Wellington Airbnb Guest Demographics & Profile Analysis (2026)
Guest Profile Summary for Wellington
- The typical guest profile for Airbnb in Wellington consists of primarily domestic travelers (90%), often arriving from nearby New York, typically belonging to the Post-2000s (Gen Z/Alpha) group (50%), primarily speaking English or Spanish.
- Domestic travelers account for 89.8% of guests.
- Key international markets include United States (89.8%) and Canada (1.4%).
- Top languages spoken are English (68.4%) followed by Spanish (17.9%).
- A significant demographic segment is the Post-2000s (Gen Z/Alpha) group, representing 50% of guests.
Recommendations for Hosts
- Target domestic marketing efforts towards travelers from New York and West Palm Beach.
- Tailor amenities and listing descriptions to appeal to the dominant Post-2000s (Gen Z/Alpha) demographic (e.g., highlight fast WiFi, smart home features, local guides).
- Highlight unique local experiences or amenities relevant to the primary guest profile.
- Consider seasonal promotions aligned with peak travel times for key origin markets.
Nearby Short-Term Rental Market Comparison
How does the Wellington Airbnb market stack up against its neighbors? Compare key performance metrics like average monthly revenue, ADR, and occupancy rates in surrounding areas to understand the broader regional STR landscape.
| Market | Active Properties | Monthly Revenue | Daily Rate | Avg. Occupancy |
|---|---|---|---|---|
| Sailfish Point | 19 | $16,709 | $1587.63 | 48% |
| Bal Harbour Village | 37 | $8,846 | $850.63 | 34% |
| Lake Clarke Shores | 26 | $6,710 | $516.52 | 46% |
| Lighthouse Point | 75 | $6,205 | $472.94 | 51% |
| Pinecrest | 11 | $6,117 | $861.24 | 43% |
| North Bay Village | 120 | $6,032 | $561.12 | 44% |
| Tequesta | 43 | $4,920 | $376.96 | 50% |
| Juno Beach | 39 | $4,807 | $377.00 | 47% |
| Parkland | 17 | $4,637 | $369.21 | 47% |
| Ocean Ridge | 14 | $4,588 | $602.78 | 48% |