Weeki Wachee Airbnb Market Analysis 2026: Short Term Rental Data & Vacation Rental Statistics in Florida, United States
Is Airbnb profitable in Weeki Wachee in 2026? Explore comprehensive Airbnb analytics for Weeki Wachee, Florida, United States to uncover income potential. This 2026 STR market report for Weeki Wachee, based on AirROI data from February 2025 to January 2026, reveals key trends in the niche market of 52 active listings.
Whether you're considering an Airbnb investment in Weeki Wachee, optimizing your existing vacation rental, or exploring rental arbitrage opportunities, understanding the Weeki Wachee Airbnb data is crucial. Leveraging the low regulation environment is key to maximizing your short term rental income potential. Let's dive into the specifics.
Key Weeki Wachee Airbnb Performance Metrics Overview
Monthly Airbnb Revenue Variations & Income Potential in Weeki Wachee (2026)
Understanding the monthly revenue variations for Airbnb listings in Weeki Wachee is key to maximizing your short term rental income potential. Seasonality significantly impacts earnings. Our analysis, based on data from the past 12 months, shows that the peak revenue month for STRs in Weeki Wachee is typically July, while November often presents the lowest earnings, highlighting opportunities for strategic pricing adjustments during shoulder and low seasons. Explore the typical Airbnb income in Weeki Wachee across different performance tiers:
- Best-in-class properties (Top 10%) achieve $7,503+ monthly, often utilizing dynamic pricing and superior guest experiences.
- Strong performing properties (Top 25%) earn $4,778 or more, indicating effective management and desirable locations/amenities.
- Typical properties (Median) generate around $2,720 per month, representing the average market performance.
- Entry-level properties (Bottom 25%) see earnings around $1,585, often with potential for optimization.
Average Monthly Airbnb Earnings Trend in Weeki Wachee
Weeki Wachee Airbnb Occupancy Rate Trends (2026)
Maximize your bookings by understanding the Weeki Wachee STR occupancy trends. Seasonal demand shifts significantly influence how often properties are booked. Typically, Marchsees the highest demand (peak season occupancy), while January experiences the lowest (low season). Effective strategies, like adjusting minimum stays or offering promotions, can boost occupancy during slower periods. Here's how different property tiers perform in Weeki Wachee:
- Best-in-class properties (Top 10%) achieve 79%+ occupancy, indicating high desirability and potentially optimized availability.
- Strong performing properties (Top 25%) maintain 61% or higher occupancy, suggesting good market fit and guest satisfaction.
- Typical properties (Median) have an occupancy rate around 44%.
- Entry-level properties (Bottom 25%) average 28% occupancy, potentially facing higher vacancy.
Average Monthly Occupancy Rate Trend in Weeki Wachee
Average Daily Rate (ADR) Airbnb Trends in Weeki Wachee (2026)
Effective short term rental pricing strategy in Weeki Wachee involves understanding monthly ADR fluctuations. The Average Daily Rate (ADR) for Airbnb in Weeki Wachee typically peaks in June and dips lowest during October. Leveraging Airbnb dynamic pricing tools or strategies based on this seasonality can significantly boost revenue. Here's a look at the typical nightly rates achieved:
- Best-in-class properties (Top 10%) command rates of $409+ per night, often due to premium features or locations.
- Strong performing properties (Top 25%) achieve nightly rates of $293 or more.
- Typical properties (Median) charge around $198 per night.
- Entry-level properties (Bottom 25%) earn around $149 per night.
Average Daily Rate (ADR) Trend by Month in Weeki Wachee
Get Live Weeki Wachee Market Intelligence 👇

Explore Real-time Analytics
Airbnb Seasonality Analysis & Trends in Weeki Wachee (2026)
Peak Season (July, March, June)
- Revenue averages $4,909 per month
- Occupancy rates average 59.7%
- Daily rates average $252
Shoulder Season
- Revenue averages $3,417 per month
- Occupancy maintains around 44.7%
- Daily rates hold near $233
Low Season (September, November, December)
- Revenue drops to average $2,783 per month
- Occupancy decreases to average 33.5%
- Daily rates adjust to average $227
Seasonality Insights for Weeki Wachee
- The Airbnb seasonality in Weeki Wachee shows moderate seasonality with distinct peak and low periods. While the sections above show seasonal averages, it's also insightful to look at the extremes:
- During the high season, the absolute peak month showcases Weeki Wachee's highest earning potential, with monthly revenues capable of climbing to $5,038, occupancy reaching a high of 65.5%, and ADRs peaking at $260.
- Conversely, the slowest single month of the year, typically falling within the low season, marks the market's lowest point. In this month, revenue might dip to $2,766, occupancy could drop to 32.2%, and ADRs may adjust down to $221.
- Understanding both the seasonal averages and these monthly peaks and troughs in revenue, occupancy, and ADR is crucial for maximizing your Airbnb profit potential in Weeki Wachee.
Seasonal Strategies for Maximizing Profit
- Peak Season: Maximize revenue through premium pricing and potentially longer minimum stays. Ensure high availability.
- Low Season: Offer competitive pricing, special promotions (e.g., extended stay discounts), and flexible cancellation policies. Target off-season travelers like remote workers or budget-conscious guests.
- Shoulder Seasons: Implement dynamic pricing that balances peak and low rates. Target weekend travelers or specific events. Offer slightly more flexible terms than peak season.
- Regularly analyze your own performance against these Weeki Wachee seasonality benchmarks and adjust your pricing and availability strategy accordingly.
Best Areas for Airbnb Investment in Weeki Wachee (2026)
Exploring the top neighborhoods for short-term rentals in Weeki Wachee? This section highlights key areas, outlining why they are attractive for hosts and guests, along with notable local attractions. Consider these locations based on your target guest profile and investment strategy.
| Neighborhood / Area | Why Host Here? (Target Guests & Appeal) | Key Attractions & Landmarks |
|---|---|---|
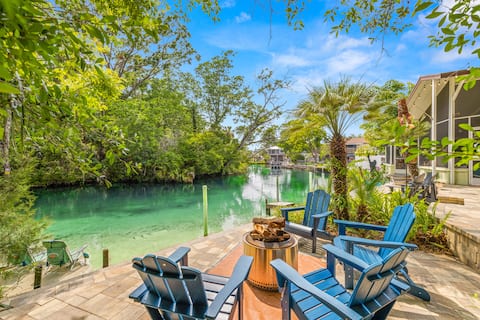
| Weeki Wachee Springs | Famous for its natural springs and mermaid shows, Weeki Wachee is a unique tourist destination that attracts families and nature lovers. It offers visitors an engaging experience with beautiful outdoor activities. | Weeki Wachee Springs State Park, Mermaid Show, Floating down the Weeki Wachee River, Nature trails, Wildlife watching, Kayaking and canoeing |
| Pine Island | A peaceful and scenic location, Pine Island offers a more tranquil Florida experience with access to beautiful waters and a relaxed atmosphere, making it perfect for those seeking a quiet getaway. | Pine Island Beach Park, Local restaurants and shops, Biking and hiking trails, Fishing spots, Kayaking, Sunset views |
| Hernando Beach | A small waterfront community with charming coastal vibes. Great for those looking to enjoy a laid-back lifestyle with boating, fishing, and nearby beaches. | Hernando Beach, Fishing piers, Nature parks, Boat ramps, The Gulf of Mexico access, Local seafood restaurants |
| Chassahowitzka National Wildlife Refuge | This area is a nature lover's paradise, offering kayaking and wildlife viewing opportunities. Attracts eco-tourists and those interested in outdoor adventures. | Kayaking in the refuge, Wildlife viewing, Birdwatching, Nature trails, Scenic paddling routes, Wild citrus groves |
| Cypress Cove | A serene area known for its cypress trees and natural springs, attracting visitors who appreciate Florida's natural beauty and outdoor adventures. | Cypress Cove Park, Fishing spots, Paddling on the rivers, Hiking trails, Nature photography, Scenic views |
| Bayport | A small community with beautiful waterfront homes, Bayport is ideal for vacationers looking to enjoy water activities like boating and fishing. | Bayport Park, Access to the Gulf, Fishing opportunities, Picnic areas, Nature trails, Scenic waterfront views |
| Aripeka | A quaint coastal village that offers a unique glimpse into old Florida living. Ideal for guests seeking peace and quiet away from large tourist crowds. | Sunset views, Nature walks, Local seafood spots, Quiet beaches, Wildlife watching, Historical sites |
| Dunedin | While slightly further away, Dunedin offers a charming downtown area with shops and eateries, and is also close to beautiful beaches, making it popular with tourists. | Dunedin Causeway, Honeymoon Island State Park, Local breweries, Festivals and events, Outdoor markets, Cultural sites |
Understanding Airbnb License Requirements & STR Laws in Weeki Wachee (2026)
While Weeki Wachee, Florida, United States currently shows low STR regulations, specific Airbnb license requirements might still exist or change. Always verify the latest short term rental regulations and Airbnb license requirements directly with local government authorities for Weeki Wachee to ensure full compliance before hosting.
(Source: AirROI data, 2026, finding no licensed listings among those analyzed)
Top Performing Airbnb Properties in Weeki Wachee (2026)
Benchmark your potential! Explore examples of top-performing Airbnb properties in Weeki Wacheebased on Trailing Twelve Month (TTM) revenue. Analyze their characteristics, revenue, occupancy rate, and ADR to understand what drives success in this market.
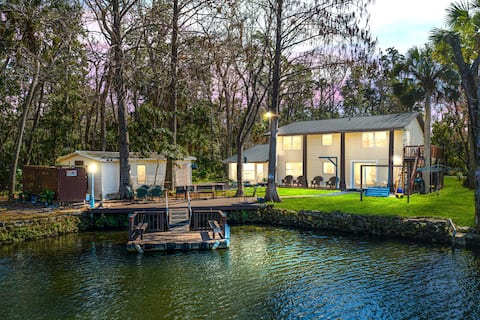
Sasquatch Hideaway: Enjoy Clear Main River Waters
Entire Place • 4 bedrooms
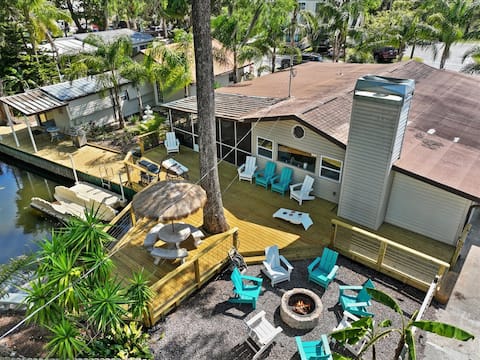
Weeki Wachee Canal Retreat | Kayaks | Sleeps 14
Entire Place • 5 bedrooms
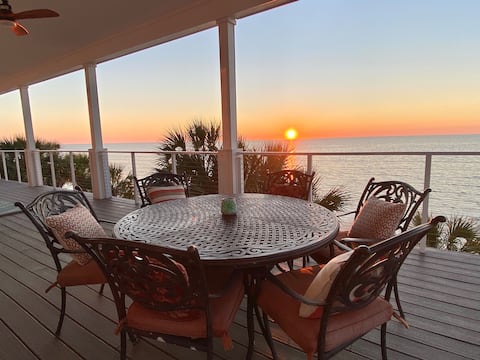
Island/Beachfront House - Majestic Sunsets
Entire Place • 3 bedrooms
Nanas River House in Weeki Wachee, WaterToys, Pets
Entire Place • 5 bedrooms
SEA COW RIVER HOUSE - KAYAKS AND CANOES INCLUDED!
Entire Place • 4 bedrooms

Manatee Cove Apartment Star5Vacations.
Entire Place • 2 bedrooms
Note: Performance varies based on location, size, amenities, seasonality, and management quality. Data reflects the past 12 months.
Top Performing Airbnb Hosts in Weeki Wachee (2026)
Learn from the best! This table showcases top-performing Airbnb hosts in Weeki Wachee based on the number of properties managed and estimated total revenue over the past year. Analyze their scale and performance metrics.
| Host Name | Properties | Grossing Revenue | Stay Reviews | Avg Rating |
|---|---|---|---|---|
| Jeff | 1 | $168,681 | 359 | 4.99/5.0 |
| Kevin | 3 | $130,220 | 170 | 4.86/5.0 |
| Brian | 1 | $127,078 | 51 | 4.90/5.0 |
| Sonia | 1 | $118,643 | 29 | 4.97/5.0 |
| Kimberly | 1 | $98,138 | 140 | 4.86/5.0 |
| Gregory James | 1 | $87,762 | 175 | 4.99/5.0 |
| Andi | 3 | $87,395 | 809 | 4.73/5.0 |
| Star5Vacations | 1 | $70,215 | 92 | 4.85/5.0 |
| Melanie | 1 | $66,545 | 174 | 4.97/5.0 |
| Leah | 1 | $63,402 | 20 | 5.00/5.0 |
Analyzing the strategies of top hosts, such as their property selection, pricing, and guest communication, can offer valuable lessons for optimizing your own Airbnb operations in Weeki Wachee.
Dive Deeper: Advanced Weeki Wachee STR Market Data (2026)
Ready to unlock more insights? AirROI provides access to advanced metrics and comprehensive Airbnb data for Weeki Wachee. Explore detailed analytics beyond this report to refine your investment strategy, optimize pricing, and maximize your vacation rental profits.
Explore Advanced MetricsWeeki Wachee Short-Term Rental Market Composition (2026): Property & Room Types
Room Type Distribution
Property Type Distribution
Market Composition Insights for Weeki Wachee
- The Weeki Wachee Airbnb market composition is heavily skewed towards Entire Home/Apt listings, which make up 98.1% of the 52 active rentals. This indicates strong guest preference for privacy and space.
- Looking at the property type distribution in Weeki Wachee, House properties are the most common (90.4%), reflecting the local real estate landscape.
- Houses represent a significant 90.4% portion, catering likely to families or larger groups.
- Smaller segments like others, apartment/condo, outdoor/unique (combined 9.5%) offer potential for unique stay experiences.
Weeki Wachee Airbnb Room Capacity Analysis (2026): Bedroom Distribution
Distribution of Listings by Number of Bedrooms
Room Capacity Insights for Weeki Wachee
- The dominant room capacity in Weeki Wachee is 2 bedrooms listings, making up 40.4% of the market. This suggests a strong demand for properties suitable for couples or solo travelers.
- Together, 2 bedrooms and 3 bedrooms properties represent 67.3% of the active Airbnb listings in Weeki Wachee, indicating a high concentration in these sizes.
- A significant 42.2% of listings offer 3+ bedrooms, catering to larger groups and families seeking more space in Weeki Wachee.
Weeki Wachee Vacation Rental Guest Capacity Trends (2026)
Distribution of Listings by Guest Capacity
Guest Capacity Insights for Weeki Wachee
- The most common guest capacity trend in Weeki Wachee vacation rentals is listings accommodating 8+ guests (30.8%). This suggests the primary traveler segment is likely larger groups.
- Properties designed for 8+ guests and 4 guests dominate the Weeki Wachee STR market, accounting for 59.6% of listings.
- 57.7% of properties accommodate 6+ guests, serving the market segment for larger families or group travel in Weeki Wachee.
- On average, properties in Weeki Wachee are equipped to host 5.7 guests.
Weeki Wachee Airbnb Booking Patterns (2026): Available vs. Booked Days
Available Days Distribution
Booked Days Distribution
Booking Pattern Insights for Weeki Wachee
- The most common availability pattern in Weeki Wachee falls within the 181-270 days range, representing 42.3% of listings. This suggests many properties have significant open periods on their calendars.
- Approximately 67.3% of listings show high availability (181+ days open annually), indicating potential for increased bookings or specific owner usage patterns.
- For booked days, the 91-180 days range is most frequent in Weeki Wachee (42.3%), reflecting common guest stay durations or potential owner blocking patterns.
- A notable 32.7% of properties secure long booking periods (181+ days booked per year), highlighting successful long-term rental strategies or significant owner usage.
Weeki Wachee Airbnb Minimum Stay Requirements Analysis
Distribution of Listings by Minimum Night Requirement
1 Night
4 listings
7.7% of total
2 Nights
19 listings
36.5% of total
3 Nights
5 listings
9.6% of total
4-6 Nights
2 listings
3.8% of total
7-29 Nights
2 listings
3.8% of total
30+ Nights
20 listings
38.5% of total
Key Insights
- The most prevalent minimum stay requirement in Weeki Wachee is 30+ Nights, adopted by 38.5% of listings. This highlights the market's preference for longer commitments.
- A significant segment (38.5%) caters to monthly stays (30+ nights) in Weeki Wachee, pointing to opportunities in the extended-stay market.
Recommendations
- Align with the market by considering a 30+ Nights minimum stay, as 38.5% of Weeki Wachee hosts use this setting.
- If feasible, allowing 1-night stays, especially midweek or during low season, could capture last-minute bookings, as only 7.7% currently do.
- A 2-night minimum appears standard (36.5%). Consider this for weekends or peak periods.
- Explore offering discounts for stays of 30+ nights to attract the 38.5% of the market seeking extended stays.
- Adjust minimum nights based on seasonality – potentially shorter during low season and longer during peak demand periods in Weeki Wachee.
Weeki Wachee Airbnb Cancellation Policy Trends Analysis (2026)
Flexible
8 listings
15.4% of total
Moderate
11 listings
21.2% of total
Firm
27 listings
51.9% of total
Strict
6 listings
11.5% of total
Cancellation Policy Insights for Weeki Wachee
- The prevailing Airbnb cancellation policy trend in Weeki Wachee is Firm, used by 51.9% of listings.
- A majority (63.4%) of hosts in Weeki Wachee utilize Firm or Strict policies, indicating a market where hosts prioritize booking security.
Recommendations for Hosts
- Consider adopting a Firm policy to align with the 51.9% market standard in Weeki Wachee.
- Using a Strict policy might deter some guests, as only 11.5% of listings use it. Evaluate if potential revenue protection outweighs possible lower booking rates.
- Regularly review your cancellation policy against competitors and market demand shifts in Weeki Wachee.
Weeki Wachee STR Booking Lead Time Analysis (2026)
Average Booking Lead Time by Month
Booking Lead Time Insights for Weeki Wachee
- The overall average booking lead time for vacation rentals in Weeki Wachee is 79 days.
- Guests book furthest in advance for stays during February (average 102 days), likely coinciding with peak travel demand or local events.
- The shortest booking windows occur for stays in October (average 51 days), indicating more last-minute travel plans during this time.
- Seasonally, Winter (86 days avg.) sees the longest lead times, while Fall (60 days avg.) has the shortest, reflecting typical travel planning cycles.
Recommendations for Hosts
- Use the overall average lead time (79 days) as a baseline for your pricing and availability strategy in Weeki Wachee.
- For February stays, consider implementing length-of-stay discounts or slightly higher rates for bookings made less than 102 days out to capitalize on advance planning.
- Target marketing efforts for the Winter season well in advance (at least 86 days) to capture early planners.
- Monitor your own booking lead times against these Weeki Wachee averages to identify opportunities for dynamic pricing adjustments.
Popular & Essential Airbnb Amenities in Weeki Wachee (2026)
Amenity Prevalence
Amenity Insights for Weeki Wachee
- Essential amenities in Weeki Wachee that guests expect include: TV, Air conditioning, Hot water, Smoke alarm, Wifi, Free parking on premises, Heating, Dishes and silverware, Cooking basics, Fire extinguisher. Lacking these (any) could significantly impact bookings.
Recommendations for Hosts
- Ensure your listing includes all essential amenities for Weeki Wachee: TV, Air conditioning, Hot water, Smoke alarm, Wifi, Free parking on premises, Heating, Dishes and silverware, Cooking basics, Fire extinguisher.
- Prioritize adding missing essentials: Heating, Dishes and silverware, Cooking basics, Fire extinguisher.
- Highlight unique or less common amenities you offer (e.g., hot tub, dedicated workspace, EV charger) in your listing description and photos.
- Regularly check competitor amenities in Weeki Wachee to stay competitive.
Weeki Wachee Airbnb Guest Demographics & Profile Analysis (2026)
Guest Profile Summary for Weeki Wachee
- The typical guest profile for Airbnb in Weeki Wachee consists of primarily domestic travelers (97%), often arriving from nearby Tampa, typically belonging to the Post-2000s (Gen Z/Alpha) group (50%), primarily speaking English or Spanish.
- Domestic travelers account for 96.7% of guests.
- Key international markets include United States (96.7%) and Canada (1.1%).
- Top languages spoken are English (73.4%) followed by Spanish (11%).
- A significant demographic segment is the Post-2000s (Gen Z/Alpha) group, representing 50% of guests.
Recommendations for Hosts
- Target domestic marketing efforts towards travelers from Tampa and Florida.
- Tailor amenities and listing descriptions to appeal to the dominant Post-2000s (Gen Z/Alpha) demographic (e.g., highlight fast WiFi, smart home features, local guides).
- Highlight unique local experiences or amenities relevant to the primary guest profile.
- Consider seasonal promotions aligned with peak travel times for key origin markets.
Nearby Short-Term Rental Market Comparison
How does the Weeki Wachee Airbnb market stack up against its neighbors? Compare key performance metrics like average monthly revenue, ADR, and occupancy rates in surrounding areas to understand the broader regional STR landscape.
| Market | Active Properties | Monthly Revenue | Daily Rate | Avg. Occupancy |
|---|---|---|---|---|
| Anna Maria island | 587 | $7,996 | $823.96 | 41% |
| Anna Maria | 56 | $6,434 | $692.96 | 52% |
| Reunion | 12 | $6,321 | $580.45 | 44% |
| Vilano Beach | 173 | $5,571 | $442.95 | 45% |
| Indian Rocks Beach | 842 | $5,560 | $419.63 | 49% |
| Siesta Key | 1,175 | $5,206 | $518.91 | 42% |
| Belleair Beach | 94 | $5,086 | $339.65 | 53% |
| Bradenton Beach | 122 | $4,977 | $507.12 | 42% |
| Thonotosassa | 17 | $4,309 | $347.75 | 50% |
| Seminole | 519 | $4,223 | $316.69 | 52% |