Watersound Airbnb Market Analysis 2026: Short Term Rental Data & Vacation Rental Statistics in Florida, United States
Is Airbnb profitable in Watersound in 2026? Explore comprehensive Airbnb analytics for Watersound, Florida, United States to uncover income potential. This 2026 STR market report for Watersound, based on AirROI data from February 2025 to January 2026, reveals key trends in the niche market of 126 active listings.
Whether you're considering an Airbnb investment in Watersound, optimizing your existing vacation rental, or exploring rental arbitrage opportunities, understanding the Watersound Airbnb data is crucial. Leveraging the low regulation environment is key to maximizing your short term rental income potential. Let's dive into the specifics.
Key Watersound Airbnb Performance Metrics Overview
Monthly Airbnb Revenue Variations & Income Potential in Watersound (2026)
Understanding the monthly revenue variations for Airbnb listings in Watersound is key to maximizing your short term rental income potential. Seasonality significantly impacts earnings. Our analysis, based on data from the past 12 months, shows that the peak revenue month for STRs in Watersound is typically July, while January often presents the lowest earnings, highlighting opportunities for strategic pricing adjustments during shoulder and low seasons. Explore the typical Airbnb income in Watersound across different performance tiers:
- Best-in-class properties (Top 10%) achieve $10,399+ monthly, often utilizing dynamic pricing and superior guest experiences.
- Strong performing properties (Top 25%) earn $7,880 or more, indicating effective management and desirable locations/amenities.
- Typical properties (Median) generate around $5,452 per month, representing the average market performance.
- Entry-level properties (Bottom 25%) see earnings around $3,260, often with potential for optimization.
Average Monthly Airbnb Earnings Trend in Watersound
Watersound Airbnb Occupancy Rate Trends (2026)
Maximize your bookings by understanding the Watersound STR occupancy trends. Seasonal demand shifts significantly influence how often properties are booked. Typically, Julysees the highest demand (peak season occupancy), while January experiences the lowest (low season). Effective strategies, like adjusting minimum stays or offering promotions, can boost occupancy during slower periods. Here's how different property tiers perform in Watersound:
- Best-in-class properties (Top 10%) achieve 68%+ occupancy, indicating high desirability and potentially optimized availability.
- Strong performing properties (Top 25%) maintain 54% or higher occupancy, suggesting good market fit and guest satisfaction.
- Typical properties (Median) have an occupancy rate around 36%.
- Entry-level properties (Bottom 25%) average 22% occupancy, potentially facing higher vacancy.
Average Monthly Occupancy Rate Trend in Watersound
Average Daily Rate (ADR) Airbnb Trends in Watersound (2026)
Effective short term rental pricing strategy in Watersound involves understanding monthly ADR fluctuations. The Average Daily Rate (ADR) for Airbnb in Watersound typically peaks in June and dips lowest during February. Leveraging Airbnb dynamic pricing tools or strategies based on this seasonality can significantly boost revenue. Here's a look at the typical nightly rates achieved:
- Best-in-class properties (Top 10%) command rates of $672+ per night, often due to premium features or locations.
- Strong performing properties (Top 25%) achieve nightly rates of $530 or more.
- Typical properties (Median) charge around $461 per night.
- Entry-level properties (Bottom 25%) earn around $396 per night.
Average Daily Rate (ADR) Trend by Month in Watersound
Get Live Watersound Market Intelligence 👇

Explore Real-time Analytics
Airbnb Seasonality Analysis & Trends in Watersound (2026)
Peak Season (July, June, March)
- Revenue averages $10,138 per month
- Occupancy rates average 58.2%
- Daily rates average $553
Shoulder Season
- Revenue averages $5,453 per month
- Occupancy maintains around 37.7%
- Daily rates hold near $484
Low Season (January, February, December)
- Revenue drops to average $2,774 per month
- Occupancy decreases to average 22.6%
- Daily rates adjust to average $454
Seasonality Insights for Watersound
- The Airbnb seasonality in Watersound shows highly seasonal trends requiring careful strategy. While the sections above show seasonal averages, it's also insightful to look at the extremes:
- During the high season, the absolute peak month showcases Watersound's highest earning potential, with monthly revenues capable of climbing to $12,173, occupancy reaching a high of 66.5%, and ADRs peaking at $592.
- Conversely, the slowest single month of the year, typically falling within the low season, marks the market's lowest point. In this month, revenue might dip to $2,431, occupancy could drop to 18.5%, and ADRs may adjust down to $392.
- Understanding both the seasonal averages and these monthly peaks and troughs in revenue, occupancy, and ADR is crucial for maximizing your Airbnb profit potential in Watersound.
Seasonal Strategies for Maximizing Profit
- Peak Season: Maximize revenue through premium pricing and potentially longer minimum stays. Ensure high availability.
- Low Season: Offer competitive pricing, special promotions (e.g., extended stay discounts), and flexible cancellation policies. Target off-season travelers like remote workers or budget-conscious guests.
- Shoulder Seasons: Implement dynamic pricing that balances peak and low rates. Target weekend travelers or specific events. Offer slightly more flexible terms than peak season.
- Regularly analyze your own performance against these Watersound seasonality benchmarks and adjust your pricing and availability strategy accordingly.
Best Areas for Airbnb Investment in Watersound (2026)
Exploring the top neighborhoods for short-term rentals in Watersound? This section highlights key areas, outlining why they are attractive for hosts and guests, along with notable local attractions. Consider these locations based on your target guest profile and investment strategy.
| Neighborhood / Area | Why Host Here? (Target Guests & Appeal) | Key Attractions & Landmarks |
|---|---|---|
| Watersound Beach | A tranquil and luxurious beachfront community known for its beautiful white sand beaches and family-friendly atmosphere. Ideal for travelers looking for a peaceful getaway with direct access to the Gulf of Mexico. | Watersound Beach Club, Coastal Dune Lakes, Camp Creek Golf Club, The Hub at Watersound, Scenic Highway 30A |
| Seagrove Beach | A charming beach town Just a short drive from Watersound, Seagrove offers a laid-back vibe with scenic bike paths and local shops. Popular with families and nature lovers. | Seagrove Beach, Eastern Lake, The Seagrove Village MarketCafe, Timpoochee Trail, Gulf Place |
| Rosemary Beach | Known for its stunning architecture and cobblestone streets, Rosemary Beach is a picturesque town that attracts tourists looking for a vibrant community with a variety of dining and shopping options. | Rosemary Beach Town Square, Coastal Dune Lakes, Pez Coffee, The Rosemary Beach Inn, Barbacoa Mexican Grill |
| Inlet Beach | With its proximity to state parks and gorgeous beaches, Inlet Beach is perfect for outdoor enthusiasts and families looking for a more relaxed atmosphere. | Inlet Beach, Camp Helen State Park, 30Avenue, The Inlet Beach Access, Topsail Hill Preserve State Park |
| Panama City Beach | Just a short drive from Watersound, this bustling beach town offers a wide range of attractions and activities, making it ideal for those seeking a lively vacation experience. | Pier Park, Gulf World Marine Park, Panama City Beach, St. Andrews State Park, Shipwreck Island Waterpark |
| Sowing the Seeds of Change | An up-and-coming destination near Watersound, known for its eco-friendly focus and community events. Attracts guests interested in sustainable living and nature-oriented experiences. | Eco-Friendly Workshops, The Market at Watersound, Farmer's Market, Community Festivals, Nature Trails |
| Grayton Beach | A laid-back beach community that retains its rustic charm and is known for its artists' colony and unique local shops. It appeals to those looking for an authentic beach experience. | Grayton Beach State Park, Grayton Beach Art Walk, Local Art Galleries, Red Bar, Grayton Beach Brewery |
| Blue Mountain Beach | Combining beautiful beaches with artistic community vibes, Blue Mountain Beach attracts guests interested in art, music, and a variety of outdoor activities. | Blue Mountain Beach, Topsail Hill Preserve State Park, Local Artisans Market, 30A Beach Access, Bike Trails |
Understanding Airbnb License Requirements & STR Laws in Watersound (2026)
While Watersound, Florida, United States currently shows low STR regulations, specific Airbnb license requirements might still exist or change. Always verify the latest short term rental regulations and Airbnb license requirements directly with local government authorities for Watersound to ensure full compliance before hosting.
(Source: AirROI data, 2026, finding no licensed listings among those analyzed)
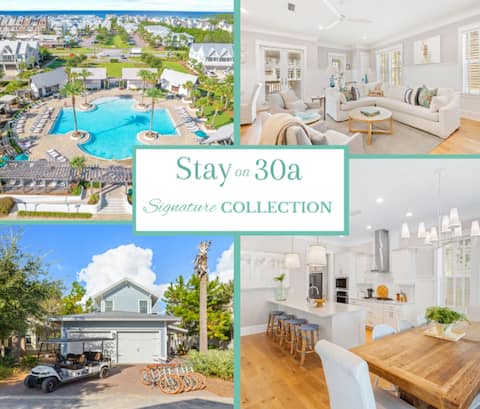
Top Performing Airbnb Properties in Watersound (2026)
Benchmark your potential! Explore examples of top-performing Airbnb properties in Watersoundbased on Trailing Twelve Month (TTM) revenue. Analyze their characteristics, revenue, occupancy rate, and ADR to understand what drives success in this market.

Salt&Sand 30A – Family Retreat w/ Pool & Golf Cart
Entire Place • 3 bedrooms
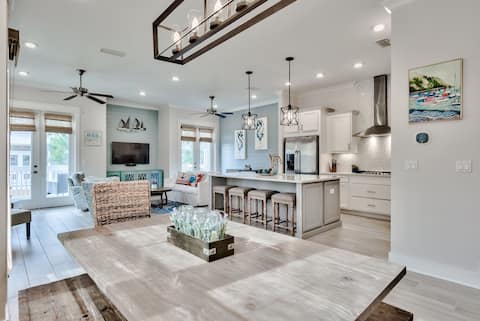
Hola Beaches by Stay on 30a
Entire Place • 5 bedrooms
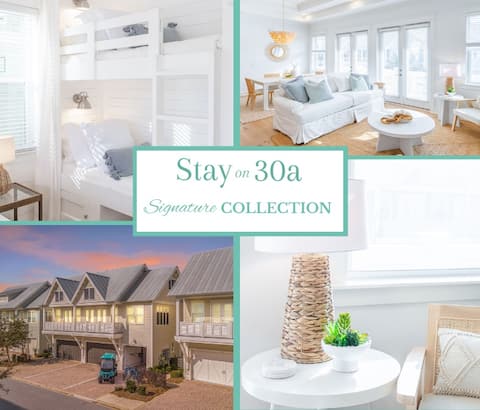
6 Seater Cart | Great Location | Pool | near beach
Entire Place • 3 bedrooms
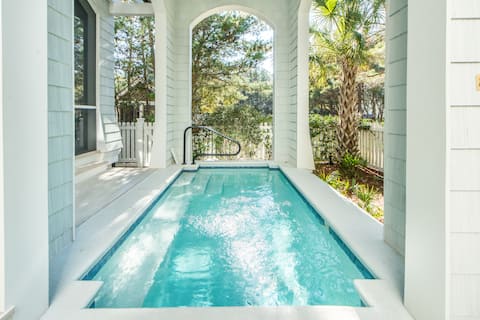
Playa De Bonita by Stay on 30a
Entire Place • 2 bedrooms

Yachtpond Lane- Private Pool! Bikes! Golf Cart!
Entire Place • 6 bedrooms
Plunge Pool|Golfcart|Bikes|30A The Nautilus
Entire Place • 5 bedrooms
Note: Performance varies based on location, size, amenities, seasonality, and management quality. Data reflects the past 12 months.
Top Performing Airbnb Hosts in Watersound (2026)
Learn from the best! This table showcases top-performing Airbnb hosts in Watersound based on the number of properties managed and estimated total revenue over the past year. Analyze their scale and performance metrics.
| Host Name | Properties | Grossing Revenue | Stay Reviews | Avg Rating |
|---|---|---|---|---|
| Stay On 30a | 32 | $2,116,143 | 612 | 4.97/5.0 |
| Kalos Dwellings | 17 | $1,114,910 | 537 | 4.92/5.0 |
| Panhandle Getaways | 23 | $661,636 | 133 | 4.52/5.0 |
| 360 Blue | 2 | $192,096 | 2 | Not Rated |
| Sheena | 2 | $179,012 | 329 | 5.00/5.0 |
| Jason | 3 | $169,408 | 196 | 4.97/5.0 |
| Ej | 1 | $130,587 | 106 | 4.93/5.0 |
| Frank | 1 | $129,551 | 153 | 4.98/5.0 |
| RealJoy | 1 | $113,185 | 26 | 4.77/5.0 |
| Tom & Christine | 1 | $112,258 | 10 | 5.00/5.0 |
Analyzing the strategies of top hosts, such as their property selection, pricing, and guest communication, can offer valuable lessons for optimizing your own Airbnb operations in Watersound.
Dive Deeper: Advanced Watersound STR Market Data (2026)
Ready to unlock more insights? AirROI provides access to advanced metrics and comprehensive Airbnb data for Watersound. Explore detailed analytics beyond this report to refine your investment strategy, optimize pricing, and maximize your vacation rental profits.
Explore Advanced MetricsWatersound Short-Term Rental Market Composition (2026): Property & Room Types
Room Type Distribution
Property Type Distribution
Market Composition Insights for Watersound
- The Watersound Airbnb market composition is heavily skewed towards Entire Home/Apt listings, which make up 100% of the 126 active rentals. This indicates strong guest preference for privacy and space.
- Looking at the property type distribution in Watersound, House properties are the most common (95.2%), reflecting the local real estate landscape.
- Houses represent a significant 95.2% portion, catering likely to families or larger groups.
- Smaller segments like apartment/condo (combined 4.8%) offer potential for unique stay experiences.
Watersound Airbnb Room Capacity Analysis (2026): Bedroom Distribution
Distribution of Listings by Number of Bedrooms
Room Capacity Insights for Watersound
- The dominant room capacity in Watersound is 3 bedrooms listings, making up 54% of the market. This suggests a strong demand for properties suitable for families or small groups.
- Together, 3 bedrooms and 2 bedrooms properties represent 85.0% of the active Airbnb listings in Watersound, indicating a high concentration in these sizes.
- A significant 69.0% of listings offer 3+ bedrooms, catering to larger groups and families seeking more space in Watersound.
Watersound Vacation Rental Guest Capacity Trends (2026)
Distribution of Listings by Guest Capacity
Guest Capacity Insights for Watersound
- The most common guest capacity trend in Watersound vacation rentals is listings accommodating 8+ guests (61.9%). This suggests the primary traveler segment is likely larger groups.
- Properties designed for 8+ guests and 6 guests dominate the Watersound STR market, accounting for 88.1% of listings.
- 96.0% of properties accommodate 6+ guests, serving the market segment for larger families or group travel in Watersound.
- On average, properties in Watersound are equipped to host 7.2 guests.
Watersound Airbnb Booking Patterns (2026): Available vs. Booked Days
Available Days Distribution
Booked Days Distribution
Booking Pattern Insights for Watersound
- The most common availability pattern in Watersound falls within the 271-366 days range, representing 43.7% of listings. This suggests many properties have significant open periods on their calendars.
- Approximately 85.0% of listings show high availability (181+ days open annually), indicating potential for increased bookings or specific owner usage patterns.
- For booked days, the 91-180 days range is most frequent in Watersound (43.7%), reflecting common guest stay durations or potential owner blocking patterns.
- A notable 15.1% of properties secure long booking periods (181+ days booked per year), highlighting successful long-term rental strategies or significant owner usage.
Watersound Airbnb Minimum Stay Requirements Analysis
Distribution of Listings by Minimum Night Requirement
2 Nights
7 listings
5.6% of total
3 Nights
19 listings
15.1% of total
4-6 Nights
7 listings
5.6% of total
30+ Nights
93 listings
73.8% of total
Key Insights
- The most prevalent minimum stay requirement in Watersound is 30+ Nights, adopted by 73.8% of listings. This highlights the market's preference for longer commitments.
- Very short stays (1-2 nights) are less common (5.6%), suggesting hosts prefer slightly longer bookings to optimize turnover.
- A significant segment (73.8%) caters to monthly stays (30+ nights) in Watersound, pointing to opportunities in the extended-stay market.
Recommendations
- Align with the market by considering a 30+ Nights minimum stay, as 73.8% of Watersound hosts use this setting.
- Explore offering discounts for stays of 30+ nights to attract the 73.8% of the market seeking extended stays.
- Adjust minimum nights based on seasonality – potentially shorter during low season and longer during peak demand periods in Watersound.
Watersound Airbnb Cancellation Policy Trends Analysis (2026)
Limited
4 listings
3.2% of total
Super Strict 30 Days
6 listings
4.8% of total
Super Strict 60 Days
6 listings
4.8% of total
Flexible
1 listings
0.8% of total
Moderate
1 listings
0.8% of total
Firm
90 listings
71.4% of total
Strict
18 listings
14.3% of total
Cancellation Policy Insights for Watersound
- The prevailing Airbnb cancellation policy trend in Watersound is Firm, used by 71.4% of listings.
- A majority (85.7%) of hosts in Watersound utilize Firm or Strict policies, indicating a market where hosts prioritize booking security.
Recommendations for Hosts
- Consider adopting a Firm policy to align with the 71.4% market standard in Watersound.
- Using a Strict policy might deter some guests, as only 14.3% of listings use it. Evaluate if potential revenue protection outweighs possible lower booking rates.
- Regularly review your cancellation policy against competitors and market demand shifts in Watersound.
Watersound STR Booking Lead Time Analysis (2026)
Average Booking Lead Time by Month
Booking Lead Time Insights for Watersound
- The overall average booking lead time for vacation rentals in Watersound is 53 days.
- Guests book furthest in advance for stays during November (average 75 days), likely coinciding with peak travel demand or local events.
- The shortest booking windows occur for stays in January (average 41 days), indicating more last-minute travel plans during this time.
- Seasonally, Spring (62 days avg.) sees the longest lead times, while Winter (48 days avg.) has the shortest, reflecting typical travel planning cycles.
Recommendations for Hosts
- Use the overall average lead time (53 days) as a baseline for your pricing and availability strategy in Watersound.
- For November stays, consider implementing length-of-stay discounts or slightly higher rates for bookings made less than 75 days out to capitalize on advance planning.
- Target marketing efforts for the Spring season well in advance (at least 62 days) to capture early planners.
- Monitor your own booking lead times against these Watersound averages to identify opportunities for dynamic pricing adjustments.
Popular & Essential Airbnb Amenities in Watersound (2026)
Amenity Prevalence
Amenity Insights for Watersound
- Essential amenities in Watersound that guests expect include: Wifi, Air conditioning, Washer, TV, Heating, Smoke alarm, Kitchen, Dishwasher, Pool. Lacking these (any) could significantly impact bookings.
- Popular amenities like Hot water are common but not universal. Offering these can provide a competitive edge.
Recommendations for Hosts
- Ensure your listing includes all essential amenities for Watersound: Wifi, Air conditioning, Washer, TV, Heating, Smoke alarm, Kitchen, Dishwasher, Pool.
- Prioritize adding missing essentials: Air conditioning, Washer, TV, Heating, Smoke alarm, Kitchen, Dishwasher, Pool.
- Consider adding popular differentiators like Hot water to increase appeal.
- Highlight unique or less common amenities you offer (e.g., hot tub, dedicated workspace, EV charger) in your listing description and photos.
- Regularly check competitor amenities in Watersound to stay competitive.
Watersound Airbnb Guest Demographics & Profile Analysis (2026)
Guest Profile Summary for Watersound
- The typical guest profile for Airbnb in Watersound consists of primarily domestic travelers (99%), often arriving from nearby Atlanta, typically belonging to the Post-2000s (Gen Z/Alpha) group (50%), primarily speaking English or Spanish.
- Domestic travelers account for 99.4% of guests.
- Key international markets include United States (99.4%) and DC (0.3%).
- Top languages spoken are English (78.3%) followed by Spanish (10.1%).
- A significant demographic segment is the Post-2000s (Gen Z/Alpha) group, representing 50% of guests.
Recommendations for Hosts
- Target domestic marketing efforts towards travelers from Atlanta and Nashville.
- Tailor amenities and listing descriptions to appeal to the dominant Post-2000s (Gen Z/Alpha) demographic (e.g., highlight fast WiFi, smart home features, local guides).
- Highlight unique local experiences or amenities relevant to the primary guest profile.
- Consider seasonal promotions aligned with peak travel times for key origin markets.
Nearby Short-Term Rental Market Comparison
How does the Watersound Airbnb market stack up against its neighbors? Compare key performance metrics like average monthly revenue, ADR, and occupancy rates in surrounding areas to understand the broader regional STR landscape.
| Market | Active Properties | Monthly Revenue | Daily Rate | Avg. Occupancy |
|---|---|---|---|---|
| Alys Beach | 441 | $6,989 | $682.56 | 43% |
| Seaside | 669 | $6,696 | $783.03 | 38% |
| Seacrest Beach | 350 | $6,613 | $593.69 | 44% |
| Rosemary Beach | 533 | $6,251 | $659.86 | 42% |
| Santa Rosa Beach | 3,191 | $5,047 | $539.15 | 41% |
| Seacrest | 28 | $4,993 | $635.35 | 39% |
| Inlet Beach | 98 | $4,870 | $534.43 | 41% |
| Walton County | 134 | $4,764 | $592.07 | 38% |
| Perdido Beach | 10 | $4,353 | $297.45 | 51% |
| Destin | 3,836 | $4,090 | $433.35 | 40% |