Venice Gardens Airbnb Market Analysis 2026: Short Term Rental Data & Vacation Rental Statistics in Florida, United States
Is Airbnb profitable in Venice Gardens in 2026? Explore comprehensive Airbnb analytics for Venice Gardens, Florida, United States to uncover income potential. This 2026 STR market report for Venice Gardens, based on AirROI data from February 2025 to January 2026, reveals key trends in the niche market of 79 active listings.
Whether you're considering an Airbnb investment in Venice Gardens, optimizing your existing vacation rental, or exploring rental arbitrage opportunities, understanding the Venice Gardens Airbnb data is crucial. Leveraging the low regulation environment is key to maximizing your short term rental income potential. Let's dive into the specifics.
Key Venice Gardens Airbnb Performance Metrics Overview
Monthly Airbnb Revenue Variations & Income Potential in Venice Gardens (2026)
Understanding the monthly revenue variations for Airbnb listings in Venice Gardens is key to maximizing your short term rental income potential. Seasonality significantly impacts earnings. Our analysis, based on data from the past 12 months, shows that the peak revenue month for STRs in Venice Gardens is typically March, while September often presents the lowest earnings, highlighting opportunities for strategic pricing adjustments during shoulder and low seasons. Explore the typical Airbnb income in Venice Gardens across different performance tiers:
- Best-in-class properties (Top 10%) achieve $6,115+ monthly, often utilizing dynamic pricing and superior guest experiences.
- Strong performing properties (Top 25%) earn $4,306 or more, indicating effective management and desirable locations/amenities.
- Typical properties (Median) generate around $2,879 per month, representing the average market performance.
- Entry-level properties (Bottom 25%) see earnings around $1,675, often with potential for optimization.
Average Monthly Airbnb Earnings Trend in Venice Gardens
Venice Gardens Airbnb Occupancy Rate Trends (2026)
Maximize your bookings by understanding the Venice Gardens STR occupancy trends. Seasonal demand shifts significantly influence how often properties are booked. Typically, Marchsees the highest demand (peak season occupancy), while September experiences the lowest (low season). Effective strategies, like adjusting minimum stays or offering promotions, can boost occupancy during slower periods. Here's how different property tiers perform in Venice Gardens:
- Best-in-class properties (Top 10%) achieve 83%+ occupancy, indicating high desirability and potentially optimized availability.
- Strong performing properties (Top 25%) maintain 70% or higher occupancy, suggesting good market fit and guest satisfaction.
- Typical properties (Median) have an occupancy rate around 52%.
- Entry-level properties (Bottom 25%) average 33% occupancy, potentially facing higher vacancy.
Average Monthly Occupancy Rate Trend in Venice Gardens
Average Daily Rate (ADR) Airbnb Trends in Venice Gardens (2026)
Effective short term rental pricing strategy in Venice Gardens involves understanding monthly ADR fluctuations. The Average Daily Rate (ADR) for Airbnb in Venice Gardens typically peaks in January and dips lowest during May. Leveraging Airbnb dynamic pricing tools or strategies based on this seasonality can significantly boost revenue. Here's a look at the typical nightly rates achieved:
- Best-in-class properties (Top 10%) command rates of $303+ per night, often due to premium features or locations.
- Strong performing properties (Top 25%) achieve nightly rates of $230 or more.
- Typical properties (Median) charge around $178 per night.
- Entry-level properties (Bottom 25%) earn around $141 per night.
Average Daily Rate (ADR) Trend by Month in Venice Gardens
Get Live Venice Gardens Market Intelligence 👇

Explore Real-time Analytics
Airbnb Seasonality Analysis & Trends in Venice Gardens (2026)
Peak Season (March, February, April)
- Revenue averages $4,698 per month
- Occupancy rates average 74.8%
- Daily rates average $194
Shoulder Season
- Revenue averages $2,974 per month
- Occupancy maintains around 46.3%
- Daily rates hold near $196
Low Season (August, September, October)
- Revenue drops to average $2,269 per month
- Occupancy decreases to average 37.4%
- Daily rates adjust to average $189
Seasonality Insights for Venice Gardens
- The Airbnb seasonality in Venice Gardens shows highly seasonal trends requiring careful strategy. While the sections above show seasonal averages, it's also insightful to look at the extremes:
- During the high season, the absolute peak month showcases Venice Gardens's highest earning potential, with monthly revenues capable of climbing to $5,580, occupancy reaching a high of 83.1%, and ADRs peaking at $222.
- Conversely, the slowest single month of the year, typically falling within the low season, marks the market's lowest point. In this month, revenue might dip to $1,840, occupancy could drop to 31.9%, and ADRs may adjust down to $176.
- Understanding both the seasonal averages and these monthly peaks and troughs in revenue, occupancy, and ADR is crucial for maximizing your Airbnb profit potential in Venice Gardens.
Seasonal Strategies for Maximizing Profit
- Peak Season: Maximize revenue through premium pricing and potentially longer minimum stays. Ensure high availability.
- Low Season: Offer competitive pricing, special promotions (e.g., extended stay discounts), and flexible cancellation policies. Target off-season travelers like remote workers or budget-conscious guests.
- Shoulder Seasons: Implement dynamic pricing that balances peak and low rates. Target weekend travelers or specific events. Offer slightly more flexible terms than peak season.
- Regularly analyze your own performance against these Venice Gardens seasonality benchmarks and adjust your pricing and availability strategy accordingly.
Best Areas for Airbnb Investment in Venice Gardens (2026)
Exploring the top neighborhoods for short-term rentals in Venice Gardens? This section highlights key areas, outlining why they are attractive for hosts and guests, along with notable local attractions. Consider these locations based on your target guest profile and investment strategy.
| Neighborhood / Area | Why Host Here? (Target Guests & Appeal) | Key Attractions & Landmarks |
|---|---|---|
| Venice Beach | A beautiful beachfront area known for its stunning sunsets and vibrant atmosphere. Visitors flock here for the beach, boardwalk, and local shops, making it a prime spot for short-term rentals. | Venice Beach Boardwalk, Muscle Beach, Venice Canals, Abbot Kinney Boulevard, Venice Fishing Pier |
| Nokomis | A charming coastal community with access to beautiful Gulf beaches. Its relaxed vibe and proximity to parks and nature reserves make it appealing to families and couples. | Nokomis Beach, Casey Key, Oscar Scherer State Park, Nokomis Groves, Venice North Jetty |
| Downtown Venice | The historic and quaint downtown area offers unique shops, restaurants, and cultural events. It's perfect for guests who enjoy a walkable community with charm and character. | Venice Theatre, Historic Downtown Venice, Venice Farmers Market, Caspersen Beach, Venice Art Center |
| South Venice | A residential area close to the water and nature preserves. Attracts guests looking for a peaceful retreat with easy access to the outdoors and nearby beaches. | South Venice Beach, Shamrock Park, Caspersen Beach, Venice Lighthouse, Lemon Bay |
| Laurel | A small, friendly community that provides a quiet place to stay while being close to both Venice and Nokomis. Great for those who prefer a more local, relaxed experience. | Laurel Park, Local boutiques, Nearby beaches, Nature trails, Community events |
| Manasota Key | A unique island community with pristine beaches and a laid-back beach atmosphere. Perfect for travelers seeking a romantic getaway or family vacation. | Manasota Beach, Englewood Beach, Stump Pass Beach State Park, Manasota Key Park, Dining on the water |
| North Port | An inland option with various attractions and amenities. It's a growing city with more affordable options for travelers, making it a great option for budget-conscious guests. | Myakkahatchee Creek Environmental Park, North Port Aqua..., Cranberry Fields, Historic North Port Winery, Local dining and shopping |
| Siesta Key | Though technically not part of Venice, it's nearby and famous for its stunning beaches. A prime destination for tourists seeking the best of Florida's coastline. | Siesta Key Beach, Siesta Village, Turtle Beach, Lido Key, South Lido Park |
Understanding Airbnb License Requirements & STR Laws in Venice Gardens (2026)
While Venice Gardens, Florida, United States currently shows low STR regulations, specific Airbnb license requirements might still exist or change. Always verify the latest short term rental regulations and Airbnb license requirements directly with local government authorities for Venice Gardens to ensure full compliance before hosting.
(Source: AirROI data, 2026, finding no licensed listings among those analyzed)
Top Performing Airbnb Properties in Venice Gardens (2026)
Benchmark your potential! Explore examples of top-performing Airbnb properties in Venice Gardensbased on Trailing Twelve Month (TTM) revenue. Analyze their characteristics, revenue, occupancy rate, and ADR to understand what drives success in this market.
SunCoast Garden Family Retreat
Entire Place • 4 bedrooms
Ashota - The Jellyfish
Entire Place • 3 bedrooms
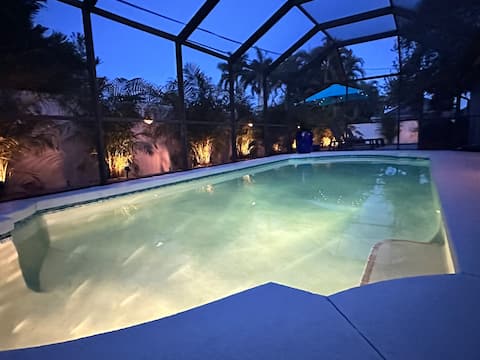
Poolside Private Garden Oasis Home by the Beach
Entire Place • 3 bedrooms
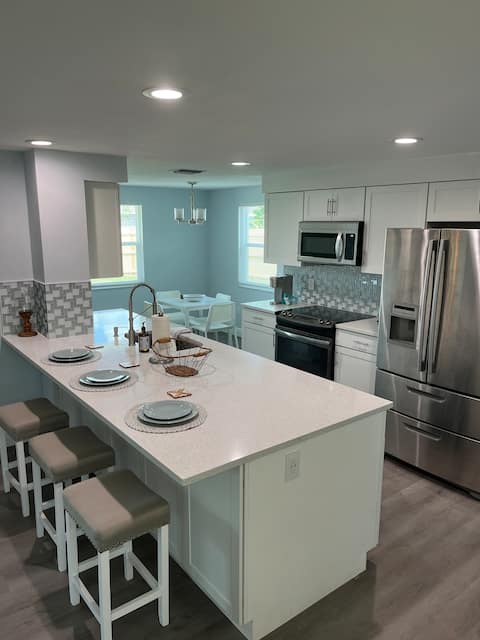
Venice Sunshine Pool Home
Entire Place • 4 bedrooms

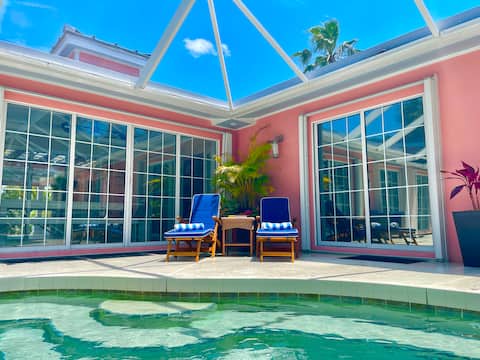
Florida Oasis w/ Private Pool
Entire Place • 3 bedrooms
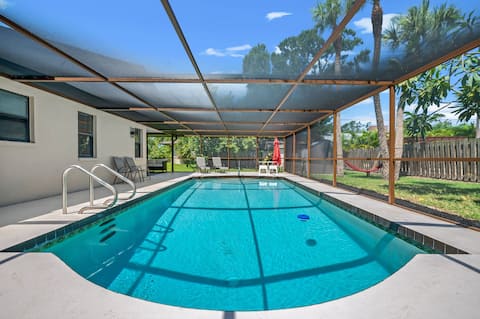
Lakefront Pool Home-Open, Bright and Spacious!
Entire Place • 3 bedrooms
Note: Performance varies based on location, size, amenities, seasonality, and management quality. Data reflects the past 12 months.
Top Performing Airbnb Hosts in Venice Gardens (2026)
Learn from the best! This table showcases top-performing Airbnb hosts in Venice Gardens based on the number of properties managed and estimated total revenue over the past year. Analyze their scale and performance metrics.
| Host Name | Properties | Grossing Revenue | Stay Reviews | Avg Rating |
|---|---|---|---|---|
| Ewelina | 2 | $123,873 | 134 | 4.95/5.0 |
| Jan | 4 | $101,064 | 588 | 4.84/5.0 |
| Greg | 1 | $86,751 | 23 | 5.00/5.0 |
| Ashota Stays | 1 | $79,216 | 79 | 4.91/5.0 |
| Lori | 1 | $77,473 | 71 | 5.00/5.0 |
| Aneta | 1 | $77,348 | 96 | 4.94/5.0 |
| Lyuda | 1 | $73,032 | 47 | 4.96/5.0 |
| Lori | 1 | $69,272 | 60 | 4.83/5.0 |
| John | 1 | $61,470 | 38 | 5.00/5.0 |
| Hillary | 1 | $58,245 | 67 | 4.96/5.0 |
Analyzing the strategies of top hosts, such as their property selection, pricing, and guest communication, can offer valuable lessons for optimizing your own Airbnb operations in Venice Gardens.
Dive Deeper: Advanced Venice Gardens STR Market Data (2026)
Ready to unlock more insights? AirROI provides access to advanced metrics and comprehensive Airbnb data for Venice Gardens. Explore detailed analytics beyond this report to refine your investment strategy, optimize pricing, and maximize your vacation rental profits.
Explore Advanced MetricsVenice Gardens Short-Term Rental Market Composition (2026): Property & Room Types
Room Type Distribution
Property Type Distribution
Market Composition Insights for Venice Gardens
- The Venice Gardens Airbnb market composition is heavily skewed towards Entire Home/Apt listings, which make up 96.2% of the 79 active rentals. This indicates strong guest preference for privacy and space.
- Looking at the property type distribution in Venice Gardens, House properties are the most common (88.6%), reflecting the local real estate landscape.
- Houses represent a significant 88.6% portion, catering likely to families or larger groups.
- Smaller segments like apartment/condo, hotel/boutique (combined 3.8%) offer potential for unique stay experiences.
Venice Gardens Airbnb Room Capacity Analysis (2026): Bedroom Distribution
Distribution of Listings by Number of Bedrooms
Room Capacity Insights for Venice Gardens
- The dominant room capacity in Venice Gardens is 3 bedrooms listings, making up 48.1% of the market. This suggests a strong demand for properties suitable for families or small groups.
- Together, 3 bedrooms and 2 bedrooms properties represent 87.3% of the active Airbnb listings in Venice Gardens, indicating a high concentration in these sizes.
- A significant 51.9% of listings offer 3+ bedrooms, catering to larger groups and families seeking more space in Venice Gardens.
Venice Gardens Vacation Rental Guest Capacity Trends (2026)
Distribution of Listings by Guest Capacity
Guest Capacity Insights for Venice Gardens
- The most common guest capacity trend in Venice Gardens vacation rentals is listings accommodating 6 guests (30.4%). This suggests the primary traveler segment is likely larger groups.
- Properties designed for 6 guests and 8+ guests dominate the Venice Gardens STR market, accounting for 57.0% of listings.
- 60.8% of properties accommodate 6+ guests, serving the market segment for larger families or group travel in Venice Gardens.
- On average, properties in Venice Gardens are equipped to host 5.8 guests.
Venice Gardens Airbnb Booking Patterns (2026): Available vs. Booked Days
Available Days Distribution
Booked Days Distribution
Booking Pattern Insights for Venice Gardens
- The most common availability pattern in Venice Gardens falls within the 181-270 days range, representing 35.4% of listings. This suggests many properties have significant open periods on their calendars.
- Approximately 65.8% of listings show high availability (181+ days open annually), indicating potential for increased bookings or specific owner usage patterns.
- For booked days, the 91-180 days range is most frequent in Venice Gardens (34.2%), reflecting common guest stay durations or potential owner blocking patterns.
- A notable 36.7% of properties secure long booking periods (181+ days booked per year), highlighting successful long-term rental strategies or significant owner usage.
Venice Gardens Airbnb Minimum Stay Requirements Analysis
Distribution of Listings by Minimum Night Requirement
1 Night
1 listings
1.3% of total
2 Nights
9 listings
11.4% of total
3 Nights
10 listings
12.7% of total
4-6 Nights
11 listings
13.9% of total
7-29 Nights
14 listings
17.7% of total
30+ Nights
34 listings
43% of total
Key Insights
- The most prevalent minimum stay requirement in Venice Gardens is 30+ Nights, adopted by 43% of listings. This highlights the market's preference for longer commitments.
- Very short stays (1-2 nights) are less common (12.7%), suggesting hosts prefer slightly longer bookings to optimize turnover.
- A significant segment (43%) caters to monthly stays (30+ nights) in Venice Gardens, pointing to opportunities in the extended-stay market.
Recommendations
- Align with the market by considering a 30+ Nights minimum stay, as 43% of Venice Gardens hosts use this setting.
- If feasible, allowing 1-night stays, especially midweek or during low season, could capture last-minute bookings, as only 1.3% currently do.
- Explore offering discounts for stays of 30+ nights to attract the 43% of the market seeking extended stays.
- Adjust minimum nights based on seasonality – potentially shorter during low season and longer during peak demand periods in Venice Gardens.
Venice Gardens Airbnb Cancellation Policy Trends Analysis (2026)
Limited
1 listings
1.3% of total
Super Strict 60 Days
1 listings
1.3% of total
Flexible
17 listings
21.5% of total
Moderate
12 listings
15.2% of total
Firm
42 listings
53.2% of total
Strict
6 listings
7.6% of total
Cancellation Policy Insights for Venice Gardens
- The prevailing Airbnb cancellation policy trend in Venice Gardens is Firm, used by 53.2% of listings.
- A majority (60.8%) of hosts in Venice Gardens utilize Firm or Strict policies, indicating a market where hosts prioritize booking security.
- Strict cancellation policies are quite rare (7.6%), potentially making listings with this policy less competitive unless justified by high demand or property type.
Recommendations for Hosts
- Consider adopting a Firm policy to align with the 53.2% market standard in Venice Gardens.
- Using a Strict policy might deter some guests, as only 7.6% of listings use it. Evaluate if potential revenue protection outweighs possible lower booking rates.
- Regularly review your cancellation policy against competitors and market demand shifts in Venice Gardens.
Venice Gardens STR Booking Lead Time Analysis (2026)
Average Booking Lead Time by Month
Booking Lead Time Insights for Venice Gardens
- The overall average booking lead time for vacation rentals in Venice Gardens is 73 days.
- Guests book furthest in advance for stays during January (average 128 days), likely coinciding with peak travel demand or local events.
- The shortest booking windows occur for stays in September (average 33 days), indicating more last-minute travel plans during this time.
- Seasonally, Winter (117 days avg.) sees the longest lead times, while Summer (41 days avg.) has the shortest, reflecting typical travel planning cycles.
Recommendations for Hosts
- Use the overall average lead time (73 days) as a baseline for your pricing and availability strategy in Venice Gardens.
- For January stays, consider implementing length-of-stay discounts or slightly higher rates for bookings made less than 128 days out to capitalize on advance planning.
- Target marketing efforts for the Winter season well in advance (at least 117 days) to capture early planners.
- Monitor your own booking lead times against these Venice Gardens averages to identify opportunities for dynamic pricing adjustments.
Popular & Essential Airbnb Amenities in Venice Gardens (2026)
Amenity Prevalence
Amenity Insights for Venice Gardens
- Essential amenities in Venice Gardens that guests expect include: Wifi, Air conditioning, Free parking on premises, Smoke alarm, Heating, Washer, Dishes and silverware, TV, Coffee maker, Hot water. Lacking these (any) could significantly impact bookings.
Recommendations for Hosts
- Ensure your listing includes all essential amenities for Venice Gardens: Wifi, Air conditioning, Free parking on premises, Smoke alarm, Heating, Washer, Dishes and silverware, TV, Coffee maker, Hot water.
- Prioritize adding missing essentials: Smoke alarm, Heating, Washer, Dishes and silverware, TV, Coffee maker, Hot water.
- Highlight unique or less common amenities you offer (e.g., hot tub, dedicated workspace, EV charger) in your listing description and photos.
- Regularly check competitor amenities in Venice Gardens to stay competitive.
Venice Gardens Airbnb Guest Demographics & Profile Analysis (2026)
Guest Profile Summary for Venice Gardens
- The typical guest profile for Airbnb in Venice Gardens consists of primarily domestic travelers (96%), often arriving from nearby Miami, typically belonging to the Post-2000s (Gen Z/Alpha) group (50%), primarily speaking English or Spanish.
- Domestic travelers account for 95.9% of guests.
- Key international markets include United States (95.9%) and Canada (1.8%).
- Top languages spoken are English (72.5%) followed by Spanish (15.5%).
- A significant demographic segment is the Post-2000s (Gen Z/Alpha) group, representing 50% of guests.
Recommendations for Hosts
- Target domestic marketing efforts towards travelers from Miami and Tampa.
- Tailor amenities and listing descriptions to appeal to the dominant Post-2000s (Gen Z/Alpha) demographic (e.g., highlight fast WiFi, smart home features, local guides).
- Highlight unique local experiences or amenities relevant to the primary guest profile.
- Consider seasonal promotions aligned with peak travel times for key origin markets.
Nearby Short-Term Rental Market Comparison
How does the Venice Gardens Airbnb market stack up against its neighbors? Compare key performance metrics like average monthly revenue, ADR, and occupancy rates in surrounding areas to understand the broader regional STR landscape.
| Market | Active Properties | Monthly Revenue | Daily Rate | Avg. Occupancy |
|---|---|---|---|---|
| Anna Maria island | 587 | $7,996 | $823.96 | 41% |
| Anna Maria | 56 | $6,434 | $692.96 | 52% |
| Reunion | 12 | $6,321 | $580.45 | 44% |
| Boca Grande | 31 | $6,128 | $787.07 | 37% |
| Indian Rocks Beach | 842 | $5,560 | $419.63 | 49% |
| Captiva | 291 | $5,443 | $667.40 | 36% |
| Siesta Key | 1,175 | $5,206 | $518.91 | 42% |
| Belleair Beach | 94 | $5,086 | $339.65 | 53% |
| Bradenton Beach | 122 | $4,977 | $507.12 | 42% |
| Thonotosassa | 17 | $4,309 | $347.75 | 50% |