Tequesta Airbnb Market Analysis 2026: Short Term Rental Data & Vacation Rental Statistics in Florida, United States
Is Airbnb profitable in Tequesta in 2026? Explore comprehensive Airbnb analytics for Tequesta, Florida, United States to uncover income potential. This 2026 STR market report for Tequesta, based on AirROI data from February 2025 to January 2026, reveals key trends in the niche market of 43 active listings.
Whether you're considering an Airbnb investment in Tequesta, optimizing your existing vacation rental, or exploring rental arbitrage opportunities, understanding the Tequesta Airbnb data is crucial. Navigating the high regulation landscape is key to maximizing your short term rental income potential. Let's dive into the specifics.
Key Tequesta Airbnb Performance Metrics Overview
Monthly Airbnb Revenue Variations & Income Potential in Tequesta (2026)
Understanding the monthly revenue variations for Airbnb listings in Tequesta is key to maximizing your short term rental income potential. Seasonality significantly impacts earnings. Our analysis, based on data from the past 12 months, shows that the peak revenue month for STRs in Tequesta is typically March, while October often presents the lowest earnings, highlighting opportunities for strategic pricing adjustments during shoulder and low seasons. Explore the typical Airbnb income in Tequesta across different performance tiers:
- Best-in-class properties (Top 10%) achieve $12,366+ monthly, often utilizing dynamic pricing and superior guest experiences.
- Strong performing properties (Top 25%) earn $7,585 or more, indicating effective management and desirable locations/amenities.
- Typical properties (Median) generate around $3,590 per month, representing the average market performance.
- Entry-level properties (Bottom 25%) see earnings around $1,999, often with potential for optimization.
Average Monthly Airbnb Earnings Trend in Tequesta
Tequesta Airbnb Occupancy Rate Trends (2026)
Maximize your bookings by understanding the Tequesta STR occupancy trends. Seasonal demand shifts significantly influence how often properties are booked. Typically, Marchsees the highest demand (peak season occupancy), while November experiences the lowest (low season). Effective strategies, like adjusting minimum stays or offering promotions, can boost occupancy during slower periods. Here's how different property tiers perform in Tequesta:
- Best-in-class properties (Top 10%) achieve 83%+ occupancy, indicating high desirability and potentially optimized availability.
- Strong performing properties (Top 25%) maintain 72% or higher occupancy, suggesting good market fit and guest satisfaction.
- Typical properties (Median) have an occupancy rate around 52%.
- Entry-level properties (Bottom 25%) average 36% occupancy, potentially facing higher vacancy.
Average Monthly Occupancy Rate Trend in Tequesta
Average Daily Rate (ADR) Airbnb Trends in Tequesta (2026)
Effective short term rental pricing strategy in Tequesta involves understanding monthly ADR fluctuations. The Average Daily Rate (ADR) for Airbnb in Tequesta typically peaks in January and dips lowest during September. Leveraging Airbnb dynamic pricing tools or strategies based on this seasonality can significantly boost revenue. Here's a look at the typical nightly rates achieved:
- Best-in-class properties (Top 10%) command rates of $723+ per night, often due to premium features or locations.
- Strong performing properties (Top 25%) achieve nightly rates of $486 or more.
- Typical properties (Median) charge around $322 per night.
- Entry-level properties (Bottom 25%) earn around $149 per night.
Average Daily Rate (ADR) Trend by Month in Tequesta
Get Live Tequesta Market Intelligence 👇

Explore Real-time Analytics
Airbnb Seasonality Analysis & Trends in Tequesta (2026)
Peak Season (March, February, April)
- Revenue averages $8,839 per month
- Occupancy rates average 69.0%
- Daily rates average $393
Shoulder Season
- Revenue averages $5,275 per month
- Occupancy maintains around 48.3%
- Daily rates hold near $386
Low Season (September, October, November)
- Revenue drops to average $3,898 per month
- Occupancy decreases to average 42.4%
- Daily rates adjust to average $361
Seasonality Insights for Tequesta
- The Airbnb seasonality in Tequesta shows highly seasonal trends requiring careful strategy. While the sections above show seasonal averages, it's also insightful to look at the extremes:
- During the high season, the absolute peak month showcases Tequesta's highest earning potential, with monthly revenues capable of climbing to $9,547, occupancy reaching a high of 75.5%, and ADRs peaking at $488.
- Conversely, the slowest single month of the year, typically falling within the low season, marks the market's lowest point. In this month, revenue might dip to $3,721, occupancy could drop to 37.8%, and ADRs may adjust down to $320.
- Understanding both the seasonal averages and these monthly peaks and troughs in revenue, occupancy, and ADR is crucial for maximizing your Airbnb profit potential in Tequesta.
Seasonal Strategies for Maximizing Profit
- Peak Season: Maximize revenue through premium pricing and potentially longer minimum stays. Ensure high availability.
- Low Season: Offer competitive pricing, special promotions (e.g., extended stay discounts), and flexible cancellation policies. Target off-season travelers like remote workers or budget-conscious guests.
- Shoulder Seasons: Implement dynamic pricing that balances peak and low rates. Target weekend travelers or specific events. Offer slightly more flexible terms than peak season.
- Regularly analyze your own performance against these Tequesta seasonality benchmarks and adjust your pricing and availability strategy accordingly.
Best Areas for Airbnb Investment in Tequesta (2026)
Exploring the top neighborhoods for short-term rentals in Tequesta? This section highlights key areas, outlining why they are attractive for hosts and guests, along with notable local attractions. Consider these locations based on your target guest profile and investment strategy.
| Neighborhood / Area | Why Host Here? (Target Guests & Appeal) | Key Attractions & Landmarks |
|---|---|---|
| Tequesta Village | Tequesta Village offers a charming small-town feel with close proximity to beautiful beaches and parks, making it a great destination for families and vacationers alike. | Jupiter Inlet Lighthouse, Tranquility Park, Kavanaugh Park, Coral Cove Park, Jonathan Dickinson State Park |
| Jupiter Beach | Jupiter Beach is known for its stunning coastline and beach activities. It's popular among beach lovers and families looking for a relaxing getaway with plenty of amenities. | Jupiter Beach Park, Carlin Park, Jupiter Lighthouse, Dune Dog Cafe, Guanabanas |
| Palm Beach | Palm Beach is synonymous with luxury and high-end living, attracting affluent visitors seeking upscale shopping and dining experiences alongside pristine beaches. | Worth Avenue, Lake Trail, The Breakers, Henry Morrison Flagler Museum, Philippe Park |
| Hobe Sound | Hobe Sound offers a more laid-back beach experience with natural beauty and outdoor activities, appealing to nature lovers and those looking for tranquility. | Hobe Sound National Wildlife Refuge, Blowing Rocks Preserve, Hobe Sound Beach, Jonathan Dickinson State Park |
| Tequesta Country Club | This residential area appeals to golf enthusiasts and those looking to enjoy outdoor activities, featuring beautiful homes and access to golf courses. | Tequesta Country Club, Coral Cove Park, local golf courses, the Loxahatchee River |
| Loxahatchee River | The Loxahatchee River provides a picturesque backdrop for outdoor recreation, making it enticing for visitors who enjoy kayaking and nature exploration. | Loxahatchee River Environmental Control District, Riverbend Park, Kayaking and canoeing experiences |
| Riverbend Park | Riverbend Park offers outdoor activities such as hiking, biking, and picnicking, attracting visitors who appreciate nature and recreation. | Scenic trails, Picnic areas, Loxahatchee River access, Wildlife viewing |
| Abacoa | Abacoa is a vibrant community known for events and nightlife, making it attractive for younger visitors looking for entertainment options and a lively atmosphere. | Roger Dean Stadium, Abacoa Town Center, local shops and restaurants, Palm Beach State College events |
Understanding Airbnb License Requirements & STR Laws in Tequesta (2026)
Yes, Tequesta, Florida, United States enforces high STR regulations. Obtaining a license and ensuring compliance is almost certainly required according to current 2026 STR laws. Always verify the latest short term rental regulations and Airbnb license requirements directly with local government authorities for Tequesta to ensure full compliance before hosting.
(Source: AirROI data, 2026, based on 67% licensed listings)
Top Performing Airbnb Properties in Tequesta (2026)
Benchmark your potential! Explore examples of top-performing Airbnb properties in Tequestabased on Trailing Twelve Month (TTM) revenue. Analyze their characteristics, revenue, occupancy rate, and ADR to understand what drives success in this market.
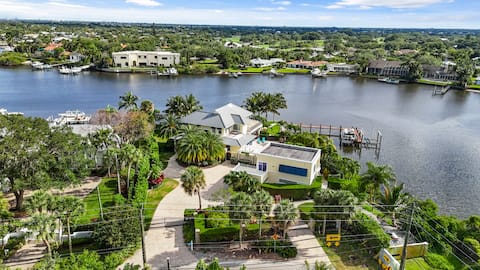
Jupiter Waterfront Compound
Entire Place • 5 bedrooms
The Crew House
Entire Place • 3 bedrooms

The River House: Private Beach AND Boat Included!
Entire Place • 4 bedrooms

5 min from Inlet Lighthouse! Pool home w/Tiki Hut
Entire Place • 3 bedrooms

Mangrove Cove, Bring Your Boat on the Lox River!
Entire Place • 4 bedrooms

Tropical Paradise!
Entire Place • 3 bedrooms
Note: Performance varies based on location, size, amenities, seasonality, and management quality. Data reflects the past 12 months.
Top Performing Airbnb Hosts in Tequesta (2026)
Learn from the best! This table showcases top-performing Airbnb hosts in Tequesta based on the number of properties managed and estimated total revenue over the past year. Analyze their scale and performance metrics.
| Host Name | Properties | Grossing Revenue | Stay Reviews | Avg Rating |
|---|---|---|---|---|
| Ronald Arthur | 1 | $348,611 | 14 | 4.93/5.0 |
| Kelly | 2 | $280,865 | 87 | 4.99/5.0 |
| Tequesta Palms | 10 | $260,230 | 460 | 4.77/5.0 |
| Lauren | 1 | $178,143 | 27 | 5.00/5.0 |
| Riverside Real Estate Services | 1 | $109,499 | 9 | 4.89/5.0 |
| Marc | 1 | $98,932 | 58 | 4.98/5.0 |
| Jodie | 1 | $95,383 | 80 | 4.95/5.0 |
| Heather | 1 | $86,154 | 16 | 5.00/5.0 |
| Amy | 2 | $83,884 | 91 | 4.99/5.0 |
| Katie | 1 | $82,035 | 120 | 4.82/5.0 |
Analyzing the strategies of top hosts, such as their property selection, pricing, and guest communication, can offer valuable lessons for optimizing your own Airbnb operations in Tequesta.
Dive Deeper: Advanced Tequesta STR Market Data (2026)
Ready to unlock more insights? AirROI provides access to advanced metrics and comprehensive Airbnb data for Tequesta. Explore detailed analytics beyond this report to refine your investment strategy, optimize pricing, and maximize your vacation rental profits.
Explore Advanced MetricsTequesta Short-Term Rental Market Composition (2026): Property & Room Types
Room Type Distribution
Property Type Distribution
Market Composition Insights for Tequesta
- The Tequesta Airbnb market composition is heavily skewed towards Entire Home/Apt listings, which make up 65.1% of the 43 active rentals. This indicates strong guest preference for privacy and space.
- However, a notable 34.9% share for Private Rooms suggests opportunities for budget-conscious travelers or hosts renting out spare rooms.
- Looking at the property type distribution in Tequesta, House properties are the most common (74.4%), reflecting the local real estate landscape.
- Houses represent a significant 74.4% portion, catering likely to families or larger groups.
- The presence of 23.3% Hotel/Boutique listings indicates integration with traditional hospitality.
- Smaller segments like outdoor/unique (combined 2.3%) offer potential for unique stay experiences.
Tequesta Airbnb Room Capacity Analysis (2026): Bedroom Distribution
Distribution of Listings by Number of Bedrooms
Room Capacity Insights for Tequesta
- The dominant room capacity in Tequesta is 3 bedrooms listings, making up 30.2% of the market. This suggests a strong demand for properties suitable for families or small groups.
- Together, 3 bedrooms and 1 bedroom properties represent 55.8% of the active Airbnb listings in Tequesta, indicating a high concentration in these sizes.
- A significant 53.4% of listings offer 3+ bedrooms, catering to larger groups and families seeking more space in Tequesta.
Tequesta Vacation Rental Guest Capacity Trends (2026)
Distribution of Listings by Guest Capacity
Guest Capacity Insights for Tequesta
- The most common guest capacity trend in Tequesta vacation rentals is listings accommodating 8+ guests (27.9%). This suggests the primary traveler segment is likely larger groups.
- Properties designed for 8+ guests and 4 guests dominate the Tequesta STR market, accounting for 53.5% of listings.
- 51.2% of properties accommodate 6+ guests, serving the market segment for larger families or group travel in Tequesta.
- On average, properties in Tequesta are equipped to host 5.1 guests.
Tequesta Airbnb Booking Patterns (2026): Available vs. Booked Days
Available Days Distribution
Booked Days Distribution
Booking Pattern Insights for Tequesta
- The most common availability pattern in Tequesta falls within the 91-180 days range, representing 44.2% of listings. This suggests many properties have significant open periods on their calendars.
- Approximately 53.5% of listings show high availability (181+ days open annually), indicating potential for increased bookings or specific owner usage patterns.
- For booked days, the 181-270 days range is most frequent in Tequesta (41.9%), reflecting common guest stay durations or potential owner blocking patterns.
- A notable 46.6% of properties secure long booking periods (181+ days booked per year), highlighting successful long-term rental strategies or significant owner usage.
Tequesta Airbnb Minimum Stay Requirements Analysis
Distribution of Listings by Minimum Night Requirement
1 Night
8 listings
18.6% of total
2 Nights
4 listings
9.3% of total
3 Nights
3 listings
7% of total
4-6 Nights
4 listings
9.3% of total
7-29 Nights
4 listings
9.3% of total
30+ Nights
20 listings
46.5% of total
Key Insights
- The most prevalent minimum stay requirement in Tequesta is 30+ Nights, adopted by 46.5% of listings. This highlights the market's preference for longer commitments.
- A significant segment (46.5%) caters to monthly stays (30+ nights) in Tequesta, pointing to opportunities in the extended-stay market.
Recommendations
- Align with the market by considering a 30+ Nights minimum stay, as 46.5% of Tequesta hosts use this setting.
- If feasible, allowing 1-night stays, especially midweek or during low season, could capture last-minute bookings, as only 18.6% currently do.
- Explore offering discounts for stays of 30+ nights to attract the 46.5% of the market seeking extended stays.
- Adjust minimum nights based on seasonality – potentially shorter during low season and longer during peak demand periods in Tequesta.
Tequesta Airbnb Cancellation Policy Trends Analysis (2026)
Super Strict 30 Days
10 listings
23.3% of total
Flexible
1 listings
2.3% of total
Moderate
7 listings
16.3% of total
Firm
22 listings
51.2% of total
Strict
3 listings
7% of total
Cancellation Policy Insights for Tequesta
- The prevailing Airbnb cancellation policy trend in Tequesta is Firm, used by 51.2% of listings.
- A majority (58.2%) of hosts in Tequesta utilize Firm or Strict policies, indicating a market where hosts prioritize booking security.
- Strict cancellation policies are quite rare (7%), potentially making listings with this policy less competitive unless justified by high demand or property type.
Recommendations for Hosts
- Consider adopting a Firm policy to align with the 51.2% market standard in Tequesta.
- Using a Strict policy might deter some guests, as only 7% of listings use it. Evaluate if potential revenue protection outweighs possible lower booking rates.
- Regularly review your cancellation policy against competitors and market demand shifts in Tequesta.
Tequesta STR Booking Lead Time Analysis (2026)
Average Booking Lead Time by Month
Booking Lead Time Insights for Tequesta
- The overall average booking lead time for vacation rentals in Tequesta is 56 days.
- Guests book furthest in advance for stays during March (average 87 days), likely coinciding with peak travel demand or local events.
- The shortest booking windows occur for stays in August (average 31 days), indicating more last-minute travel plans during this time.
- Seasonally, Winter (77 days avg.) sees the longest lead times, while Summer (38 days avg.) has the shortest, reflecting typical travel planning cycles.
Recommendations for Hosts
- Use the overall average lead time (56 days) as a baseline for your pricing and availability strategy in Tequesta.
- For March stays, consider implementing length-of-stay discounts or slightly higher rates for bookings made less than 87 days out to capitalize on advance planning.
- Target marketing efforts for the Winter season well in advance (at least 77 days) to capture early planners.
- Monitor your own booking lead times against these Tequesta averages to identify opportunities for dynamic pricing adjustments.
Popular & Essential Airbnb Amenities in Tequesta (2026)
Amenity Prevalence
Amenity Insights for Tequesta
- Essential amenities in Tequesta that guests expect include: Smoke alarm, Wifi, TV, Free parking on premises, Air conditioning, Hair dryer, Coffee maker, Refrigerator. Lacking these (any) could significantly impact bookings.
- Popular amenities like Iron, Cooking basics are common but not universal. Offering these can provide a competitive edge.
Recommendations for Hosts
- Ensure your listing includes all essential amenities for Tequesta: Smoke alarm, Wifi, TV, Free parking on premises, Air conditioning, Hair dryer, Coffee maker, Refrigerator.
- Prioritize adding missing essentials: Hair dryer, Coffee maker, Refrigerator.
- Consider adding popular differentiators like Iron or Cooking basics to increase appeal.
- Highlight unique or less common amenities you offer (e.g., hot tub, dedicated workspace, EV charger) in your listing description and photos.
- Regularly check competitor amenities in Tequesta to stay competitive.
Tequesta Airbnb Guest Demographics & Profile Analysis (2026)
Guest Profile Summary for Tequesta
- The typical guest profile for Airbnb in Tequesta consists of primarily domestic travelers (95%), often arriving from nearby New York, typically belonging to the Post-2000s (Gen Z/Alpha) group (50%), primarily speaking English or Spanish.
- Domestic travelers account for 95.3% of guests.
- Key international markets include United States (95.3%) and United Kingdom (1.2%).
- Top languages spoken are English (66.7%) followed by Spanish (19.2%).
- A significant demographic segment is the Post-2000s (Gen Z/Alpha) group, representing 50% of guests.
Recommendations for Hosts
- Target domestic marketing efforts towards travelers from New York and Jupiter.
- Tailor amenities and listing descriptions to appeal to the dominant Post-2000s (Gen Z/Alpha) demographic (e.g., highlight fast WiFi, smart home features, local guides).
- Highlight unique local experiences or amenities relevant to the primary guest profile.
- Consider seasonal promotions aligned with peak travel times for key origin markets.
Nearby Short-Term Rental Market Comparison
How does the Tequesta Airbnb market stack up against its neighbors? Compare key performance metrics like average monthly revenue, ADR, and occupancy rates in surrounding areas to understand the broader regional STR landscape.
| Market | Active Properties | Monthly Revenue | Daily Rate | Avg. Occupancy |
|---|---|---|---|---|
| Sailfish Point | 19 | $16,709 | $1587.63 | 48% |
| Bal Harbour Village | 37 | $8,846 | $850.63 | 34% |
| Lake Clarke Shores | 26 | $6,710 | $516.52 | 46% |
| Lighthouse Point | 75 | $6,205 | $472.94 | 51% |
| Pinecrest | 11 | $6,117 | $861.24 | 43% |
| North Bay Village | 120 | $6,032 | $561.12 | 44% |
| Juno Beach | 39 | $4,807 | $377.00 | 47% |
| Parkland | 17 | $4,637 | $369.21 | 47% |
| Ocean Ridge | 14 | $4,588 | $602.78 | 48% |
| Key Biscayne | 104 | $4,470 | $448.61 | 49% |