Surfside Airbnb Market Analysis 2026: Short Term Rental Data & Vacation Rental Statistics in Florida, United States
Is Airbnb profitable in Surfside in 2026? Explore comprehensive Airbnb analytics for Surfside, Florida, United States to uncover income potential. This 2026 STR market report for Surfside, based on AirROI data from February 2025 to January 2026, reveals key trends in the niche market of 33 active listings.
Whether you're considering an Airbnb investment in Surfside, optimizing your existing vacation rental, or exploring rental arbitrage opportunities, understanding the Surfside Airbnb data is crucial. Leveraging the low regulation environment is key to maximizing your short term rental income potential. Let's dive into the specifics.
Key Surfside Airbnb Performance Metrics Overview
Monthly Airbnb Revenue Variations & Income Potential in Surfside (2026)
Understanding the monthly revenue variations for Airbnb listings in Surfside is key to maximizing your short term rental income potential. Seasonality significantly impacts earnings. Our analysis, based on data from the past 12 months, shows that the peak revenue month for STRs in Surfside is typically March, while September often presents the lowest earnings, highlighting opportunities for strategic pricing adjustments during shoulder and low seasons. Explore the typical Airbnb income in Surfside across different performance tiers:
- Best-in-class properties (Top 10%) achieve $9,009+ monthly, often utilizing dynamic pricing and superior guest experiences.
- Strong performing properties (Top 25%) earn $5,630 or more, indicating effective management and desirable locations/amenities.
- Typical properties (Median) generate around $2,860 per month, representing the average market performance.
- Entry-level properties (Bottom 25%) see earnings around $1,729, often with potential for optimization.
Average Monthly Airbnb Earnings Trend in Surfside
Surfside Airbnb Occupancy Rate Trends (2026)
Maximize your bookings by understanding the Surfside STR occupancy trends. Seasonal demand shifts significantly influence how often properties are booked. Typically, Februarysees the highest demand (peak season occupancy), while September experiences the lowest (low season). Effective strategies, like adjusting minimum stays or offering promotions, can boost occupancy during slower periods. Here's how different property tiers perform in Surfside:
- Best-in-class properties (Top 10%) achieve 81%+ occupancy, indicating high desirability and potentially optimized availability.
- Strong performing properties (Top 25%) maintain 71% or higher occupancy, suggesting good market fit and guest satisfaction.
- Typical properties (Median) have an occupancy rate around 54%.
- Entry-level properties (Bottom 25%) average 35% occupancy, potentially facing higher vacancy.
Average Monthly Occupancy Rate Trend in Surfside
Average Daily Rate (ADR) Airbnb Trends in Surfside (2026)
Effective short term rental pricing strategy in Surfside involves understanding monthly ADR fluctuations. The Average Daily Rate (ADR) for Airbnb in Surfside typically peaks in March and dips lowest during September. Leveraging Airbnb dynamic pricing tools or strategies based on this seasonality can significantly boost revenue. Here's a look at the typical nightly rates achieved:
- Best-in-class properties (Top 10%) command rates of $674+ per night, often due to premium features or locations.
- Strong performing properties (Top 25%) achieve nightly rates of $369 or more.
- Typical properties (Median) charge around $243 per night.
- Entry-level properties (Bottom 25%) earn around $165 per night.
Average Daily Rate (ADR) Trend by Month in Surfside
Get Live Surfside Market Intelligence 👇

Explore Real-time Analytics
Airbnb Seasonality Analysis & Trends in Surfside (2026)
Peak Season (March, February, January)
- Revenue averages $6,779 per month
- Occupancy rates average 67.4%
- Daily rates average $358
Shoulder Season
- Revenue averages $4,494 per month
- Occupancy maintains around 52.3%
- Daily rates hold near $350
Low Season (September, October, November)
- Revenue drops to average $2,769 per month
- Occupancy decreases to average 37.1%
- Daily rates adjust to average $325
Seasonality Insights for Surfside
- The Airbnb seasonality in Surfside shows highly seasonal trends requiring careful strategy. While the sections above show seasonal averages, it's also insightful to look at the extremes:
- During the high season, the absolute peak month showcases Surfside's highest earning potential, with monthly revenues capable of climbing to $8,127, occupancy reaching a high of 78.4%, and ADRs peaking at $358.
- Conversely, the slowest single month of the year, typically falling within the low season, marks the market's lowest point. In this month, revenue might dip to $1,749, occupancy could drop to 27.0%, and ADRs may adjust down to $322.
- Understanding both the seasonal averages and these monthly peaks and troughs in revenue, occupancy, and ADR is crucial for maximizing your Airbnb profit potential in Surfside.
Seasonal Strategies for Maximizing Profit
- Peak Season: Maximize revenue through premium pricing and potentially longer minimum stays. Ensure high availability.
- Low Season: Offer competitive pricing, special promotions (e.g., extended stay discounts), and flexible cancellation policies. Target off-season travelers like remote workers or budget-conscious guests.
- Shoulder Seasons: Implement dynamic pricing that balances peak and low rates. Target weekend travelers or specific events. Offer slightly more flexible terms than peak season.
- Regularly analyze your own performance against these Surfside seasonality benchmarks and adjust your pricing and availability strategy accordingly.
Best Areas for Airbnb Investment in Surfside (2026)
Exploring the top neighborhoods for short-term rentals in Surfside? This section highlights key areas, outlining why they are attractive for hosts and guests, along with notable local attractions. Consider these locations based on your target guest profile and investment strategy.
| Neighborhood / Area | Why Host Here? (Target Guests & Appeal) | Key Attractions & Landmarks |
|---|---|---|
| Surfside Beach | A serene, family-friendly beach town with beautiful sandy beaches and less touristy atmosphere. Perfect for those looking for a relaxed vacation experience while still being close to Miami's attractions. | Surfside Park, North Beach, Bal Harbour Shops, Eden Roc Miami Beach, The Surf Club |
| Bal Harbour | Known for its luxury shopping and upscale hotels, Bal Harbour attracts affluent visitors seeking a high-end beach experience. Ideal for upscale Airbnb offerings. | Bal Harbour Shops, Bal Harbour Beach, Haulover Park, The Ritz-Carlton Spa, Art Galleries |
| Sunny Isles Beach | A popular destination for families and snowbirds, known for its beautiful beaches and newly developed high-rise condos. Offers diverse dining and recreation options. | Sunny Isles Beach, Oleta River State Park, Aventura Mall, Heritage Park, Pier Park |
| Miami Beach | Famous for its vibrant nightlife, art deco architecture, and beautiful beaches. An iconic destination for tourists and a prime spot for a variety of Airbnb listings. | South Beach, Ocean Drive, Lummus Park Beach, Lincoln Road Mall, Miami Beach Botanical Garden |
| Aventura | A lively suburban area with a mix of residential and commercial spaces, Aventura is known for its shopping and dining. Popular with families and business travelers. | Aventura Mall, Turnberry Isle Resort, Aventura Community Park, Founders Park, Waterways Park |
| North Miami Beach | A diverse and growing community that offers a more local experience while still being close to Miami's coastal attractions. It's a more affordable option for Airbnb hosts. | Maule Lake Park, Keystone Point, Oleta River State Park, The Ancient Spanish Monastery, North Miami Beach Ocean Park |
| Lake Worth Beach | A charming coastal city with an artistic vibe, popular among visitors for its relaxed atmosphere and cultural events. Offers more affordable lodging options. | Lake Worth Beach, Lake Worth Playhouse, Cultural Council of Palm Beach County, West Palm Beach, Pineapple Grove Arts District |
| Dania Beach | A lesser-known beach area that offers a more laid-back vibe. Its proximity to Fort Lauderdale makes it a good option for those looking for relaxing beach stays. | Dania Beach Pier, Anne Kolb Nature Center, Hollywood Beach Broadwalk, South Florida Premium Outlets, West Lake Park |
Understanding Airbnb License Requirements & STR Laws in Surfside (2026)
While Surfside, Florida, United States currently shows low STR regulations, specific Airbnb license requirements might still exist or change. Always verify the latest short term rental regulations and Airbnb license requirements directly with local government authorities for Surfside to ensure full compliance before hosting.
(Source: AirROI data, 2026, finding no licensed listings among those analyzed)
Top Performing Airbnb Properties in Surfside (2026)
Benchmark your potential! Explore examples of top-performing Airbnb properties in Surfsidebased on Trailing Twelve Month (TTM) revenue. Analyze their characteristics, revenue, occupancy rate, and ADR to understand what drives success in this market.
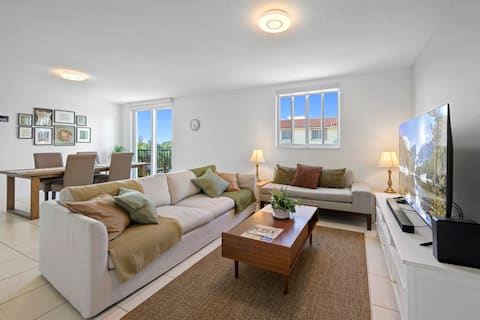
Luxury Beach Townhouse
Entire Place • 4 bedrooms

Location,Luxury, Private 4Bdr w/pool, Walk 2beach
Entire Place • 4 bedrooms
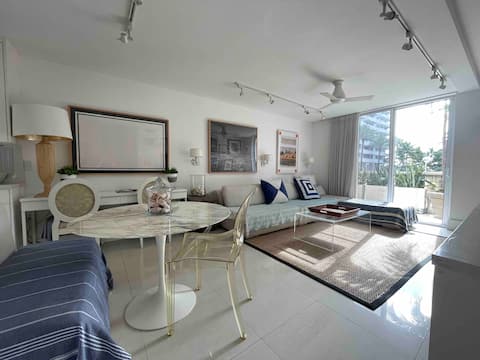
Beautiful Miami Surfside 2 Bed Apart Free Parking
Entire Place • 2 bedrooms
Surf Lodge, Beautiful Surfside Beach, Surf Style
Entire Place • 2 bedrooms

Miami Beautiful Surfside 2 Bed Apart Free Parking
Entire Place • 2 bedrooms
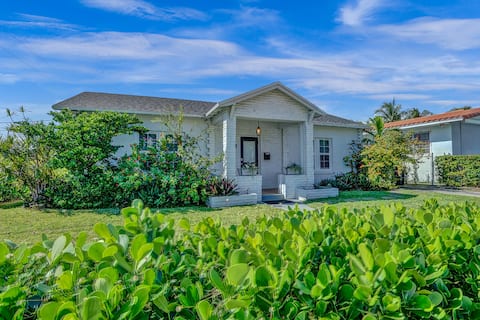
Stunning 2 bedroom dream beach house
Entire Place • 2 bedrooms
Note: Performance varies based on location, size, amenities, seasonality, and management quality. Data reflects the past 12 months.
Top Performing Airbnb Hosts in Surfside (2026)
Learn from the best! This table showcases top-performing Airbnb hosts in Surfside based on the number of properties managed and estimated total revenue over the past year. Analyze their scale and performance metrics.
| Host Name | Properties | Grossing Revenue | Stay Reviews | Avg Rating |
|---|---|---|---|---|
| Sofia | 1 | $302,378 | 40 | 4.93/5.0 |
| Angelo | 4 | $296,131 | 293 | 4.93/5.0 |
| Hilary | 1 | $122,412 | 104 | 4.85/5.0 |
| Jose | 3 | $79,504 | 250 | 4.83/5.0 |
| Marcelo | 3 | $78,401 | 174 | 4.60/5.0 |
| Ayelet | 1 | $69,100 | 42 | 4.79/5.0 |
| Bela | 1 | $56,990 | 17 | 4.59/5.0 |
| Nick | 2 | $56,957 | 69 | 4.90/5.0 |
| Michael William | 1 | $54,574 | 10 | 4.90/5.0 |
| Jairo | 2 | $53,084 | 851 | 4.81/5.0 |
Analyzing the strategies of top hosts, such as their property selection, pricing, and guest communication, can offer valuable lessons for optimizing your own Airbnb operations in Surfside.
Dive Deeper: Advanced Surfside STR Market Data (2026)
Ready to unlock more insights? AirROI provides access to advanced metrics and comprehensive Airbnb data for Surfside. Explore detailed analytics beyond this report to refine your investment strategy, optimize pricing, and maximize your vacation rental profits.
Explore Advanced MetricsSurfside Short-Term Rental Market Composition (2026): Property & Room Types
Room Type Distribution
Property Type Distribution
Market Composition Insights for Surfside
- The Surfside Airbnb market composition is heavily skewed towards Entire Home/Apt listings, which make up 93.9% of the 33 active rentals. This indicates strong guest preference for privacy and space.
- Looking at the property type distribution in Surfside, Apartment/Condo properties are the most common (78.8%), reflecting the local real estate landscape.
- Houses represent a significant 18.2% portion, catering likely to families or larger groups.
- Smaller segments like hotel/boutique (combined 3.0%) offer potential for unique stay experiences.
Surfside Airbnb Room Capacity Analysis (2026): Bedroom Distribution
Distribution of Listings by Number of Bedrooms
Room Capacity Insights for Surfside
- The dominant room capacity in Surfside is 1 bedroom listings, making up 36.4% of the market. This suggests a strong demand for properties suitable for couples or solo travelers.
- Together, 1 bedroom and 2 bedrooms properties represent 72.8% of the active Airbnb listings in Surfside, indicating a high concentration in these sizes.
Surfside Vacation Rental Guest Capacity Trends (2026)
Distribution of Listings by Guest Capacity
Guest Capacity Insights for Surfside
- The most common guest capacity trend in Surfside vacation rentals is listings accommodating 4 guests (33.3%). This suggests the primary traveler segment is likely small families or groups.
- Properties designed for 4 guests and 5 guests dominate the Surfside STR market, accounting for 48.5% of listings.
- 24.2% of properties accommodate 6+ guests, serving the market segment for larger families or group travel in Surfside.
- On average, properties in Surfside are equipped to host 4.4 guests.
Surfside Airbnb Booking Patterns (2026): Available vs. Booked Days
Available Days Distribution
Booked Days Distribution
Booking Pattern Insights for Surfside
- The most common availability pattern in Surfside falls within the 271-366 days range, representing 36.4% of listings. This suggests many properties have significant open periods on their calendars.
- Approximately 60.6% of listings show high availability (181+ days open annually), indicating potential for increased bookings or specific owner usage patterns.
- For booked days, the 181-270 days range is most frequent in Surfside (33.3%), reflecting common guest stay durations or potential owner blocking patterns.
- A notable 39.4% of properties secure long booking periods (181+ days booked per year), highlighting successful long-term rental strategies or significant owner usage.
Surfside Airbnb Minimum Stay Requirements Analysis
Distribution of Listings by Minimum Night Requirement
1 Night
4 listings
12.1% of total
2 Nights
3 listings
9.1% of total
4-6 Nights
7 listings
21.2% of total
7-29 Nights
10 listings
30.3% of total
30+ Nights
9 listings
27.3% of total
Key Insights
- The most prevalent minimum stay requirement in Surfside is 7-29 Nights, adopted by 30.3% of listings. This highlights the market's preference for shorter, flexible bookings.
- A significant segment (27.3%) caters to monthly stays (30+ nights) in Surfside, pointing to opportunities in the extended-stay market.
Recommendations
- Align with the market by considering a 7-29 Nights minimum stay, as 30.3% of Surfside hosts use this setting.
- If feasible, allowing 1-night stays, especially midweek or during low season, could capture last-minute bookings, as only 12.1% currently do.
- Explore offering discounts for stays of 30+ nights to attract the 27.3% of the market seeking extended stays.
- Adjust minimum nights based on seasonality – potentially shorter during low season and longer during peak demand periods in Surfside.
Surfside Airbnb Cancellation Policy Trends Analysis (2026)
Super Strict 30 Days
1 listings
3% of total
Flexible
5 listings
15.2% of total
Moderate
3 listings
9.1% of total
Firm
21 listings
63.6% of total
Strict
3 listings
9.1% of total
Cancellation Policy Insights for Surfside
- The prevailing Airbnb cancellation policy trend in Surfside is Firm, used by 63.6% of listings.
- A majority (72.7%) of hosts in Surfside utilize Firm or Strict policies, indicating a market where hosts prioritize booking security.
- Strict cancellation policies are quite rare (9.1%), potentially making listings with this policy less competitive unless justified by high demand or property type.
Recommendations for Hosts
- Consider adopting a Firm policy to align with the 63.6% market standard in Surfside.
- Using a Strict policy might deter some guests, as only 9.1% of listings use it. Evaluate if potential revenue protection outweighs possible lower booking rates.
- Regularly review your cancellation policy against competitors and market demand shifts in Surfside.
Surfside STR Booking Lead Time Analysis (2026)
Average Booking Lead Time by Month
Booking Lead Time Insights for Surfside
- The overall average booking lead time for vacation rentals in Surfside is 48 days.
- Guests book furthest in advance for stays during January (average 88 days), likely coinciding with peak travel demand or local events.
- The shortest booking windows occur for stays in September (average 24 days), indicating more last-minute travel plans during this time.
- Seasonally, Winter (80 days avg.) sees the longest lead times, while Summer (35 days avg.) has the shortest, reflecting typical travel planning cycles.
Recommendations for Hosts
- Use the overall average lead time (48 days) as a baseline for your pricing and availability strategy in Surfside.
- For January stays, consider implementing length-of-stay discounts or slightly higher rates for bookings made less than 88 days out to capitalize on advance planning.
- Target marketing efforts for the Winter season well in advance (at least 80 days) to capture early planners.
- Monitor your own booking lead times against these Surfside averages to identify opportunities for dynamic pricing adjustments.
Popular & Essential Airbnb Amenities in Surfside (2026)
Amenity Prevalence
Amenity Insights for Surfside
- Essential amenities in Surfside that guests expect include: TV, Wifi, Air conditioning. Lacking these (any) could significantly impact bookings.
- Popular amenities like Kitchen, Refrigerator, Hot water are common but not universal. Offering these can provide a competitive edge.
Recommendations for Hosts
- Ensure your listing includes all essential amenities for Surfside: TV, Wifi, Air conditioning.
- Consider adding popular differentiators like Kitchen or Refrigerator to increase appeal.
- Highlight unique or less common amenities you offer (e.g., hot tub, dedicated workspace, EV charger) in your listing description and photos.
- Regularly check competitor amenities in Surfside to stay competitive.
Surfside Airbnb Guest Demographics & Profile Analysis (2026)
Guest Profile Summary for Surfside
- The typical guest profile for Airbnb in Surfside consists of a mix of domestic (64%) and international guests, often arriving from nearby New York, typically belonging to the Post-2000s (Gen Z/Alpha) group (50%), primarily speaking English or Spanish.
- Domestic travelers account for 64.4% of guests.
- Key international markets include United States (64.4%) and Argentina (12.1%).
- Top languages spoken are English (50%) followed by Spanish (28.9%).
- A significant demographic segment is the Post-2000s (Gen Z/Alpha) group, representing 50% of guests.
Recommendations for Hosts
- Target domestic marketing efforts towards travelers from New York and Buenos Aires.
- Tailor amenities and listing descriptions to appeal to the dominant Post-2000s (Gen Z/Alpha) demographic (e.g., highlight fast WiFi, smart home features, local guides).
- Highlight unique local experiences or amenities relevant to the primary guest profile.
- Consider seasonal promotions aligned with peak travel times for key origin markets.
Nearby Short-Term Rental Market Comparison
How does the Surfside Airbnb market stack up against its neighbors? Compare key performance metrics like average monthly revenue, ADR, and occupancy rates in surrounding areas to understand the broader regional STR landscape.
| Market | Active Properties | Monthly Revenue | Daily Rate | Avg. Occupancy |
|---|---|---|---|---|
| Stock Island | 107 | $9,731 | $733.54 | 47% |
| Bal Harbour Village | 37 | $8,846 | $850.63 | 34% |
| Key West | 1,137 | $7,525 | $630.09 | 47% |
| Lake Clarke Shores | 26 | $6,710 | $516.52 | 46% |
| Lighthouse Point | 75 | $6,205 | $472.94 | 51% |
| Pinecrest | 11 | $6,117 | $861.24 | 43% |
| North Bay Village | 120 | $6,032 | $561.12 | 44% |
| Duck Key | 60 | $5,308 | $504.94 | 43% |
| Little Torch Key | 20 | $5,131 | $701.83 | 29% |
| Tequesta | 43 | $4,920 | $376.96 | 50% |