St. Augustine Airbnb Market Analysis 2026: Short Term Rental Data & Vacation Rental Statistics in Florida, United States
Is Airbnb profitable in St. Augustine in 2026? Explore comprehensive Airbnb analytics for St. Augustine, Florida, United States to uncover income potential. This 2026 STR market report for St. Augustine, based on AirROI data from February 2025 to January 2026, reveals key trends in the bustling market of 1,178 active listings.
Whether you're considering an Airbnb investment in St. Augustine, optimizing your existing vacation rental, or exploring rental arbitrage opportunities, understanding the St. Augustine Airbnb data is crucial. Leveraging the low regulation environment is key to maximizing your short term rental income potential. Let's dive into the specifics.
Key St. Augustine Airbnb Performance Metrics Overview
Monthly Airbnb Revenue Variations & Income Potential in St. Augustine (2026)
Understanding the monthly revenue variations for Airbnb listings in St. Augustine is key to maximizing your short term rental income potential. Seasonality significantly impacts earnings. Our analysis, based on data from the past 12 months, shows that the peak revenue month for STRs in St. Augustine is typically March, while September often presents the lowest earnings, highlighting opportunities for strategic pricing adjustments during shoulder and low seasons. Explore the typical Airbnb income in St. Augustine across different performance tiers:
- Best-in-class properties (Top 10%) achieve $9,445+ monthly, often utilizing dynamic pricing and superior guest experiences.
- Strong performing properties (Top 25%) earn $5,591 or more, indicating effective management and desirable locations/amenities.
- Typical properties (Median) generate around $3,344 per month, representing the average market performance.
- Entry-level properties (Bottom 25%) see earnings around $1,818, often with potential for optimization.
Average Monthly Airbnb Earnings Trend in St. Augustine
St. Augustine Airbnb Occupancy Rate Trends (2026)
Maximize your bookings by understanding the St. Augustine STR occupancy trends. Seasonal demand shifts significantly influence how often properties are booked. Typically, Marchsees the highest demand (peak season occupancy), while September experiences the lowest (low season). Effective strategies, like adjusting minimum stays or offering promotions, can boost occupancy during slower periods. Here's how different property tiers perform in St. Augustine:
- Best-in-class properties (Top 10%) achieve 82%+ occupancy, indicating high desirability and potentially optimized availability.
- Strong performing properties (Top 25%) maintain 67% or higher occupancy, suggesting good market fit and guest satisfaction.
- Typical properties (Median) have an occupancy rate around 47%.
- Entry-level properties (Bottom 25%) average 25% occupancy, potentially facing higher vacancy.
Average Monthly Occupancy Rate Trend in St. Augustine
Average Daily Rate (ADR) Airbnb Trends in St. Augustine (2026)
Effective short term rental pricing strategy in St. Augustine involves understanding monthly ADR fluctuations. The Average Daily Rate (ADR) for Airbnb in St. Augustine typically peaks in December and dips lowest during February. Leveraging Airbnb dynamic pricing tools or strategies based on this seasonality can significantly boost revenue. Here's a look at the typical nightly rates achieved:
- Best-in-class properties (Top 10%) command rates of $539+ per night, often due to premium features or locations.
- Strong performing properties (Top 25%) achieve nightly rates of $357 or more.
- Typical properties (Median) charge around $247 per night.
- Entry-level properties (Bottom 25%) earn around $180 per night.
Average Daily Rate (ADR) Trend by Month in St. Augustine
Get Live St. Augustine Market Intelligence 👇

Explore Real-time Analytics
Airbnb Seasonality Analysis & Trends in St. Augustine (2026)
Peak Season (March, July, June)
- Revenue averages $6,173 per month
- Occupancy rates average 59.5%
- Daily rates average $323
Shoulder Season
- Revenue averages $4,349 per month
- Occupancy maintains around 45.9%
- Daily rates hold near $309
Low Season (January, September, October)
- Revenue drops to average $3,359 per month
- Occupancy decreases to average 36.1%
- Daily rates adjust to average $308
Seasonality Insights for St. Augustine
- The Airbnb seasonality in St. Augustine shows moderate seasonality with distinct peak and low periods. While the sections above show seasonal averages, it's also insightful to look at the extremes:
- During the high season, the absolute peak month showcases St. Augustine's highest earning potential, with monthly revenues capable of climbing to $6,346, occupancy reaching a high of 67.1%, and ADRs peaking at $337.
- Conversely, the slowest single month of the year, typically falling within the low season, marks the market's lowest point. In this month, revenue might dip to $3,165, occupancy could drop to 34.7%, and ADRs may adjust down to $294.
- Understanding both the seasonal averages and these monthly peaks and troughs in revenue, occupancy, and ADR is crucial for maximizing your Airbnb profit potential in St. Augustine.
Seasonal Strategies for Maximizing Profit
- Peak Season: Maximize revenue through premium pricing and potentially longer minimum stays. Ensure high availability.
- Low Season: Offer competitive pricing, special promotions (e.g., extended stay discounts), and flexible cancellation policies. Target off-season travelers like remote workers or budget-conscious guests.
- Shoulder Seasons: Implement dynamic pricing that balances peak and low rates. Target weekend travelers or specific events. Offer slightly more flexible terms than peak season.
- Regularly analyze your own performance against these St. Augustine seasonality benchmarks and adjust your pricing and availability strategy accordingly.
Best Areas for Airbnb Investment in St. Augustine (2026)
Exploring the top neighborhoods for short-term rentals in St. Augustine? This section highlights key areas, outlining why they are attractive for hosts and guests, along with notable local attractions. Consider these locations based on your target guest profile and investment strategy.
| Neighborhood / Area | Why Host Here? (Target Guests & Appeal) | Key Attractions & Landmarks |
|---|---|---|
| Historic District | The Historic District is the heart of St. Augustine, showcasing its rich heritage and colonial architecture. It's highly sought after by tourists looking to explore landmarks and enjoy local dining. | Castillo de San Marcos, St. George Street, Lightner Museum, Flagler College, The Cathedral Basilica of St. Augustine |
| Anastasia Island | Anastasia Island offers beautiful beaches and a relaxed atmosphere, making it a favorite for families and beachgoers seeking a coastal getaway. | Anastasia State Park, St. Augustine Beach, The St. Augustine Lighthouse, Salt Water Cowboy's, South Ponte Vedra Beach |
| Vilano Beach | Vilano Beach is a quieter beach area with charming seaside accommodations and proximity to downtown St. Augustine, appealing to visitors who prefer tranquility with easy access to attractions. | Vilano Beach Pier, Cinnamon Beach, Surfside Park, Catch 27 Restaurant, Vilano Beach Town Center |
| World Golf Village | World Golf Village is an upscale area known for golf and luxury accommodations, attracting golf enthusiasts and those looking for resort-style stays. | World Golf Hall of Fame, King & Bear Golf Course, Slammer & Squire Golf Course, The Renaissance World Golf Village Resort |
| North Beach | North Beach provides a more laid-back vibe compared to other beach areas, great for families and those who want to enjoy nature and local wildlife. | Fort Matanzas National Monument, North Beach Park, Pellicer Creek Aquatic Preserve, Anastasia State Park |
| Downtown St. Augustine | Downtown St. Augustine is bustling with shops, restaurants, and historic sites. It's perfect for visitors who want to immerse themselves in the local culture and nightlife. | St. Augustine Pirate & Treasure Museum, Ghost Tours, The Colonial Quarter, Ripley's Believe It or Not! |
| St. Augustine Shores | St. Augustine Shores is a residential area with a mix of vacation rentals and permanent homes, ideal for visitors looking for a peaceful retreat near the beach. | Shores Golf Club, Crescent Beach, St. Augustine Shores Rive |
| Gamble Rogers State Park | This state park offers a natural setting for camping and outdoor activities, appealing to nature lovers and families looking for adventure and relaxation. | Beach access, Fishing spots, Nature trails, Picnic areas, Wildlife observation |
Understanding Airbnb License Requirements & STR Laws in St. Augustine (2026)
While St. Augustine, Florida, United States currently shows low STR regulations, specific Airbnb license requirements might still exist or change. Always verify the latest short term rental regulations and Airbnb license requirements directly with local government authorities for St. Augustine to ensure full compliance before hosting.
(Source: AirROI data, 2026, finding no licensed listings among those analyzed)
Top Performing Airbnb Properties in St. Augustine (2026)
Benchmark your potential! Explore examples of top-performing Airbnb properties in St. Augustinebased on Trailing Twelve Month (TTM) revenue. Analyze their characteristics, revenue, occupancy rate, and ADR to understand what drives success in this market.
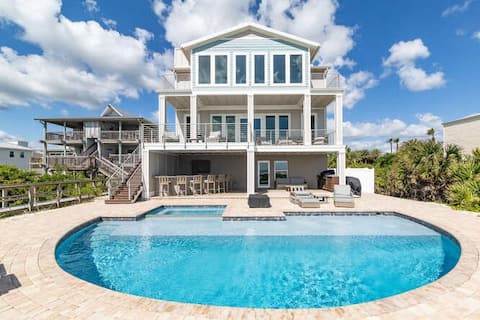
Oceanfront! Pool, Hot tub
Entire Place • 5 bedrooms
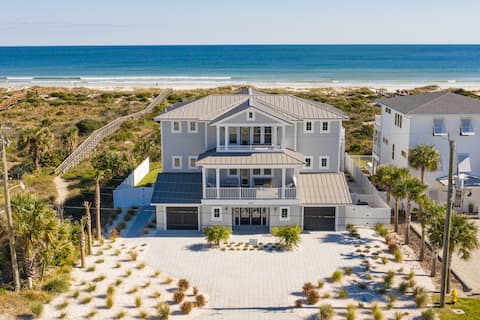
Premier Oceanfront Rental + Luxury Pool/ Hot Tub
Entire Place • 7 bedrooms
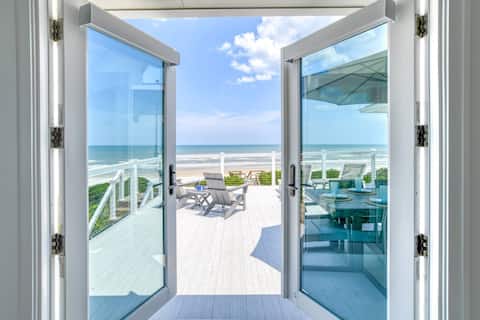
Beachfront, Pool and Hot Tub, $300 in Free Tickets
Entire Place • 8 bedrooms
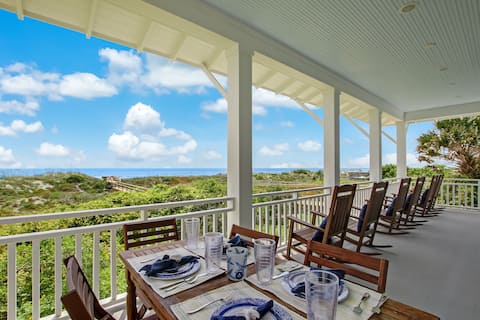
Family-style Oceanfront Beach House
Entire Place • 5 bedrooms
Captain's Oasis - Heated Pool, Walk to the Beach!
Entire Place • 5 bedrooms
Living Luxe |A Luxury Oceanfront and Pool Retreat!
Entire Place • 4 bedrooms
Note: Performance varies based on location, size, amenities, seasonality, and management quality. Data reflects the past 12 months.
Top Performing Airbnb Hosts in St. Augustine (2026)
Learn from the best! This table showcases top-performing Airbnb hosts in St. Augustine based on the number of properties managed and estimated total revenue over the past year. Analyze their scale and performance metrics.
| Host Name | Properties | Grossing Revenue | Stay Reviews | Avg Rating |
|---|---|---|---|---|
| David | 25 | $2,624,645 | 1361 | 4.87/5.0 |
| David | 32 | $2,330,796 | 860 | 4.83/5.0 |
| Distinctive Beach Rentals | 42 | $1,506,971 | 285 | 4.59/5.0 |
| The Proper Group | 14 | $1,451,077 | 611 | 4.78/5.0 |
| Dani | 19 | $1,399,425 | 1042 | 4.89/5.0 |
| Lauren | 21 | $1,344,648 | 634 | 4.88/5.0 |
| Andrea & Danny | 19 | $921,350 | 337 | 4.98/5.0 |
| Elite Vacation Rentals | 8 | $799,500 | 151 | 4.91/5.0 |
| Evolve | 20 | $716,049 | 567 | 4.72/5.0 |
| Glenn And Kelly | 9 | $568,939 | 554 | 4.88/5.0 |
Analyzing the strategies of top hosts, such as their property selection, pricing, and guest communication, can offer valuable lessons for optimizing your own Airbnb operations in St. Augustine.
Dive Deeper: Advanced St. Augustine STR Market Data (2026)
Ready to unlock more insights? AirROI provides access to advanced metrics and comprehensive Airbnb data for St. Augustine. Explore detailed analytics beyond this report to refine your investment strategy, optimize pricing, and maximize your vacation rental profits.
Explore Advanced MetricsSt. Augustine Short-Term Rental Market Composition (2026): Property & Room Types
Room Type Distribution
Property Type Distribution
Market Composition Insights for St. Augustine
- The St. Augustine Airbnb market composition is heavily skewed towards Entire Home/Apt listings, which make up 98.2% of the 1,178 active rentals. This indicates strong guest preference for privacy and space.
- Looking at the property type distribution in St. Augustine, House properties are the most common (48.8%), reflecting the local real estate landscape.
- Houses represent a significant 48.8% portion, catering likely to families or larger groups.
- Smaller segments like hotel/boutique, others, outdoor/unique, unique stays (combined 4.3%) offer potential for unique stay experiences.
St. Augustine Airbnb Room Capacity Analysis (2026): Bedroom Distribution
Distribution of Listings by Number of Bedrooms
Room Capacity Insights for St. Augustine
- The dominant room capacity in St. Augustine is 2 bedrooms listings, making up 37% of the market. This suggests a strong demand for properties suitable for couples or solo travelers.
- Together, 2 bedrooms and 3 bedrooms properties represent 61.4% of the active Airbnb listings in St. Augustine, indicating a high concentration in these sizes.
- A significant 42.1% of listings offer 3+ bedrooms, catering to larger groups and families seeking more space in St. Augustine.
St. Augustine Vacation Rental Guest Capacity Trends (2026)
Distribution of Listings by Guest Capacity
Guest Capacity Insights for St. Augustine
- The most common guest capacity trend in St. Augustine vacation rentals is listings accommodating 8+ guests (31.6%). This suggests the primary traveler segment is likely larger groups.
- Properties designed for 8+ guests and 6 guests dominate the St. Augustine STR market, accounting for 61.7% of listings.
- 65.4% of properties accommodate 6+ guests, serving the market segment for larger families or group travel in St. Augustine.
- On average, properties in St. Augustine are equipped to host 5.8 guests.
St. Augustine Airbnb Booking Patterns (2026): Available vs. Booked Days
Available Days Distribution
Booked Days Distribution
Booking Pattern Insights for St. Augustine
- The most common availability pattern in St. Augustine falls within the 271-366 days range, representing 40.3% of listings. This suggests many properties have significant open periods on their calendars.
- Approximately 75.1% of listings show high availability (181+ days open annually), indicating potential for increased bookings or specific owner usage patterns.
- For booked days, the 91-180 days range is most frequent in St. Augustine (34.3%), reflecting common guest stay durations or potential owner blocking patterns.
- A notable 26.5% of properties secure long booking periods (181+ days booked per year), highlighting successful long-term rental strategies or significant owner usage.
St. Augustine Airbnb Minimum Stay Requirements Analysis
Distribution of Listings by Minimum Night Requirement
1 Night
119 listings
10.1% of total
2 Nights
181 listings
15.4% of total
3 Nights
139 listings
11.8% of total
4-6 Nights
101 listings
8.6% of total
7-29 Nights
104 listings
8.8% of total
30+ Nights
534 listings
45.3% of total
Key Insights
- The most prevalent minimum stay requirement in St. Augustine is 30+ Nights, adopted by 45.3% of listings. This highlights the market's preference for longer commitments.
- A significant segment (45.3%) caters to monthly stays (30+ nights) in St. Augustine, pointing to opportunities in the extended-stay market.
Recommendations
- Align with the market by considering a 30+ Nights minimum stay, as 45.3% of St. Augustine hosts use this setting.
- If feasible, allowing 1-night stays, especially midweek or during low season, could capture last-minute bookings, as only 10.1% currently do.
- Explore offering discounts for stays of 30+ nights to attract the 45.3% of the market seeking extended stays.
- Adjust minimum nights based on seasonality – potentially shorter during low season and longer during peak demand periods in St. Augustine.
St. Augustine Airbnb Cancellation Policy Trends Analysis (2026)
Limited
44 listings
3.7% of total
Super Strict 60 Days
26 listings
2.2% of total
Super Strict 30 Days
92 listings
7.8% of total
Flexible
140 listings
11.9% of total
Moderate
310 listings
26.3% of total
Firm
461 listings
39.1% of total
Strict
105 listings
8.9% of total
Cancellation Policy Insights for St. Augustine
- The prevailing Airbnb cancellation policy trend in St. Augustine is Firm, used by 39.1% of listings.
- There's a relatively balanced mix between guest-friendly (38.2%) and stricter (48.0%) policies, offering choices for different guest needs.
- Strict cancellation policies are quite rare (8.9%), potentially making listings with this policy less competitive unless justified by high demand or property type.
Recommendations for Hosts
- Consider adopting a Firm policy to align with the 39.1% market standard in St. Augustine.
- Using a Strict policy might deter some guests, as only 8.9% of listings use it. Evaluate if potential revenue protection outweighs possible lower booking rates.
- Regularly review your cancellation policy against competitors and market demand shifts in St. Augustine.
St. Augustine STR Booking Lead Time Analysis (2026)
Average Booking Lead Time by Month
Booking Lead Time Insights for St. Augustine
- The overall average booking lead time for vacation rentals in St. Augustine is 58 days.
- Guests book furthest in advance for stays during March (average 72 days), likely coinciding with peak travel demand or local events.
- The shortest booking windows occur for stays in December (average 42 days), indicating more last-minute travel plans during this time.
- Seasonally, Spring (63 days avg.) sees the longest lead times, while Fall (51 days avg.) has the shortest, reflecting typical travel planning cycles.
Recommendations for Hosts
- Use the overall average lead time (58 days) as a baseline for your pricing and availability strategy in St. Augustine.
- For March stays, consider implementing length-of-stay discounts or slightly higher rates for bookings made less than 72 days out to capitalize on advance planning.
- Target marketing efforts for the Spring season well in advance (at least 63 days) to capture early planners.
- Monitor your own booking lead times against these St. Augustine averages to identify opportunities for dynamic pricing adjustments.
Popular & Essential Airbnb Amenities in St. Augustine (2026)
Amenity Prevalence
Amenity Insights for St. Augustine
- Essential amenities in St. Augustine that guests expect include: Air conditioning, Wifi, Free parking on premises, TV, Smoke alarm. Lacking these (any) could significantly impact bookings.
- Popular amenities like Kitchen, Heating, Refrigerator are common but not universal. Offering these can provide a competitive edge.
Recommendations for Hosts
- Ensure your listing includes all essential amenities for St. Augustine: Air conditioning, Wifi, Free parking on premises, TV, Smoke alarm.
- Prioritize adding missing essentials: Air conditioning, Wifi, Free parking on premises, TV, Smoke alarm.
- Consider adding popular differentiators like Kitchen or Heating to increase appeal.
- Highlight unique or less common amenities you offer (e.g., hot tub, dedicated workspace, EV charger) in your listing description and photos.
- Regularly check competitor amenities in St. Augustine to stay competitive.
St. Augustine Airbnb Guest Demographics & Profile Analysis (2026)
Guest Profile Summary for St. Augustine
- The typical guest profile for Airbnb in St. Augustine consists of primarily domestic travelers (97%), often arriving from nearby Gainesville, typically belonging to the Post-2000s (Gen Z/Alpha) group (50%), primarily speaking English or Spanish.
- Domestic travelers account for 96.7% of guests.
- Key international markets include United States (96.7%) and Canada (0.9%).
- Top languages spoken are English (73.1%) followed by Spanish (16.3%).
- A significant demographic segment is the Post-2000s (Gen Z/Alpha) group, representing 50% of guests.
Recommendations for Hosts
- Target domestic marketing efforts towards travelers from Gainesville and Jacksonville.
- Tailor amenities and listing descriptions to appeal to the dominant Post-2000s (Gen Z/Alpha) demographic (e.g., highlight fast WiFi, smart home features, local guides).
- Highlight unique local experiences or amenities relevant to the primary guest profile.
- Consider seasonal promotions aligned with peak travel times for key origin markets.
Nearby Short-Term Rental Market Comparison
How does the St. Augustine Airbnb market stack up against its neighbors? Compare key performance metrics like average monthly revenue, ADR, and occupancy rates in surrounding areas to understand the broader regional STR landscape.
| Market | Active Properties | Monthly Revenue | Daily Rate | Avg. Occupancy |
|---|---|---|---|---|
| St. Johns County | 12 | $6,964 | $592.43 | 47% |
| Reunion | 12 | $6,321 | $580.45 | 44% |
| Ponte Vedra Beach | 224 | $5,720 | $574.75 | 43% |
| Vilano Beach | 173 | $5,571 | $442.95 | 45% |
| Melbourne Beach | 275 | $5,384 | $488.83 | 43% |
| Thonotosassa | 17 | $4,309 | $347.75 | 50% |
| Jacksonville Beach | 763 | $4,123 | $328.32 | 49% |
| Campbell | 22 | $4,011 | $343.05 | 51% |
| Indian Harbour Beach | 131 | $3,895 | $289.71 | 50% |
| Cocoa Beach | 983 | $3,883 | $307.17 | 48% |