Southwest Ranches Airbnb Market Analysis 2026: Short Term Rental Data & Vacation Rental Statistics in Florida, United States
Is Airbnb profitable in Southwest Ranches in 2026? Explore comprehensive Airbnb analytics for Southwest Ranches, Florida, United States to uncover income potential. This 2026 STR market report for Southwest Ranches, based on AirROI data from February 2025 to January 2026, reveals key trends in the niche market of 31 active listings.
Whether you're considering an Airbnb investment in Southwest Ranches, optimizing your existing vacation rental, or exploring rental arbitrage opportunities, understanding the Southwest Ranches Airbnb data is crucial. Leveraging the low regulation environment is key to maximizing your short term rental income potential. Let's dive into the specifics.
Key Southwest Ranches Airbnb Performance Metrics Overview
Monthly Airbnb Revenue Variations & Income Potential in Southwest Ranches (2026)
Understanding the monthly revenue variations for Airbnb listings in Southwest Ranches is key to maximizing your short term rental income potential. Seasonality significantly impacts earnings. Our analysis, based on data from the past 12 months, shows that the peak revenue month for STRs in Southwest Ranches is typically March, while November often presents the lowest earnings, highlighting opportunities for strategic pricing adjustments during shoulder and low seasons. Explore the typical Airbnb income in Southwest Ranches across different performance tiers:
- Best-in-class properties (Top 10%) achieve $11,422+ monthly, often utilizing dynamic pricing and superior guest experiences.
- Strong performing properties (Top 25%) earn $5,476 or more, indicating effective management and desirable locations/amenities.
- Typical properties (Median) generate around $2,761 per month, representing the average market performance.
- Entry-level properties (Bottom 25%) see earnings around $1,408, often with potential for optimization.
Average Monthly Airbnb Earnings Trend in Southwest Ranches
Southwest Ranches Airbnb Occupancy Rate Trends (2026)
Maximize your bookings by understanding the Southwest Ranches STR occupancy trends. Seasonal demand shifts significantly influence how often properties are booked. Typically, Marchsees the highest demand (peak season occupancy), while January experiences the lowest (low season). Effective strategies, like adjusting minimum stays or offering promotions, can boost occupancy during slower periods. Here's how different property tiers perform in Southwest Ranches:
- Best-in-class properties (Top 10%) achieve 77%+ occupancy, indicating high desirability and potentially optimized availability.
- Strong performing properties (Top 25%) maintain 54% or higher occupancy, suggesting good market fit and guest satisfaction.
- Typical properties (Median) have an occupancy rate around 32%.
- Entry-level properties (Bottom 25%) average 16% occupancy, potentially facing higher vacancy.
Average Monthly Occupancy Rate Trend in Southwest Ranches
Average Daily Rate (ADR) Airbnb Trends in Southwest Ranches (2026)
Effective short term rental pricing strategy in Southwest Ranches involves understanding monthly ADR fluctuations. The Average Daily Rate (ADR) for Airbnb in Southwest Ranches typically peaks in June and dips lowest during September. Leveraging Airbnb dynamic pricing tools or strategies based on this seasonality can significantly boost revenue. Here's a look at the typical nightly rates achieved:
- Best-in-class properties (Top 10%) command rates of $1,188+ per night, often due to premium features or locations.
- Strong performing properties (Top 25%) achieve nightly rates of $821 or more.
- Typical properties (Median) charge around $325 per night.
- Entry-level properties (Bottom 25%) earn around $145 per night.
Average Daily Rate (ADR) Trend by Month in Southwest Ranches
Get Live Southwest Ranches Market Intelligence 👇

Explore Real-time Analytics
Airbnb Seasonality Analysis & Trends in Southwest Ranches (2026)
Peak Season (March, April, December)
- Revenue averages $5,620 per month
- Occupancy rates average 43.2%
- Daily rates average $591
Shoulder Season
- Revenue averages $4,702 per month
- Occupancy maintains around 36.8%
- Daily rates hold near $581
Low Season (January, October, November)
- Revenue drops to average $3,971 per month
- Occupancy decreases to average 33.3%
- Daily rates adjust to average $530
Seasonality Insights for Southwest Ranches
- The Airbnb seasonality in Southwest Ranches shows moderate seasonality with distinct peak and low periods. While the sections above show seasonal averages, it's also insightful to look at the extremes:
- During the high season, the absolute peak month showcases Southwest Ranches's highest earning potential, with monthly revenues capable of climbing to $6,064, occupancy reaching a high of 52.0%, and ADRs peaking at $604.
- Conversely, the slowest single month of the year, typically falling within the low season, marks the market's lowest point. In this month, revenue might dip to $3,875, occupancy could drop to 27.7%, and ADRs may adjust down to $518.
- Understanding both the seasonal averages and these monthly peaks and troughs in revenue, occupancy, and ADR is crucial for maximizing your Airbnb profit potential in Southwest Ranches.
Seasonal Strategies for Maximizing Profit
- Peak Season: Maximize revenue through premium pricing and potentially longer minimum stays. Ensure high availability.
- Low Season: Offer competitive pricing, special promotions (e.g., extended stay discounts), and flexible cancellation policies. Target off-season travelers like remote workers or budget-conscious guests.
- Shoulder Seasons: Implement dynamic pricing that balances peak and low rates. Target weekend travelers or specific events. Offer slightly more flexible terms than peak season.
- Regularly analyze your own performance against these Southwest Ranches seasonality benchmarks and adjust your pricing and availability strategy accordingly.
Best Areas for Airbnb Investment in Southwest Ranches (2026)
Exploring the top neighborhoods for short-term rentals in Southwest Ranches? This section highlights key areas, outlining why they are attractive for hosts and guests, along with notable local attractions. Consider these locations based on your target guest profile and investment strategy.
| Neighborhood / Area | Why Host Here? (Target Guests & Appeal) | Key Attractions & Landmarks |
|---|---|---|
| Sunrise | A growing suburban area near Southwest Ranches with great shopping and entertainment options. Attracts families and tourists looking for a quiet retreat while still being close to urban amenities. | BB&T Center, Sunrise Civic Center, Sawgrass Mills, Markham Park |
| Weston | An affluent community with beautiful parks and family-friendly neighborhoods. Ideal for travelers seeking a more upscale and serene environment away from the hustle and bustle. | Weston Town Center, Everglades Holiday Park, Tequesta Trace Park, Markham Park |
| Pembroke Pines | A rapidly developing city that offers a mix of residential and commercial spaces. Popular with families and business travelers due to its proximity to major highways and attractions. | Pembroke Lakes Mall, CB Smith Park, Copperstone Resort, Southwest Broward Cultural Arts Center |
| Davie | Known for its equestrian lifestyle and rural charm, Davie attracts visitors looking for unique experiences and outdoor activities, including horseback riding and nature parks. | Flamingo Gardens, Wolf Lake Park, Davie Ranches, Pioneer Park |
| Fort Lauderdale | Just a short distance from Southwest Ranches, known for its beaches and vibrant nightlife. Attracts both leisure and business travelers with diverse attractions. | Fort Lauderdale Beach, Las Olas Boulevard, Bonnet House Museum & Gardens, Riverwalk Fort Lauderdale |
| Hollywood | A vibrant beachfront community with stunning boardwalks and nightlife. It attracts tourists looking for beachside accommodations and entertainment options. | Hollywood Beach Broadwalk, Gulfstream Park Racing & Casino, Anne Kolb Nature Center, ArtsPark at Young Circle |
| Coral Springs | A family-friendly city with many parks and recreational facilities. Great for visitors seeking a safe and welcoming environment. | The Walk at Coral Springs, Coral Springs Museum of Art, Everglades Greenway, Pine Trails Park |
| Miramar | A growing city close to major highways that is ideal for tourists looking for convenient access to attractions in both Miami and Fort Lauderdale. | Miramar Regional Park, The Shops at Pembroke Gardens, Grand Palms Golf Club, Coconut Cove Waterpark |
Understanding Airbnb License Requirements & STR Laws in Southwest Ranches (2026)
While Southwest Ranches, Florida, United States currently shows low STR regulations, specific Airbnb license requirements might still exist or change. Always verify the latest short term rental regulations and Airbnb license requirements directly with local government authorities for Southwest Ranches to ensure full compliance before hosting.
(Source: AirROI data, 2026, finding no licensed listings among those analyzed)
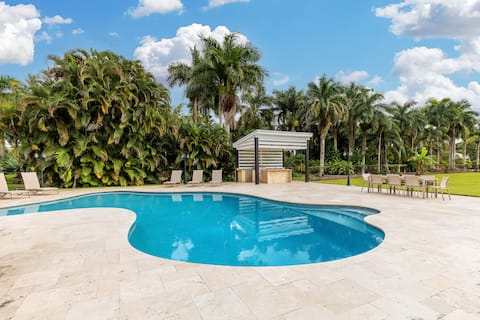
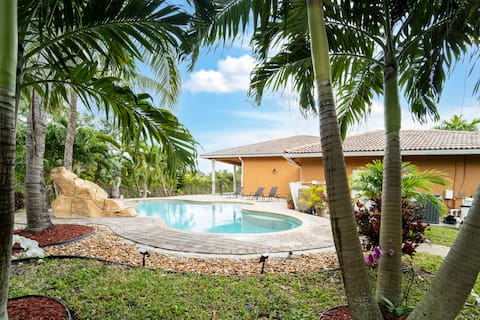
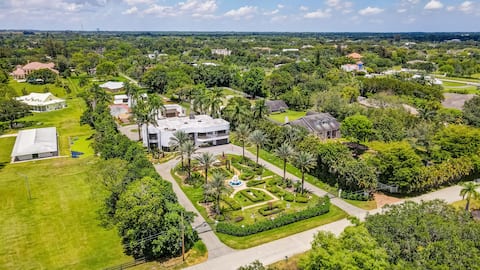
Top Performing Airbnb Properties in Southwest Ranches (2026)
Benchmark your potential! Explore examples of top-performing Airbnb properties in Southwest Ranchesbased on Trailing Twelve Month (TTM) revenue. Analyze their characteristics, revenue, occupancy rate, and ADR to understand what drives success in this market.
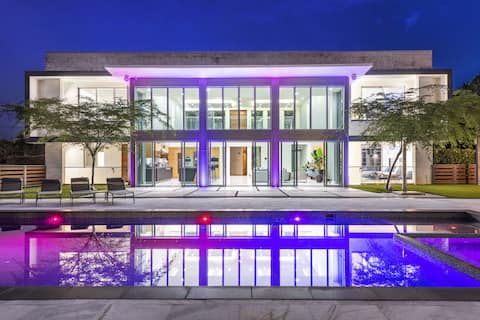
*NEW* 2 Acre Modern Compound - Modani Estates
Entire Place • 9 bedrooms
Majestic Home 7 Bedroom w/ Heated Pool, Huge Yard
Entire Place • 7 bedrooms
Colossal 4 Bedroom Manor w/ Pool
Entire Place • 4 bedrooms
Stunning Villa with 6 BR, 5.5 Baths, on 2.9 Ac
Entire Place • 6 bedrooms

The Ranches: 1 acre lot with Gazebo!
Entire Place • 3 bedrooms

Villa Stirling Ranch
Entire Place • 7 bedrooms
Note: Performance varies based on location, size, amenities, seasonality, and management quality. Data reflects the past 12 months.
Top Performing Airbnb Hosts in Southwest Ranches (2026)
Learn from the best! This table showcases top-performing Airbnb hosts in Southwest Ranches based on the number of properties managed and estimated total revenue over the past year. Analyze their scale and performance metrics.
| Host Name | Properties | Grossing Revenue | Stay Reviews | Avg Rating |
|---|---|---|---|---|
| Daniel | 2 | $225,476 | 32 | 4.88/5.0 |
| Jonathan | 1 | $221,407 | 5 | 4.80/5.0 |
| Susy | 4 | $76,436 | 174 | 4.93/5.0 |
| Jhonson | 1 | $64,616 | 39 | 4.64/5.0 |
| Newman Hospitality Value | 1 | $58,913 | 12 | 4.83/5.0 |
| Nelson | 1 | $58,536 | 10 | 4.90/5.0 |
| DesignedVR | 1 | $47,474 | 9 | 4.56/5.0 |
| Betsabe | 1 | $46,579 | 1 | Not Rated |
| Samantha | 1 | $46,154 | 9 | 5.00/5.0 |
| Jawad | 1 | $46,095 | 54 | 5.00/5.0 |
Analyzing the strategies of top hosts, such as their property selection, pricing, and guest communication, can offer valuable lessons for optimizing your own Airbnb operations in Southwest Ranches.
Dive Deeper: Advanced Southwest Ranches STR Market Data (2026)
Ready to unlock more insights? AirROI provides access to advanced metrics and comprehensive Airbnb data for Southwest Ranches. Explore detailed analytics beyond this report to refine your investment strategy, optimize pricing, and maximize your vacation rental profits.
Explore Advanced MetricsSouthwest Ranches Short-Term Rental Market Composition (2026): Property & Room Types
Room Type Distribution
Property Type Distribution
Market Composition Insights for Southwest Ranches
- The Southwest Ranches Airbnb market composition is heavily skewed towards Entire Home/Apt listings, which make up 83.9% of the 31 active rentals. This indicates strong guest preference for privacy and space.
- Looking at the property type distribution in Southwest Ranches, House properties are the most common (77.4%), reflecting the local real estate landscape.
- Houses represent a significant 77.4% portion, catering likely to families or larger groups.
- The presence of 19.4% Hotel/Boutique listings indicates integration with traditional hospitality.
- Smaller segments like unique stays (combined 3.2%) offer potential for unique stay experiences.
Southwest Ranches Airbnb Room Capacity Analysis (2026): Bedroom Distribution
Distribution of Listings by Number of Bedrooms
Room Capacity Insights for Southwest Ranches
- The dominant room capacity in Southwest Ranches is 5+ bedrooms listings, making up 22.6% of the market. This suggests a strong demand for properties suitable for families or small groups.
- Together, 5+ bedrooms and 1 bedroom properties represent 42.0% of the active Airbnb listings in Southwest Ranches, indicating a high concentration in these sizes.
- A significant 51.6% of listings offer 3+ bedrooms, catering to larger groups and families seeking more space in Southwest Ranches.
Southwest Ranches Vacation Rental Guest Capacity Trends (2026)
Distribution of Listings by Guest Capacity
Guest Capacity Insights for Southwest Ranches
- The most common guest capacity trend in Southwest Ranches vacation rentals is listings accommodating 8+ guests (45.2%). This suggests the primary traveler segment is likely larger groups.
- Properties designed for 8+ guests and 4 guests dominate the Southwest Ranches STR market, accounting for 64.6% of listings.
- 54.9% of properties accommodate 6+ guests, serving the market segment for larger families or group travel in Southwest Ranches.
- On average, properties in Southwest Ranches are equipped to host 5.2 guests.
Southwest Ranches Airbnb Booking Patterns (2026): Available vs. Booked Days
Available Days Distribution
Booked Days Distribution
Booking Pattern Insights for Southwest Ranches
- The most common availability pattern in Southwest Ranches falls within the 271-366 days range, representing 54.8% of listings. This suggests many properties have significant open periods on their calendars.
- Approximately 83.8% of listings show high availability (181+ days open annually), indicating potential for increased bookings or specific owner usage patterns.
- For booked days, the 91-180 days range is most frequent in Southwest Ranches (32.3%), reflecting common guest stay durations or potential owner blocking patterns.
- A notable 16.1% of properties secure long booking periods (181+ days booked per year), highlighting successful long-term rental strategies or significant owner usage.
Southwest Ranches Airbnb Minimum Stay Requirements Analysis
Distribution of Listings by Minimum Night Requirement
1 Night
6 listings
19.4% of total
2 Nights
8 listings
25.8% of total
3 Nights
3 listings
9.7% of total
4-6 Nights
5 listings
16.1% of total
7-29 Nights
4 listings
12.9% of total
30+ Nights
5 listings
16.1% of total
Key Insights
- The most prevalent minimum stay requirement in Southwest Ranches is 2 Nights, adopted by 25.8% of listings. This highlights the market's preference for shorter, flexible bookings.
- A significant segment (16.1%) caters to monthly stays (30+ nights) in Southwest Ranches, pointing to opportunities in the extended-stay market.
Recommendations
- Align with the market by considering a 2 Nights minimum stay, as 25.8% of Southwest Ranches hosts use this setting.
- If feasible, allowing 1-night stays, especially midweek or during low season, could capture last-minute bookings, as only 19.4% currently do.
- Explore offering discounts for stays of 30+ nights to attract the 16.1% of the market seeking extended stays.
- Adjust minimum nights based on seasonality – potentially shorter during low season and longer during peak demand periods in Southwest Ranches.
Southwest Ranches Airbnb Cancellation Policy Trends Analysis (2026)
Flexible
6 listings
19.4% of total
Moderate
13 listings
41.9% of total
Firm
7 listings
22.6% of total
Strict
5 listings
16.1% of total
Cancellation Policy Insights for Southwest Ranches
- The prevailing Airbnb cancellation policy trend in Southwest Ranches is Moderate, used by 41.9% of listings.
- There's a relatively balanced mix between guest-friendly (61.3%) and stricter (38.7%) policies, offering choices for different guest needs.
Recommendations for Hosts
- Consider adopting a Moderate policy to align with the 41.9% market standard in Southwest Ranches.
- Regularly review your cancellation policy against competitors and market demand shifts in Southwest Ranches.
Southwest Ranches STR Booking Lead Time Analysis (2026)
Average Booking Lead Time by Month
Booking Lead Time Insights for Southwest Ranches
- The overall average booking lead time for vacation rentals in Southwest Ranches is 35 days.
- Guests book furthest in advance for stays during December (average 61 days), likely coinciding with peak travel demand or local events.
- The shortest booking windows occur for stays in August (average 19 days), indicating more last-minute travel plans during this time.
- Seasonally, Winter (44 days avg.) sees the longest lead times, while Summer (22 days avg.) has the shortest, reflecting typical travel planning cycles.
Recommendations for Hosts
- Use the overall average lead time (35 days) as a baseline for your pricing and availability strategy in Southwest Ranches.
- For December stays, consider implementing length-of-stay discounts or slightly higher rates for bookings made less than 61 days out to capitalize on advance planning.
- Target marketing efforts for the Winter season well in advance (at least 44 days) to capture early planners.
- Monitor your own booking lead times against these Southwest Ranches averages to identify opportunities for dynamic pricing adjustments.
Popular & Essential Airbnb Amenities in Southwest Ranches (2026)
Amenity Prevalence
Amenity Insights for Southwest Ranches
- Essential amenities in Southwest Ranches that guests expect include: Wifi, TV, Air conditioning, Free parking on premises. Lacking these (any) could significantly impact bookings.
- Popular amenities like Kitchen, Smoke alarm, Hangers are common but not universal. Offering these can provide a competitive edge.
Recommendations for Hosts
- Ensure your listing includes all essential amenities for Southwest Ranches: Wifi, TV, Air conditioning, Free parking on premises.
- Prioritize adding missing essentials: Free parking on premises.
- Consider adding popular differentiators like Kitchen or Smoke alarm to increase appeal.
- Highlight unique or less common amenities you offer (e.g., hot tub, dedicated workspace, EV charger) in your listing description and photos.
- Regularly check competitor amenities in Southwest Ranches to stay competitive.
Southwest Ranches Airbnb Guest Demographics & Profile Analysis (2026)
Guest Profile Summary for Southwest Ranches
- The typical guest profile for Airbnb in Southwest Ranches consists of primarily domestic travelers (88%), often arriving from nearby Seattle, typically belonging to the Post-2000s (Gen Z/Alpha) group (50%), primarily speaking English or Spanish.
- Domestic travelers account for 88.0% of guests.
- Key international markets include United States (88%) and Cayman Islands (3.7%).
- Top languages spoken are English (59%) followed by Spanish (17.9%).
- A significant demographic segment is the Post-2000s (Gen Z/Alpha) group, representing 50% of guests.
Recommendations for Hosts
- Target domestic marketing efforts towards travelers from Seattle and Dania Beach.
- Tailor amenities and listing descriptions to appeal to the dominant Post-2000s (Gen Z/Alpha) demographic (e.g., highlight fast WiFi, smart home features, local guides).
- Highlight unique local experiences or amenities relevant to the primary guest profile.
- Consider seasonal promotions aligned with peak travel times for key origin markets.
Nearby Short-Term Rental Market Comparison
How does the Southwest Ranches Airbnb market stack up against its neighbors? Compare key performance metrics like average monthly revenue, ADR, and occupancy rates in surrounding areas to understand the broader regional STR landscape.
| Market | Active Properties | Monthly Revenue | Daily Rate | Avg. Occupancy |
|---|---|---|---|---|
| Sailfish Point | 19 | $16,709 | $1587.63 | 48% |
| Bal Harbour Village | 37 | $8,846 | $850.63 | 34% |
| Lake Clarke Shores | 26 | $6,710 | $516.52 | 46% |
| Lighthouse Point | 75 | $6,205 | $472.94 | 51% |
| Pinecrest | 11 | $6,117 | $861.24 | 43% |
| North Bay Village | 120 | $6,032 | $561.12 | 44% |
| Tequesta | 43 | $4,920 | $376.96 | 50% |
| Juno Beach | 39 | $4,807 | $377.00 | 47% |
| Parkland | 17 | $4,637 | $369.21 | 47% |
| Ocean Ridge | 14 | $4,588 | $602.78 | 48% |