Southchase Airbnb Market Analysis 2026: Short Term Rental Data & Vacation Rental Statistics in Florida, United States
Is Airbnb profitable in Southchase in 2026? Explore comprehensive Airbnb analytics for Southchase, Florida, United States to uncover income potential. This 2026 STR market report for Southchase, based on AirROI data from February 2025 to January 2026, reveals key trends in the niche market of 20 active listings.
Whether you're considering an Airbnb investment in Southchase, optimizing your existing vacation rental, or exploring rental arbitrage opportunities, understanding the Southchase Airbnb data is crucial. Leveraging the low regulation environment is key to maximizing your short term rental income potential. Let's dive into the specifics.
Key Southchase Airbnb Performance Metrics Overview
Monthly Airbnb Revenue Variations & Income Potential in Southchase (2026)
Understanding the monthly revenue variations for Airbnb listings in Southchase is key to maximizing your short term rental income potential. Seasonality significantly impacts earnings. Our analysis, based on data from the past 12 months, shows that the peak revenue month for STRs in Southchase is typically December, while October often presents the lowest earnings, highlighting opportunities for strategic pricing adjustments during shoulder and low seasons. Explore the typical Airbnb income in Southchase across different performance tiers:
- Best-in-class properties (Top 10%) achieve $4,114+ monthly, often utilizing dynamic pricing and superior guest experiences.
- Strong performing properties (Top 25%) earn $1,934 or more, indicating effective management and desirable locations/amenities.
- Typical properties (Median) generate around $1,113 per month, representing the average market performance.
- Entry-level properties (Bottom 25%) see earnings around $686, often with potential for optimization.
Average Monthly Airbnb Earnings Trend in Southchase
Southchase Airbnb Occupancy Rate Trends (2026)
Maximize your bookings by understanding the Southchase STR occupancy trends. Seasonal demand shifts significantly influence how often properties are booked. Typically, Marchsees the highest demand (peak season occupancy), while April experiences the lowest (low season). Effective strategies, like adjusting minimum stays or offering promotions, can boost occupancy during slower periods. Here's how different property tiers perform in Southchase:
- Best-in-class properties (Top 10%) achieve 89%+ occupancy, indicating high desirability and potentially optimized availability.
- Strong performing properties (Top 25%) maintain 75% or higher occupancy, suggesting good market fit and guest satisfaction.
- Typical properties (Median) have an occupancy rate around 45%.
- Entry-level properties (Bottom 25%) average 24% occupancy, potentially facing higher vacancy.
Average Monthly Occupancy Rate Trend in Southchase
Average Daily Rate (ADR) Airbnb Trends in Southchase (2026)
Effective short term rental pricing strategy in Southchase involves understanding monthly ADR fluctuations. The Average Daily Rate (ADR) for Airbnb in Southchase typically peaks in June and dips lowest during April. Leveraging Airbnb dynamic pricing tools or strategies based on this seasonality can significantly boost revenue. Here's a look at the typical nightly rates achieved:
- Best-in-class properties (Top 10%) command rates of $242+ per night, often due to premium features or locations.
- Strong performing properties (Top 25%) achieve nightly rates of $153 or more.
- Typical properties (Median) charge around $88 per night.
- Entry-level properties (Bottom 25%) earn around $56 per night.
Average Daily Rate (ADR) Trend by Month in Southchase
Get Live Southchase Market Intelligence 👇

Explore Real-time Analytics
Airbnb Seasonality Analysis & Trends in Southchase (2026)
Peak Season (December, March, July)
- Revenue averages $2,056 per month
- Occupancy rates average 57.9%
- Daily rates average $116
Shoulder Season
- Revenue averages $1,643 per month
- Occupancy maintains around 49.0%
- Daily rates hold near $116
Low Season (April, May, October)
- Revenue drops to average $1,516 per month
- Occupancy decreases to average 44.6%
- Daily rates adjust to average $114
Seasonality Insights for Southchase
- The Airbnb seasonality in Southchase shows moderate seasonality with distinct peak and low periods. While the sections above show seasonal averages, it's also insightful to look at the extremes:
- During the high season, the absolute peak month showcases Southchase's highest earning potential, with monthly revenues capable of climbing to $2,158, occupancy reaching a high of 63.1%, and ADRs peaking at $122.
- Conversely, the slowest single month of the year, typically falling within the low season, marks the market's lowest point. In this month, revenue might dip to $1,496, occupancy could drop to 42.0%, and ADRs may adjust down to $109.
- Understanding both the seasonal averages and these monthly peaks and troughs in revenue, occupancy, and ADR is crucial for maximizing your Airbnb profit potential in Southchase.
Seasonal Strategies for Maximizing Profit
- Peak Season: Maximize revenue through premium pricing and potentially longer minimum stays. Ensure high availability.
- Low Season: Offer competitive pricing, special promotions (e.g., extended stay discounts), and flexible cancellation policies. Target off-season travelers like remote workers or budget-conscious guests.
- Shoulder Seasons: Implement dynamic pricing that balances peak and low rates. Target weekend travelers or specific events. Offer slightly more flexible terms than peak season.
- Regularly analyze your own performance against these Southchase seasonality benchmarks and adjust your pricing and availability strategy accordingly.
Best Areas for Airbnb Investment in Southchase (2026)
Exploring the top neighborhoods for short-term rentals in Southchase? This section highlights key areas, outlining why they are attractive for hosts and guests, along with notable local attractions. Consider these locations based on your target guest profile and investment strategy.
| Neighborhood / Area | Why Host Here? (Target Guests & Appeal) | Key Attractions & Landmarks |
|---|---|---|
| Lake Nona | A rapidly growing planned community known for its innovation and health-focused amenities. Attracts families and business travelers due to its proximity to the medical city and various recreational facilities. | Lake Nona Medical City, Boxi Park, Nona Adventure Park, Lake Nona Golf Club, Orlando International Airport |
| Hunters Creek | A family-friendly area with beautiful parks and residential communities. Popular for its accessibility to Orlando attractions and suburban lifestyle. | Hunters Creek Community Park, The Loop Shopping Center, Shingle Creek Regional Park, Local restaurants and cafes |
| Kissimmee | Close to Disney World and other major attractions, making it a popular choice for vacation rentals. Great for families visiting the theme parks. | Walt Disney World, Kissimmee Lakefront Park, Old Town Kissimmee, Universal Studios, Gatorland |
| Bay Hill | An affluent neighborhood known for its luxury homes and golf courses. Ideal for travelers looking for upscale accommodations close to major attractions. | Arnold Palmer's Bay Hill Club & Lodge, Lake Tibet-Butler Preserve, Dining at the Bay Hill Club, Short drive to Universal Studios and Disney |
| South Orlando | Offers a mix of suburban comfort and easy access to Orlando's major attractions. Appeals to families and tourists. | The Mall at Millenia, Orlando International Premium Outlets, SeaWorld Orlando, Orange County Convention Center |
| Windermere | Known for its luxury lakeside properties and top-rated schools. Appeals to affluent families and those seeking a quiet retreat close to urban amenities. | Lake Butler, Windermere Farmers Market, Golf clubs, Nature trails and parks |
| Orlando International Airport area | A strategic location for travelers needing convenient access to the airport. Ideal for short stays and business travelers. | Orlando International Airport, Airport Lakes Park, Dining and shopping near the airport, Proximity to Disney and Universal |
| Pine Hills | An up-and-coming neighborhood with affordable housing and growth potential. Good for investors looking to enter the Airbnb market. | Westside Community Center, Local parks, Cultural festivals, Close to downtown Orlando |
Understanding Airbnb License Requirements & STR Laws in Southchase (2026)
While Southchase, Florida, United States currently shows low STR regulations, specific Airbnb license requirements might still exist or change. Always verify the latest short term rental regulations and Airbnb license requirements directly with local government authorities for Southchase to ensure full compliance before hosting.
(Source: AirROI data, 2026, finding no licensed listings among those analyzed)
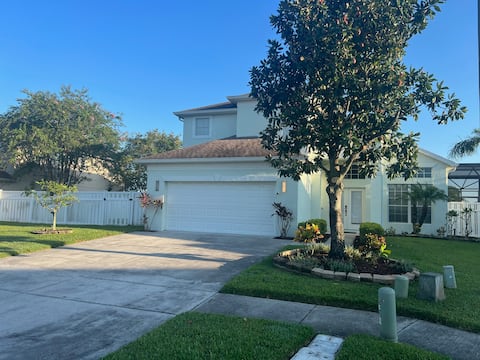
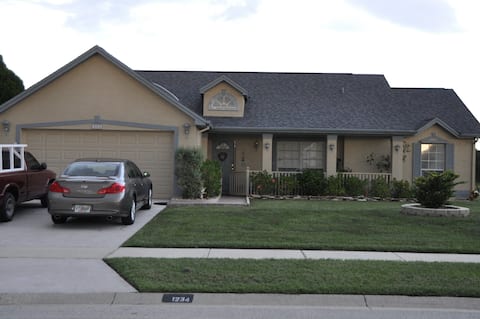
Top Performing Airbnb Properties in Southchase (2026)
Benchmark your potential! Explore examples of top-performing Airbnb properties in Southchasebased on Trailing Twelve Month (TTM) revenue. Analyze their characteristics, revenue, occupancy rate, and ADR to understand what drives success in this market.
Family Residence - 4 Bedr. - near all Attractions
Entire Place • 4 bedrooms
Private Home w/ Pool/3 Bd 2 Bath/Close to Disney
Entire Place • 3 bedrooms
Your home away from home!
Entire Place • 3 bedrooms

Cute & Aesthetic Family Home Orlando close to MCO
Entire Place • 4 bedrooms
Quiet home near all attractions
Private Room • N/A
Bedroom near Airport/Attractions - Queen Bed
Private Room • N/A
Note: Performance varies based on location, size, amenities, seasonality, and management quality. Data reflects the past 12 months.
Top Performing Airbnb Hosts in Southchase (2026)
Learn from the best! This table showcases top-performing Airbnb hosts in Southchase based on the number of properties managed and estimated total revenue over the past year. Analyze their scale and performance metrics.
| Host Name | Properties | Grossing Revenue | Stay Reviews | Avg Rating |
|---|---|---|---|---|
| Thomas | 1 | $76,104 | 48 | 4.94/5.0 |
| Elliott | 1 | $46,430 | 148 | 4.81/5.0 |
| Jeaneth | 1 | $35,999 | 170 | 4.88/5.0 |
| Anahely | 1 | $32,788 | 86 | 4.80/5.0 |
| Armando | 2 | $26,820 | 129 | 4.88/5.0 |
| Eric | 2 | $26,089 | 297 | 4.97/5.0 |
| Sal And Ana | 1 | $13,377 | 122 | 4.96/5.0 |
| Carla Gabriela | 1 | $13,235 | 55 | 4.84/5.0 |
| Juan Carlos | 1 | $11,407 | 40 | 4.80/5.0 |
| Juan | 1 | $10,932 | 159 | 4.85/5.0 |
Analyzing the strategies of top hosts, such as their property selection, pricing, and guest communication, can offer valuable lessons for optimizing your own Airbnb operations in Southchase.
Dive Deeper: Advanced Southchase STR Market Data (2026)
Ready to unlock more insights? AirROI provides access to advanced metrics and comprehensive Airbnb data for Southchase. Explore detailed analytics beyond this report to refine your investment strategy, optimize pricing, and maximize your vacation rental profits.
Explore Advanced MetricsSouthchase Short-Term Rental Market Composition (2026): Property & Room Types
Room Type Distribution
Property Type Distribution
Market Composition Insights for Southchase
- The Southchase Airbnb market composition is heavily skewed towards Entire Home/Apt listings, which make up 60% of the 20 active rentals. This indicates strong guest preference for privacy and space.
- However, a notable 40% share for Private Rooms suggests opportunities for budget-conscious travelers or hosts renting out spare rooms.
- Looking at the property type distribution in Southchase, House properties are the most common (80%), reflecting the local real estate landscape.
- Houses represent a significant 80% portion, catering likely to families or larger groups.
- The presence of 10% Hotel/Boutique listings indicates integration with traditional hospitality.
Southchase Airbnb Room Capacity Analysis (2026): Bedroom Distribution
Distribution of Listings by Number of Bedrooms
Room Capacity Insights for Southchase
- The dominant room capacity in Southchase is 1 bedroom listings, making up 25% of the market. This suggests a strong demand for properties suitable for couples or solo travelers.
- Together, 1 bedroom and 4 bedrooms properties represent 40.0% of the active Airbnb listings in Southchase, indicating a high concentration in these sizes.
- A significant 30.0% of listings offer 3+ bedrooms, catering to larger groups and families seeking more space in Southchase.
Southchase Vacation Rental Guest Capacity Trends (2026)
Distribution of Listings by Guest Capacity
Guest Capacity Insights for Southchase
- The most common guest capacity trend in Southchase vacation rentals is listings accommodating 6 guests (15%). This suggests the primary traveler segment is likely larger groups.
- Properties designed for 6 guests and 8+ guests dominate the Southchase STR market, accounting for 30.0% of listings.
- 30.0% of properties accommodate 6+ guests, serving the market segment for larger families or group travel in Southchase.
- On average, properties in Southchase are equipped to host 3.1 guests.
Southchase Airbnb Booking Patterns (2026): Available vs. Booked Days
Available Days Distribution
Booked Days Distribution
Booking Pattern Insights for Southchase
- The most common availability pattern in Southchase falls within the 271-366 days range, representing 35% of listings. This suggests many properties have significant open periods on their calendars.
- Approximately 65.0% of listings show high availability (181+ days open annually), indicating potential for increased bookings or specific owner usage patterns.
- For booked days, the 91-180 days range is most frequent in Southchase (30%), reflecting common guest stay durations or potential owner blocking patterns.
- A notable 35.0% of properties secure long booking periods (181+ days booked per year), highlighting successful long-term rental strategies or significant owner usage.
Southchase Airbnb Minimum Stay Requirements Analysis
Distribution of Listings by Minimum Night Requirement
1 Night
9 listings
45% of total
2 Nights
4 listings
20% of total
3 Nights
2 listings
10% of total
7-29 Nights
1 listings
5% of total
30+ Nights
4 listings
20% of total
Key Insights
- The most prevalent minimum stay requirement in Southchase is 1 Night, adopted by 45% of listings. This highlights the market's preference for shorter, flexible bookings.
- A strong majority (65.0%) of the Southchase Airbnb data shows acceptance of very short stays (1-2 nights), indicating a dynamic, high-turnover market.
- A significant segment (20%) caters to monthly stays (30+ nights) in Southchase, pointing to opportunities in the extended-stay market.
Recommendations
- Align with the market by considering a 1 Night minimum stay, as 45% of Southchase hosts use this setting.
- Explore offering discounts for stays of 30+ nights to attract the 20% of the market seeking extended stays.
- Adjust minimum nights based on seasonality – potentially shorter during low season and longer during peak demand periods in Southchase.
Southchase Airbnb Cancellation Policy Trends Analysis (2026)
Super Strict 30 Days
1 listings
5% of total
Flexible
8 listings
40% of total
Moderate
3 listings
15% of total
Firm
6 listings
30% of total
Strict
2 listings
10% of total
Cancellation Policy Insights for Southchase
- The prevailing Airbnb cancellation policy trend in Southchase is Flexible, used by 40% of listings.
- There's a relatively balanced mix between guest-friendly (55.0%) and stricter (40.0%) policies, offering choices for different guest needs.
Recommendations for Hosts
- Consider adopting a Flexible policy to align with the 40% market standard in Southchase.
- Using a Strict policy might deter some guests, as only 10% of listings use it. Evaluate if potential revenue protection outweighs possible lower booking rates.
- Regularly review your cancellation policy against competitors and market demand shifts in Southchase.
Southchase STR Booking Lead Time Analysis (2026)
Average Booking Lead Time by Month
Booking Lead Time Insights for Southchase
- The overall average booking lead time for vacation rentals in Southchase is 40 days.
- Guests book furthest in advance for stays during November (average 63 days), likely coinciding with peak travel demand or local events.
- The shortest booking windows occur for stays in March (average 30 days), indicating more last-minute travel plans during this time.
- Seasonally, Winter (43 days avg.) sees the longest lead times, while Spring (31 days avg.) has the shortest, reflecting typical travel planning cycles.
Recommendations for Hosts
- Use the overall average lead time (40 days) as a baseline for your pricing and availability strategy in Southchase.
- For November stays, consider implementing length-of-stay discounts or slightly higher rates for bookings made less than 63 days out to capitalize on advance planning.
- Target marketing efforts for the Winter season well in advance (at least 43 days) to capture early planners.
- Monitor your own booking lead times against these Southchase averages to identify opportunities for dynamic pricing adjustments.
Popular & Essential Airbnb Amenities in Southchase (2026)
Amenity Prevalence
Amenity Insights for Southchase
- Essential amenities in Southchase that guests expect include: TV, Wifi, Free parking on premises, Air conditioning, Iron. Lacking these (any) could significantly impact bookings.
- Popular amenities like Smoke alarm, Hangers, Essentials are common but not universal. Offering these can provide a competitive edge.
Recommendations for Hosts
- Ensure your listing includes all essential amenities for Southchase: TV, Wifi, Free parking on premises, Air conditioning, Iron.
- Prioritize adding missing essentials: Iron.
- Consider adding popular differentiators like Smoke alarm or Hangers to increase appeal.
- Highlight unique or less common amenities you offer (e.g., hot tub, dedicated workspace, EV charger) in your listing description and photos.
- Regularly check competitor amenities in Southchase to stay competitive.
Southchase Airbnb Guest Demographics & Profile Analysis (2026)
Guest Profile Summary for Southchase
- The typical guest profile for Airbnb in Southchase consists of primarily domestic travelers (79%), often arriving from nearby Saint Cloud, typically belonging to the Post-2000s (Gen Z/Alpha) group (50%), primarily speaking English or Spanish.
- Domestic travelers account for 79.3% of guests.
- Key international markets include United States (79.3%) and Canada (2.8%).
- Top languages spoken are English (55.3%) followed by Spanish (25.5%).
- A significant demographic segment is the Post-2000s (Gen Z/Alpha) group, representing 50% of guests.
Recommendations for Hosts
- Target domestic marketing efforts towards travelers from Saint Cloud and Fort Lauderdale.
- Tailor amenities and listing descriptions to appeal to the dominant Post-2000s (Gen Z/Alpha) demographic (e.g., highlight fast WiFi, smart home features, local guides).
- Highlight unique local experiences or amenities relevant to the primary guest profile.
- Consider seasonal promotions aligned with peak travel times for key origin markets.
Nearby Short-Term Rental Market Comparison
How does the Southchase Airbnb market stack up against its neighbors? Compare key performance metrics like average monthly revenue, ADR, and occupancy rates in surrounding areas to understand the broader regional STR landscape.
| Market | Active Properties | Monthly Revenue | Daily Rate | Avg. Occupancy |
|---|---|---|---|---|
| Sailfish Point | 19 | $16,709 | $1587.63 | 48% |
| Anna Maria island | 587 | $7,996 | $823.96 | 41% |
| Anna Maria | 56 | $6,434 | $692.96 | 52% |
| Reunion | 12 | $6,321 | $580.45 | 44% |
| Vilano Beach | 173 | $5,571 | $442.95 | 45% |
| Indian Rocks Beach | 842 | $5,560 | $419.63 | 49% |
| Melbourne Beach | 275 | $5,384 | $488.83 | 43% |
| Siesta Key | 1,175 | $5,206 | $518.91 | 42% |
| Belleair Beach | 94 | $5,086 | $339.65 | 53% |
| Bradenton Beach | 122 | $4,977 | $507.12 | 42% |