South Daytona Airbnb Market Analysis 2026: Short Term Rental Data & Vacation Rental Statistics in Florida, United States
Is Airbnb profitable in South Daytona in 2026? Explore comprehensive Airbnb analytics for South Daytona, Florida, United States to uncover income potential. This 2026 STR market report for South Daytona, based on AirROI data from February 2025 to January 2026, reveals key trends in the niche market of 63 active listings.
Whether you're considering an Airbnb investment in South Daytona, optimizing your existing vacation rental, or exploring rental arbitrage opportunities, understanding the South Daytona Airbnb data is crucial. Leveraging the low regulation environment is key to maximizing your short term rental income potential. Let's dive into the specifics.
Key South Daytona Airbnb Performance Metrics Overview
Monthly Airbnb Revenue Variations & Income Potential in South Daytona (2026)
Understanding the monthly revenue variations for Airbnb listings in South Daytona is key to maximizing your short term rental income potential. Seasonality significantly impacts earnings. Our analysis, based on data from the past 12 months, shows that the peak revenue month for STRs in South Daytona is typically March, while September often presents the lowest earnings, highlighting opportunities for strategic pricing adjustments during shoulder and low seasons. Explore the typical Airbnb income in South Daytona across different performance tiers:
- Best-in-class properties (Top 10%) achieve $6,892+ monthly, often utilizing dynamic pricing and superior guest experiences.
- Strong performing properties (Top 25%) earn $4,874 or more, indicating effective management and desirable locations/amenities.
- Typical properties (Median) generate around $3,146 per month, representing the average market performance.
- Entry-level properties (Bottom 25%) see earnings around $1,484, often with potential for optimization.
Average Monthly Airbnb Earnings Trend in South Daytona
South Daytona Airbnb Occupancy Rate Trends (2026)
Maximize your bookings by understanding the South Daytona STR occupancy trends. Seasonal demand shifts significantly influence how often properties are booked. Typically, Marchsees the highest demand (peak season occupancy), while September experiences the lowest (low season). Effective strategies, like adjusting minimum stays or offering promotions, can boost occupancy during slower periods. Here's how different property tiers perform in South Daytona:
- Best-in-class properties (Top 10%) achieve 81%+ occupancy, indicating high desirability and potentially optimized availability.
- Strong performing properties (Top 25%) maintain 64% or higher occupancy, suggesting good market fit and guest satisfaction.
- Typical properties (Median) have an occupancy rate around 45%.
- Entry-level properties (Bottom 25%) average 26% occupancy, potentially facing higher vacancy.
Average Monthly Occupancy Rate Trend in South Daytona
Average Daily Rate (ADR) Airbnb Trends in South Daytona (2026)
Effective short term rental pricing strategy in South Daytona involves understanding monthly ADR fluctuations. The Average Daily Rate (ADR) for Airbnb in South Daytona typically peaks in March and dips lowest during September. Leveraging Airbnb dynamic pricing tools or strategies based on this seasonality can significantly boost revenue. Here's a look at the typical nightly rates achieved:
- Best-in-class properties (Top 10%) command rates of $383+ per night, often due to premium features or locations.
- Strong performing properties (Top 25%) achieve nightly rates of $311 or more.
- Typical properties (Median) charge around $220 per night.
- Entry-level properties (Bottom 25%) earn around $153 per night.
Average Daily Rate (ADR) Trend by Month in South Daytona
Get Live South Daytona Market Intelligence 👇

Explore Real-time Analytics
Airbnb Seasonality Analysis & Trends in South Daytona (2026)
Peak Season (March, July, April)
- Revenue averages $4,502 per month
- Occupancy rates average 55.0%
- Daily rates average $259
Shoulder Season
- Revenue averages $3,575 per month
- Occupancy maintains around 45.1%
- Daily rates hold near $255
Low Season (September, October, November)
- Revenue drops to average $2,924 per month
- Occupancy decreases to average 39.7%
- Daily rates adjust to average $244
Seasonality Insights for South Daytona
- The Airbnb seasonality in South Daytona shows moderate seasonality with distinct peak and low periods. While the sections above show seasonal averages, it's also insightful to look at the extremes:
- During the high season, the absolute peak month showcases South Daytona's highest earning potential, with monthly revenues capable of climbing to $5,084, occupancy reaching a high of 58.6%, and ADRs peaking at $270.
- Conversely, the slowest single month of the year, typically falling within the low season, marks the market's lowest point. In this month, revenue might dip to $2,692, occupancy could drop to 39.1%, and ADRs may adjust down to $238.
- Understanding both the seasonal averages and these monthly peaks and troughs in revenue, occupancy, and ADR is crucial for maximizing your Airbnb profit potential in South Daytona.
Seasonal Strategies for Maximizing Profit
- Peak Season: Maximize revenue through premium pricing and potentially longer minimum stays. Ensure high availability.
- Low Season: Offer competitive pricing, special promotions (e.g., extended stay discounts), and flexible cancellation policies. Target off-season travelers like remote workers or budget-conscious guests.
- Shoulder Seasons: Implement dynamic pricing that balances peak and low rates. Target weekend travelers or specific events. Offer slightly more flexible terms than peak season.
- Regularly analyze your own performance against these South Daytona seasonality benchmarks and adjust your pricing and availability strategy accordingly.
Best Areas for Airbnb Investment in South Daytona (2026)
Exploring the top neighborhoods for short-term rentals in South Daytona? This section highlights key areas, outlining why they are attractive for hosts and guests, along with notable local attractions. Consider these locations based on your target guest profile and investment strategy.
| Neighborhood / Area | Why Host Here? (Target Guests & Appeal) | Key Attractions & Landmarks |
|---|---|---|
| Daytona Beach Shores | Popular for its beautiful beaches and relaxed atmosphere, Daytona Beach Shores attracts visitors looking for a quiet beach retreat. Close proximity to Daytona Beach enhances its appeal. | Daytona Beach Shores, Beachfront parks, Water sports activities, Sunset views |
| Ormond Beach | Known for its historic charm and beautiful parks, Ormond Beach is ideal for families and tourists who appreciate nature and history. Offers a quieter alternative to Daytona Beach. | John D. Rockefeller Estate, Tomoka State Park, Ormond Memorial Art Museum, The Casements |
| Ponce Inlet | A serene and picturesque coastal town with stunning views and a historic lighthouse. Perfect for guests seeking a peaceful retreat away from the hustle and bustle. | Ponce de Leon Inlet Lighthouse, Marine Science Center, Ponce Inlet Beach, Dining with ocean views |
| Central Daytona | Offers a mix of urban and beach lifestyles, with easy access to amenities, entertainment, and major attractions. Popular with both tourists and business travelers. | Daytona International Speedway, Main Street Boardwalk, Museum of Arts and Sciences |
| South Daytona | A quieter area with residential charm, South Daytona provides easy access to both the beach and local amenities, making it attractive for longer stays. | Cypress Park, Local dining options, Proximity to Daytona Beach |
| Wilbur-by-the-Sea | A small beach community with a cozy atmosphere. Ideal for guests looking for a peaceful vacation experience by the water. | Wilbur Beach, Family-friendly environment, Oceanfront dining options |
| New Smyrna Beach | Known for its charming downtown and beautiful beaches. Great for guests interested in a more laid-back beach experience with local boutiques and cafes. | New Smyrna Beach, Canal Street Historic District, Flagler Avenue |
| Tomoka State Park | Offers an outdoor experience with trails and waterways. Attractive to nature lovers and those interested in outdoor activities. | Exploring nature trails, Kayaking and fishing, Wildlife viewing |
Understanding Airbnb License Requirements & STR Laws in South Daytona (2026)
While South Daytona, Florida, United States currently shows low STR regulations, specific Airbnb license requirements might still exist or change. Always verify the latest short term rental regulations and Airbnb license requirements directly with local government authorities for South Daytona to ensure full compliance before hosting.
(Source: AirROI data, 2026, finding no licensed listings among those analyzed)
Top Performing Airbnb Properties in South Daytona (2026)
Benchmark your potential! Explore examples of top-performing Airbnb properties in South Daytonabased on Trailing Twelve Month (TTM) revenue. Analyze their characteristics, revenue, occupancy rate, and ADR to understand what drives success in this market.
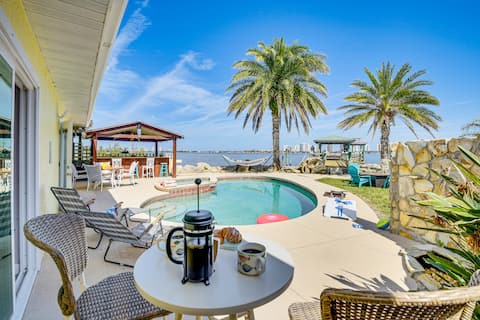
Pool + Game Room: Riverfront Daytona Escape!
Entire Place • 6 bedrooms
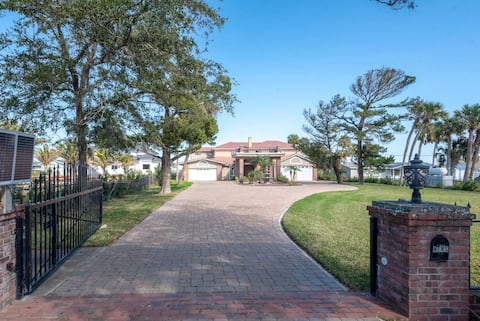
One of a Kind, two story, gated Halifax Riverfront
Entire Place • 5 bedrooms
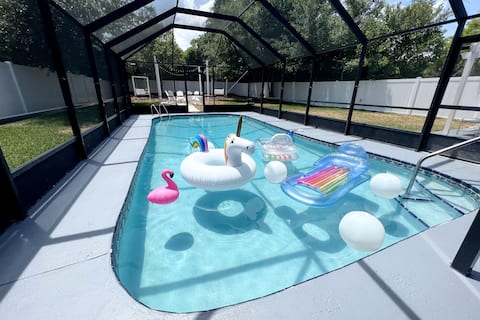
Heated Pool house 4 miles away from the beach
Entire Place • 4 bedrooms
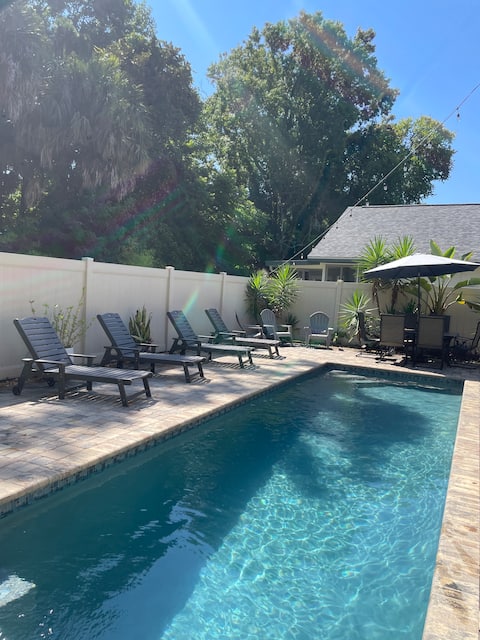
Beautiful Family Pool Home
Entire Place • 4 bedrooms
POOL/7 ml Beach&track/sleeps 9/trailer parking
Entire Place • 3 bedrooms

Large lighted Pool, 8 min to beach, huge backyard
Entire Place • 3 bedrooms
Note: Performance varies based on location, size, amenities, seasonality, and management quality. Data reflects the past 12 months.
Top Performing Airbnb Hosts in South Daytona (2026)
Learn from the best! This table showcases top-performing Airbnb hosts in South Daytona based on the number of properties managed and estimated total revenue over the past year. Analyze their scale and performance metrics.
| Host Name | Properties | Grossing Revenue | Stay Reviews | Avg Rating |
|---|---|---|---|---|
| Evolve | 4 | $322,605 | 89 | 4.55/5.0 |
| Kyle | 3 | $149,873 | 306 | 4.78/5.0 |
| Cossett | 1 | $107,966 | 17 | 4.00/5.0 |
| Kimberly Michele | 4 | $106,151 | 117 | 4.95/5.0 |
| Solace | 1 | $101,593 | 120 | 4.88/5.0 |
| Shanika | 3 | $101,241 | 68 | 4.55/5.0 |
| Angela | 1 | $71,575 | 84 | 4.95/5.0 |
| Jose | 1 | $63,543 | 93 | 4.98/5.0 |
| Gwendolyn | 1 | $61,789 | 25 | 5.00/5.0 |
| Steffanie | 1 | $60,955 | 34 | 4.97/5.0 |
Analyzing the strategies of top hosts, such as their property selection, pricing, and guest communication, can offer valuable lessons for optimizing your own Airbnb operations in South Daytona.
Dive Deeper: Advanced South Daytona STR Market Data (2026)
Ready to unlock more insights? AirROI provides access to advanced metrics and comprehensive Airbnb data for South Daytona. Explore detailed analytics beyond this report to refine your investment strategy, optimize pricing, and maximize your vacation rental profits.
Explore Advanced MetricsSouth Daytona Short-Term Rental Market Composition (2026): Property & Room Types
Room Type Distribution
Property Type Distribution
Market Composition Insights for South Daytona
- The South Daytona Airbnb market composition is heavily skewed towards Entire Home/Apt listings, which make up 93.7% of the 63 active rentals. This indicates strong guest preference for privacy and space.
- Looking at the property type distribution in South Daytona, House properties are the most common (85.7%), reflecting the local real estate landscape.
- Houses represent a significant 85.7% portion, catering likely to families or larger groups.
- Smaller segments like others, outdoor/unique (combined 4.8%) offer potential for unique stay experiences.
South Daytona Airbnb Room Capacity Analysis (2026): Bedroom Distribution
Distribution of Listings by Number of Bedrooms
Room Capacity Insights for South Daytona
- The dominant room capacity in South Daytona is 3 bedrooms listings, making up 49.2% of the market. This suggests a strong demand for properties suitable for families or small groups.
- Together, 3 bedrooms and 2 bedrooms properties represent 69.8% of the active Airbnb listings in South Daytona, indicating a high concentration in these sizes.
- A significant 63.5% of listings offer 3+ bedrooms, catering to larger groups and families seeking more space in South Daytona.
South Daytona Vacation Rental Guest Capacity Trends (2026)
Distribution of Listings by Guest Capacity
Guest Capacity Insights for South Daytona
- The most common guest capacity trend in South Daytona vacation rentals is listings accommodating 8+ guests (34.9%). This suggests the primary traveler segment is likely larger groups.
- Properties designed for 8+ guests and 6 guests dominate the South Daytona STR market, accounting for 66.6% of listings.
- 72.9% of properties accommodate 6+ guests, serving the market segment for larger families or group travel in South Daytona.
- On average, properties in South Daytona are equipped to host 5.8 guests.
South Daytona Airbnb Booking Patterns (2026): Available vs. Booked Days
Available Days Distribution
Booked Days Distribution
Booking Pattern Insights for South Daytona
- The most common availability pattern in South Daytona falls within the 181-270 days range, representing 36.5% of listings. This suggests many properties have significant open periods on their calendars.
- Approximately 69.8% of listings show high availability (181+ days open annually), indicating potential for increased bookings or specific owner usage patterns.
- For booked days, the 91-180 days range is most frequent in South Daytona (36.5%), reflecting common guest stay durations or potential owner blocking patterns.
- A notable 31.8% of properties secure long booking periods (181+ days booked per year), highlighting successful long-term rental strategies or significant owner usage.
South Daytona Airbnb Minimum Stay Requirements Analysis
Distribution of Listings by Minimum Night Requirement
1 Night
11 listings
17.5% of total
2 Nights
11 listings
17.5% of total
3 Nights
11 listings
17.5% of total
4-6 Nights
2 listings
3.2% of total
7-29 Nights
3 listings
4.8% of total
30+ Nights
25 listings
39.7% of total
Key Insights
- The most prevalent minimum stay requirement in South Daytona is 30+ Nights, adopted by 39.7% of listings. This highlights the market's preference for longer commitments.
- A significant segment (39.7%) caters to monthly stays (30+ nights) in South Daytona, pointing to opportunities in the extended-stay market.
Recommendations
- Align with the market by considering a 30+ Nights minimum stay, as 39.7% of South Daytona hosts use this setting.
- If feasible, allowing 1-night stays, especially midweek or during low season, could capture last-minute bookings, as only 17.5% currently do.
- Explore offering discounts for stays of 30+ nights to attract the 39.7% of the market seeking extended stays.
- Adjust minimum nights based on seasonality – potentially shorter during low season and longer during peak demand periods in South Daytona.
South Daytona Airbnb Cancellation Policy Trends Analysis (2026)
Limited
1 listings
1.6% of total
Flexible
14 listings
22.2% of total
Moderate
15 listings
23.8% of total
Firm
21 listings
33.3% of total
Strict
12 listings
19% of total
Cancellation Policy Insights for South Daytona
- The prevailing Airbnb cancellation policy trend in South Daytona is Firm, used by 33.3% of listings.
- A majority (52.3%) of hosts in South Daytona utilize Firm or Strict policies, indicating a market where hosts prioritize booking security.
Recommendations for Hosts
- Consider adopting a Firm policy to align with the 33.3% market standard in South Daytona.
- Regularly review your cancellation policy against competitors and market demand shifts in South Daytona.
South Daytona STR Booking Lead Time Analysis (2026)
Average Booking Lead Time by Month
Booking Lead Time Insights for South Daytona
- The overall average booking lead time for vacation rentals in South Daytona is 62 days.
- Guests book furthest in advance for stays during May (average 96 days), likely coinciding with peak travel demand or local events.
- The shortest booking windows occur for stays in September (average 28 days), indicating more last-minute travel plans during this time.
- Seasonally, Spring (83 days avg.) sees the longest lead times, while Summer (44 days avg.) has the shortest, reflecting typical travel planning cycles.
Recommendations for Hosts
- Use the overall average lead time (62 days) as a baseline for your pricing and availability strategy in South Daytona.
- For May stays, consider implementing length-of-stay discounts or slightly higher rates for bookings made less than 96 days out to capitalize on advance planning.
- Target marketing efforts for the Spring season well in advance (at least 83 days) to capture early planners.
- Monitor your own booking lead times against these South Daytona averages to identify opportunities for dynamic pricing adjustments.
Popular & Essential Airbnb Amenities in South Daytona (2026)
Amenity Prevalence
Amenity Insights for South Daytona
- Essential amenities in South Daytona that guests expect include: Free parking on premises, Air conditioning, TV, Wifi, Smoke alarm. Lacking these (any) could significantly impact bookings.
- Popular amenities like Heating, Kitchen, Refrigerator are common but not universal. Offering these can provide a competitive edge.
Recommendations for Hosts
- Ensure your listing includes all essential amenities for South Daytona: Free parking on premises, Air conditioning, TV, Wifi, Smoke alarm.
- Prioritize adding missing essentials: TV, Wifi, Smoke alarm.
- Consider adding popular differentiators like Heating or Kitchen to increase appeal.
- Highlight unique or less common amenities you offer (e.g., hot tub, dedicated workspace, EV charger) in your listing description and photos.
- Regularly check competitor amenities in South Daytona to stay competitive.
South Daytona Airbnb Guest Demographics & Profile Analysis (2026)
Guest Profile Summary for South Daytona
- The typical guest profile for Airbnb in South Daytona consists of primarily domestic travelers (96%), often arriving from nearby Atlanta, typically belonging to the Post-2000s (Gen Z/Alpha) group (50%), primarily speaking English or Spanish.
- Domestic travelers account for 95.9% of guests.
- Key international markets include United States (95.9%) and Canada (1.4%).
- Top languages spoken are English (73.5%) followed by Spanish (13.4%).
- A significant demographic segment is the Post-2000s (Gen Z/Alpha) group, representing 50% of guests.
Recommendations for Hosts
- Target domestic marketing efforts towards travelers from Atlanta and Orlando.
- Tailor amenities and listing descriptions to appeal to the dominant Post-2000s (Gen Z/Alpha) demographic (e.g., highlight fast WiFi, smart home features, local guides).
- Highlight unique local experiences or amenities relevant to the primary guest profile.
- Consider seasonal promotions aligned with peak travel times for key origin markets.
Nearby Short-Term Rental Market Comparison
How does the South Daytona Airbnb market stack up against its neighbors? Compare key performance metrics like average monthly revenue, ADR, and occupancy rates in surrounding areas to understand the broader regional STR landscape.
| Market | Active Properties | Monthly Revenue | Daily Rate | Avg. Occupancy |
|---|---|---|---|---|
| St. Johns County | 12 | $6,964 | $592.43 | 47% |
| Reunion | 12 | $6,321 | $580.45 | 44% |
| Ponte Vedra Beach | 224 | $5,720 | $574.75 | 43% |
| Vilano Beach | 173 | $5,571 | $442.95 | 45% |
| Melbourne Beach | 275 | $5,384 | $488.83 | 43% |
| Thonotosassa | 17 | $4,309 | $347.75 | 50% |
| Jacksonville Beach | 763 | $4,123 | $328.32 | 49% |
| Campbell | 22 | $4,011 | $343.05 | 51% |
| Indian Harbour Beach | 131 | $3,895 | $289.71 | 50% |
| Cocoa Beach | 983 | $3,883 | $307.17 | 48% |