South Bradenton Airbnb Market Analysis 2026: Short Term Rental Data & Vacation Rental Statistics in Florida, United States
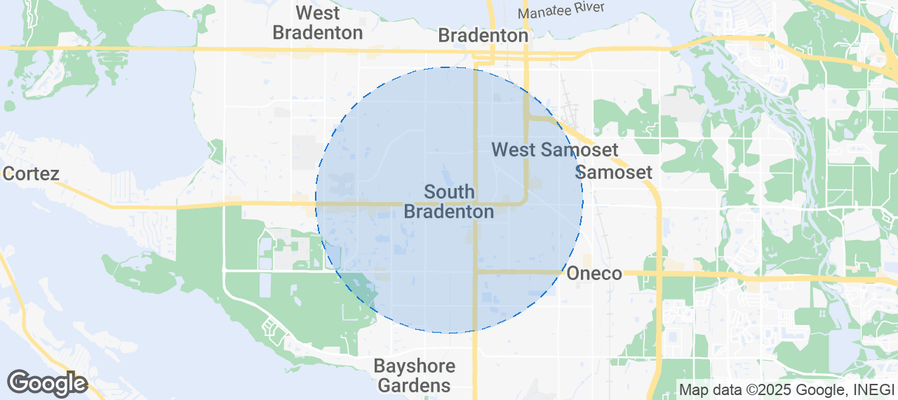
Is Airbnb profitable in South Bradenton in 2026? Explore comprehensive Airbnb analytics for South Bradenton, Florida, United States to uncover income potential. This 2026 STR market report for South Bradenton, based on AirROI data from February 2025 to January 2026, reveals key trends in the niche market of 136 active listings.
Whether you're considering an Airbnb investment in South Bradenton, optimizing your existing vacation rental, or exploring rental arbitrage opportunities, understanding the South Bradenton Airbnb data is crucial. Leveraging the low regulation environment is key to maximizing your short term rental income potential. Let's dive into the specifics.
Key South Bradenton Airbnb Performance Metrics Overview
Monthly Airbnb Revenue Variations & Income Potential in South Bradenton (2026)
Understanding the monthly revenue variations for Airbnb listings in South Bradenton is key to maximizing your short term rental income potential. Seasonality significantly impacts earnings. Our analysis, based on data from the past 12 months, shows that the peak revenue month for STRs in South Bradenton is typically March, while September often presents the lowest earnings, highlighting opportunities for strategic pricing adjustments during shoulder and low seasons. Explore the typical Airbnb income in South Bradenton across different performance tiers:
- Best-in-class properties (Top 10%) achieve $6,594+ monthly, often utilizing dynamic pricing and superior guest experiences.
- Strong performing properties (Top 25%) earn $3,960 or more, indicating effective management and desirable locations/amenities.
- Typical properties (Median) generate around $2,416 per month, representing the average market performance.
- Entry-level properties (Bottom 25%) see earnings around $1,307, often with potential for optimization.
Average Monthly Airbnb Earnings Trend in South Bradenton
South Bradenton Airbnb Occupancy Rate Trends (2026)
Maximize your bookings by understanding the South Bradenton STR occupancy trends. Seasonal demand shifts significantly influence how often properties are booked. Typically, Marchsees the highest demand (peak season occupancy), while September experiences the lowest (low season). Effective strategies, like adjusting minimum stays or offering promotions, can boost occupancy during slower periods. Here's how different property tiers perform in South Bradenton:
- Best-in-class properties (Top 10%) achieve 84%+ occupancy, indicating high desirability and potentially optimized availability.
- Strong performing properties (Top 25%) maintain 67% or higher occupancy, suggesting good market fit and guest satisfaction.
- Typical properties (Median) have an occupancy rate around 48%.
- Entry-level properties (Bottom 25%) average 29% occupancy, potentially facing higher vacancy.
Average Monthly Occupancy Rate Trend in South Bradenton
Average Daily Rate (ADR) Airbnb Trends in South Bradenton (2026)
Effective short term rental pricing strategy in South Bradenton involves understanding monthly ADR fluctuations. The Average Daily Rate (ADR) for Airbnb in South Bradenton typically peaks in January and dips lowest during May. Leveraging Airbnb dynamic pricing tools or strategies based on this seasonality can significantly boost revenue. Here's a look at the typical nightly rates achieved:
- Best-in-class properties (Top 10%) command rates of $321+ per night, often due to premium features or locations.
- Strong performing properties (Top 25%) achieve nightly rates of $222 or more.
- Typical properties (Median) charge around $162 per night.
- Entry-level properties (Bottom 25%) earn around $115 per night.
Average Daily Rate (ADR) Trend by Month in South Bradenton
Get Live South Bradenton Market Intelligence 👇
Explore Real-time Analytics
Airbnb Seasonality Analysis & Trends in South Bradenton (2026)
Peak Season (March, February, January)
- Revenue averages $4,721 per month
- Occupancy rates average 65.2%
- Daily rates average $230
Shoulder Season
- Revenue averages $3,119 per month
- Occupancy maintains around 47.1%
- Daily rates hold near $196
Low Season (August, September, October)
- Revenue drops to average $2,163 per month
- Occupancy decreases to average 35.4%
- Daily rates adjust to average $186
Seasonality Insights for South Bradenton
- The Airbnb seasonality in South Bradenton shows highly seasonal trends requiring careful strategy. While the sections above show seasonal averages, it's also insightful to look at the extremes:
- During the high season, the absolute peak month showcases South Bradenton's highest earning potential, with monthly revenues capable of climbing to $5,604, occupancy reaching a high of 78.0%, and ADRs peaking at $241.
- Conversely, the slowest single month of the year, typically falling within the low season, marks the market's lowest point. In this month, revenue might dip to $1,528, occupancy could drop to 28.0%, and ADRs may adjust down to $179.
- Understanding both the seasonal averages and these monthly peaks and troughs in revenue, occupancy, and ADR is crucial for maximizing your Airbnb profit potential in South Bradenton.
Seasonal Strategies for Maximizing Profit
- Peak Season: Maximize revenue through premium pricing and potentially longer minimum stays. Ensure high availability.
- Low Season: Offer competitive pricing, special promotions (e.g., extended stay discounts), and flexible cancellation policies. Target off-season travelers like remote workers or budget-conscious guests.
- Shoulder Seasons: Implement dynamic pricing that balances peak and low rates. Target weekend travelers or specific events. Offer slightly more flexible terms than peak season.
- Regularly analyze your own performance against these South Bradenton seasonality benchmarks and adjust your pricing and availability strategy accordingly.
Best Areas for Airbnb Investment in South Bradenton (2026)
Exploring the top neighborhoods for short-term rentals in South Bradenton? This section highlights key areas, outlining why they are attractive for hosts and guests, along with notable local attractions. Consider these locations based on your target guest profile and investment strategy.
| Neighborhood / Area | Why Host Here? (Target Guests & Appeal) | Key Attractions & Landmarks |
|---|---|---|
| Bradenton Beach | Charming beach town known for its beautiful sandy shores and relaxed atmosphere. Perfect for vacationers looking to enjoy the beach, water sports, and local seafood dining. | Coquina Beach, Bridge Street, Bradenton Beach Marina, Historic Bridge Street Pier, Tampa Bay Watch |
| Lakewood Ranch | Planned community with a mix of residential and commercial spaces. Offers family-friendly amenities and is popular among longer-term visitors and snowbirds. | Lakewood Ranch Main Street, The Lakewood Ranch Movie Theatre, Benderson Park, Myakka River State Park, The Mall at University Town Center |
| Palma Sola | Residential area near the beach, offering a quieter atmosphere. Ideal for families and individuals looking for a peaceful retreat while being close to local attractions. | Palma Sola Causeway Park, Desoto National Memorial, Perico Nature Park, Robinson Preserve, Manatee Public Beach |
| Anna Maria Island | Famous for its stunning beaches and laid-back vibe. A great spot for tourists looking to escape and enjoy nature, making it a prime location for vacation rentals. | Bean Point Beach, Anna Maria Island Historical Museum, Tampa Bay Beaches, Rod and Reel Pier, Holmes Beach |
| Braden River | Growing area with access to the Braden River, lakes, and parks. Attracts visitors looking for outdoor activities and a serene environment. | Braden River Park, State Road 64 Recreation Center, Duette Preserve, Myakka River State Park, Mixon Fruit Farms |
| Sarasota | Nearby city known for its vibrant arts scene and beautiful beaches, appealing to a wide range of visitors, from culture seekers to beach lovers. | Ringling Museum of Art, Siesta Key Beach, St. Armands Circle, Marie Selby Botanical Gardens, Sarasota Bay |
| Longboat Key | Exclusive coastal town known for luxury homes and secluded beaches. Attracts high-end tourists and long-term renters, making it lucrative for Airbnb hosting. | Longboat Key Beach, Joan M. Durante Park, Default Beach, Beachside Paradise, Longboat Key Club |
| Ellenton | Located close to shopping outlets and natural parks, considered a convenient base for travelers visiting the greater Sarasota-Bradenton area. | Ellenton Premium Outlets, Ruthven Park, Manatee River, Mixon Fruit Farms, Red Barn Flea Market |
Understanding Airbnb License Requirements & STR Laws in South Bradenton (2026)
While South Bradenton, Florida, United States currently shows low STR regulations, specific Airbnb license requirements might still exist or change. Always verify the latest short term rental regulations and Airbnb license requirements directly with local government authorities for South Bradenton to ensure full compliance before hosting.
(Source: AirROI data, 2026, finding no licensed listings among those analyzed)
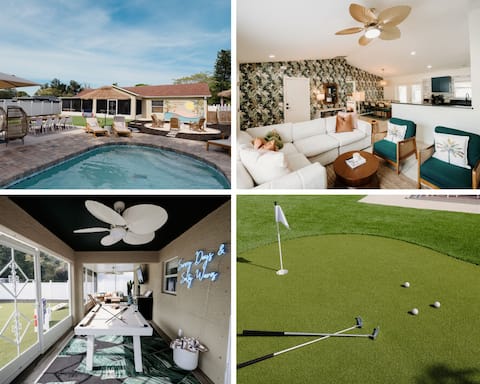
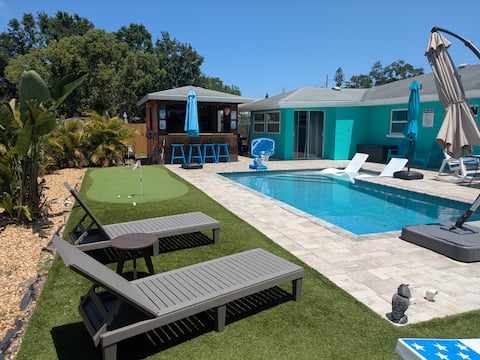
Top Performing Airbnb Properties in South Bradenton (2026)
Benchmark your potential! Explore examples of top-performing Airbnb properties in South Bradentonbased on Trailing Twelve Month (TTM) revenue. Analyze their characteristics, revenue, occupancy rate, and ADR to understand what drives success in this market.

Heated Pool & Spa • Outdoor Kitchen/Theater/Games
Entire Place • 6 bedrooms
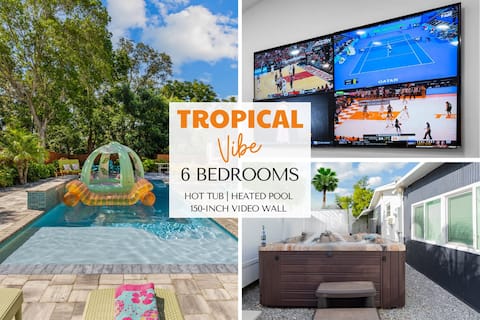
Tropical Vibe 6BR Sleeps 21 Heated Pool Hot Tub
Entire Place • 6 bedrooms

Stylish 6 Bed Pool Home with Golf Simulator & Spa
Entire Place • 6 bedrooms

Pickleball, Axe Throwing, Mini-Golf, Bowling, IMG
Entire Place • 3 bedrooms
Heatd Pool + PuttPutt + Close2IMG + Tropical Oasis
Entire Place • 3 bedrooms
Backyard Oasis, Heated Pool Tiki Bar Near IMG
Entire Place • 4 bedrooms
Note: Performance varies based on location, size, amenities, seasonality, and management quality. Data reflects the past 12 months.
Top Performing Airbnb Hosts in South Bradenton (2026)
Learn from the best! This table showcases top-performing Airbnb hosts in South Bradenton based on the number of properties managed and estimated total revenue over the past year. Analyze their scale and performance metrics.
| Host Name | Properties | Grossing Revenue | Stay Reviews | Avg Rating |
|---|---|---|---|---|
| Anthony | 2 | $232,225 | 42 | 4.98/5.0 |
| Luxury Host | 1 | $224,461 | 45 | 4.78/5.0 |
| Locals Property | 8 | $219,471 | 599 | 4.87/5.0 |
| Evolve | 6 | $203,517 | 220 | 4.84/5.0 |
| Chris | 1 | $151,386 | 88 | 4.83/5.0 |
| Christina And John | 1 | $148,413 | 56 | 5.00/5.0 |
| Evan | 1 | $100,512 | 118 | 4.97/5.0 |
| Michael | 1 | $86,895 | 233 | 4.84/5.0 |
| The Florida Nest | 1 | $70,306 | 14 | 5.00/5.0 |
| Nayvi | 1 | $66,770 | 59 | 4.92/5.0 |
Analyzing the strategies of top hosts, such as their property selection, pricing, and guest communication, can offer valuable lessons for optimizing your own Airbnb operations in South Bradenton.
Dive Deeper: Advanced South Bradenton STR Market Data (2026)
Ready to unlock more insights? AirROI provides access to advanced metrics and comprehensive Airbnb data for South Bradenton. Explore detailed analytics beyond this report to refine your investment strategy, optimize pricing, and maximize your vacation rental profits.
Explore Advanced MetricsSouth Bradenton Short-Term Rental Market Composition (2026): Property & Room Types
Room Type Distribution
Property Type Distribution
Market Composition Insights for South Bradenton
- The South Bradenton Airbnb market composition is heavily skewed towards Entire Home/Apt listings, which make up 89.7% of the 136 active rentals. This indicates strong guest preference for privacy and space.
- Looking at the property type distribution in South Bradenton, House properties are the most common (60.3%), reflecting the local real estate landscape.
- Houses represent a significant 60.3% portion, catering likely to families or larger groups.
- Smaller segments like outdoor/unique, others, hotel/boutique (combined 7.4%) offer potential for unique stay experiences.
South Bradenton Airbnb Room Capacity Analysis (2026): Bedroom Distribution
Distribution of Listings by Number of Bedrooms
Room Capacity Insights for South Bradenton
- The dominant room capacity in South Bradenton is 2 bedrooms listings, making up 41.9% of the market. This suggests a strong demand for properties suitable for couples or solo travelers.
- Together, 2 bedrooms and 3 bedrooms properties represent 62.5% of the active Airbnb listings in South Bradenton, indicating a high concentration in these sizes.
- A significant 30.2% of listings offer 3+ bedrooms, catering to larger groups and families seeking more space in South Bradenton.
South Bradenton Vacation Rental Guest Capacity Trends (2026)
Distribution of Listings by Guest Capacity
Guest Capacity Insights for South Bradenton
- The most common guest capacity trend in South Bradenton vacation rentals is listings accommodating 4 guests (25%). This suggests the primary traveler segment is likely small families or groups.
- Properties designed for 4 guests and 6 guests dominate the South Bradenton STR market, accounting for 50.0% of listings.
- 44.8% of properties accommodate 6+ guests, serving the market segment for larger families or group travel in South Bradenton.
- On average, properties in South Bradenton are equipped to host 4.7 guests.
South Bradenton Airbnb Booking Patterns (2026): Available vs. Booked Days
Available Days Distribution
Booked Days Distribution
Booking Pattern Insights for South Bradenton
- The most common availability pattern in South Bradenton falls within the 181-270 days range, representing 41.2% of listings. This suggests many properties have significant open periods on their calendars.
- Approximately 75.8% of listings show high availability (181+ days open annually), indicating potential for increased bookings or specific owner usage patterns.
- For booked days, the 91-180 days range is most frequent in South Bradenton (42.6%), reflecting common guest stay durations or potential owner blocking patterns.
- A notable 25.8% of properties secure long booking periods (181+ days booked per year), highlighting successful long-term rental strategies or significant owner usage.
South Bradenton Airbnb Minimum Stay Requirements Analysis
Distribution of Listings by Minimum Night Requirement
1 Night
21 listings
15.4% of total
2 Nights
20 listings
14.7% of total
3 Nights
14 listings
10.3% of total
4-6 Nights
11 listings
8.1% of total
7-29 Nights
8 listings
5.9% of total
30+ Nights
62 listings
45.6% of total
Key Insights
- The most prevalent minimum stay requirement in South Bradenton is 30+ Nights, adopted by 45.6% of listings. This highlights the market's preference for longer commitments.
- A significant segment (45.6%) caters to monthly stays (30+ nights) in South Bradenton, pointing to opportunities in the extended-stay market.
Recommendations
- Align with the market by considering a 30+ Nights minimum stay, as 45.6% of South Bradenton hosts use this setting.
- If feasible, allowing 1-night stays, especially midweek or during low season, could capture last-minute bookings, as only 15.4% currently do.
- Explore offering discounts for stays of 30+ nights to attract the 45.6% of the market seeking extended stays.
- Adjust minimum nights based on seasonality – potentially shorter during low season and longer during peak demand periods in South Bradenton.
South Bradenton Airbnb Cancellation Policy Trends Analysis (2026)
Super Strict 60 Days
3 listings
2.2% of total
Super Strict 30 Days
1 listings
0.7% of total
Limited
2 listings
1.5% of total
Flexible
19 listings
14% of total
Moderate
25 listings
18.4% of total
Firm
58 listings
42.6% of total
Strict
28 listings
20.6% of total
Cancellation Policy Insights for South Bradenton
- The prevailing Airbnb cancellation policy trend in South Bradenton is Firm, used by 42.6% of listings.
- A majority (63.2%) of hosts in South Bradenton utilize Firm or Strict policies, indicating a market where hosts prioritize booking security.
Recommendations for Hosts
- Consider adopting a Firm policy to align with the 42.6% market standard in South Bradenton.
- Regularly review your cancellation policy against competitors and market demand shifts in South Bradenton.
South Bradenton STR Booking Lead Time Analysis (2026)
Average Booking Lead Time by Month
Booking Lead Time Insights for South Bradenton
- The overall average booking lead time for vacation rentals in South Bradenton is 43 days.
- Guests book furthest in advance for stays during February (average 69 days), likely coinciding with peak travel demand or local events.
- The shortest booking windows occur for stays in September (average 17 days), indicating more last-minute travel plans during this time.
- Seasonally, Winter (59 days avg.) sees the longest lead times, while Summer (32 days avg.) has the shortest, reflecting typical travel planning cycles.
Recommendations for Hosts
- Use the overall average lead time (43 days) as a baseline for your pricing and availability strategy in South Bradenton.
- For February stays, consider implementing length-of-stay discounts or slightly higher rates for bookings made less than 69 days out to capitalize on advance planning.
- Target marketing efforts for the Winter season well in advance (at least 59 days) to capture early planners.
- Monitor your own booking lead times against these South Bradenton averages to identify opportunities for dynamic pricing adjustments.
Popular & Essential Airbnb Amenities in South Bradenton (2026)
Amenity Prevalence
Amenity Insights for South Bradenton
- Essential amenities in South Bradenton that guests expect include: Air conditioning, Wifi, TV, Free parking on premises, Smoke alarm. Lacking these (any) could significantly impact bookings.
- Popular amenities like Kitchen, Coffee maker, Microwave are common but not universal. Offering these can provide a competitive edge.
Recommendations for Hosts
- Ensure your listing includes all essential amenities for South Bradenton: Air conditioning, Wifi, TV, Free parking on premises, Smoke alarm.
- Prioritize adding missing essentials: Wifi, TV, Free parking on premises, Smoke alarm.
- Consider adding popular differentiators like Kitchen or Coffee maker to increase appeal.
- Highlight unique or less common amenities you offer (e.g., hot tub, dedicated workspace, EV charger) in your listing description and photos.
- Regularly check competitor amenities in South Bradenton to stay competitive.
South Bradenton Airbnb Guest Demographics & Profile Analysis (2026)
Guest Profile Summary for South Bradenton
- The typical guest profile for Airbnb in South Bradenton consists of primarily domestic travelers (90%), often arriving from nearby Orlando, typically belonging to the Post-2000s (Gen Z/Alpha) group (50%), primarily speaking English or Spanish.
- Domestic travelers account for 89.7% of guests.
- Key international markets include United States (89.7%) and Canada (2.8%).
- Top languages spoken are English (66.3%) followed by Spanish (23%).
- A significant demographic segment is the Post-2000s (Gen Z/Alpha) group, representing 50% of guests.
Recommendations for Hosts
- Target domestic marketing efforts towards travelers from Orlando and New York.
- Tailor amenities and listing descriptions to appeal to the dominant Post-2000s (Gen Z/Alpha) demographic (e.g., highlight fast WiFi, smart home features, local guides).
- Highlight unique local experiences or amenities relevant to the primary guest profile.
- Consider seasonal promotions aligned with peak travel times for key origin markets.
Nearby Short-Term Rental Market Comparison
How does the South Bradenton Airbnb market stack up against its neighbors? Compare key performance metrics like average monthly revenue, ADR, and occupancy rates in surrounding areas to understand the broader regional STR landscape.
| Market | Active Properties | Monthly Revenue | Daily Rate | Avg. Occupancy |
|---|---|---|---|---|
| Anna Maria island | 587 | $7,996 | $823.96 | 41% |
| Anna Maria | 56 | $6,434 | $692.96 | 52% |
| Reunion | 12 | $6,321 | $580.45 | 44% |
| Boca Grande | 31 | $6,128 | $787.07 | 37% |
| Indian Rocks Beach | 842 | $5,560 | $419.63 | 49% |
| Captiva | 291 | $5,443 | $667.40 | 36% |
| Siesta Key | 1,175 | $5,206 | $518.91 | 42% |
| Belleair Beach | 94 | $5,086 | $339.65 | 53% |
| Bradenton Beach | 122 | $4,977 | $507.12 | 42% |
| Thonotosassa | 17 | $4,309 | $347.75 | 50% |