Seminole Airbnb Market Analysis 2026: Short Term Rental Data & Vacation Rental Statistics in Florida, United States
Is Airbnb profitable in Seminole in 2026? Explore comprehensive Airbnb analytics for Seminole, Florida, United States to uncover income potential. This 2026 STR market report for Seminole, based on AirROI data from February 2025 to January 2026, reveals key trends in the market of 519 active listings.
Whether you're considering an Airbnb investment in Seminole, optimizing your existing vacation rental, or exploring rental arbitrage opportunities, understanding the Seminole Airbnb data is crucial. Leveraging the low regulation environment is key to maximizing your short term rental income potential. Let's dive into the specifics.
Key Seminole Airbnb Performance Metrics Overview
Monthly Airbnb Revenue Variations & Income Potential in Seminole (2026)
Understanding the monthly revenue variations for Airbnb listings in Seminole is key to maximizing your short term rental income potential. Seasonality significantly impacts earnings. Our analysis, based on data from the past 12 months, shows that the peak revenue month for STRs in Seminole is typically March, while September often presents the lowest earnings, highlighting opportunities for strategic pricing adjustments during shoulder and low seasons. Explore the typical Airbnb income in Seminole across different performance tiers:
- Best-in-class properties (Top 10%) achieve $11,693+ monthly, often utilizing dynamic pricing and superior guest experiences.
- Strong performing properties (Top 25%) earn $7,763 or more, indicating effective management and desirable locations/amenities.
- Typical properties (Median) generate around $4,263 per month, representing the average market performance.
- Entry-level properties (Bottom 25%) see earnings around $2,177, often with potential for optimization.
Average Monthly Airbnb Earnings Trend in Seminole
Seminole Airbnb Occupancy Rate Trends (2026)
Maximize your bookings by understanding the Seminole STR occupancy trends. Seasonal demand shifts significantly influence how often properties are booked. Typically, Marchsees the highest demand (peak season occupancy), while September experiences the lowest (low season). Effective strategies, like adjusting minimum stays or offering promotions, can boost occupancy during slower periods. Here's how different property tiers perform in Seminole:
- Best-in-class properties (Top 10%) achieve 86%+ occupancy, indicating high desirability and potentially optimized availability.
- Strong performing properties (Top 25%) maintain 74% or higher occupancy, suggesting good market fit and guest satisfaction.
- Typical properties (Median) have an occupancy rate around 55%.
- Entry-level properties (Bottom 25%) average 35% occupancy, potentially facing higher vacancy.
Average Monthly Occupancy Rate Trend in Seminole
Average Daily Rate (ADR) Airbnb Trends in Seminole (2026)
Effective short term rental pricing strategy in Seminole involves understanding monthly ADR fluctuations. The Average Daily Rate (ADR) for Airbnb in Seminole typically peaks in March and dips lowest during September. Leveraging Airbnb dynamic pricing tools or strategies based on this seasonality can significantly boost revenue. Here's a look at the typical nightly rates achieved:
- Best-in-class properties (Top 10%) command rates of $589+ per night, often due to premium features or locations.
- Strong performing properties (Top 25%) achieve nightly rates of $393 or more.
- Typical properties (Median) charge around $263 per night.
- Entry-level properties (Bottom 25%) earn around $160 per night.
Average Daily Rate (ADR) Trend by Month in Seminole
Get Live Seminole Market Intelligence 👇

Explore Real-time Analytics
Airbnb Seasonality Analysis & Trends in Seminole (2026)
Peak Season (March, July, February)
- Revenue averages $7,524 per month
- Occupancy rates average 68.5%
- Daily rates average $330
Shoulder Season
- Revenue averages $5,442 per month
- Occupancy maintains around 51.7%
- Daily rates hold near $319
Low Season (September, October, November)
- Revenue drops to average $3,901 per month
- Occupancy decreases to average 42.1%
- Daily rates adjust to average $299
Seasonality Insights for Seminole
- The Airbnb seasonality in Seminole shows highly seasonal trends requiring careful strategy. While the sections above show seasonal averages, it's also insightful to look at the extremes:
- During the high season, the absolute peak month showcases Seminole's highest earning potential, with monthly revenues capable of climbing to $9,069, occupancy reaching a high of 77.1%, and ADRs peaking at $348.
- Conversely, the slowest single month of the year, typically falling within the low season, marks the market's lowest point. In this month, revenue might dip to $3,477, occupancy could drop to 38.8%, and ADRs may adjust down to $283.
- Understanding both the seasonal averages and these monthly peaks and troughs in revenue, occupancy, and ADR is crucial for maximizing your Airbnb profit potential in Seminole.
Seasonal Strategies for Maximizing Profit
- Peak Season: Maximize revenue through premium pricing and potentially longer minimum stays. Ensure high availability.
- Low Season: Offer competitive pricing, special promotions (e.g., extended stay discounts), and flexible cancellation policies. Target off-season travelers like remote workers or budget-conscious guests.
- Shoulder Seasons: Implement dynamic pricing that balances peak and low rates. Target weekend travelers or specific events. Offer slightly more flexible terms than peak season.
- Regularly analyze your own performance against these Seminole seasonality benchmarks and adjust your pricing and availability strategy accordingly.
Best Areas for Airbnb Investment in Seminole (2026)
Exploring the top neighborhoods for short-term rentals in Seminole? This section highlights key areas, outlining why they are attractive for hosts and guests, along with notable local attractions. Consider these locations based on your target guest profile and investment strategy.
| Neighborhood / Area | Why Host Here? (Target Guests & Appeal) | Key Attractions & Landmarks |
|---|---|---|
| Redington Shores | A tranquil beach community with stunning sunsets and beautiful sandy beaches. It's ideal for families and couples looking for a relaxing vacation away from the crowds. | Redington Shores Beach, Constitution Park, Sunset Beach, Dolphin Marine Rentals, Nar خطوة Pour naos, Falcon's Lair |
| Madeira Beach | Known for its family-friendly atmosphere, Madeira Beach offers a variety of shops, cafes, and the famous John's Pass Village, making it a hot spot for tourists. | John's Pass Village & Boardwalk, Madeira Beach, The Alligator Attraction, Gators Cafe & Saloon, Madeira Beach Access, R.O.C. Park |
| Treasure Island | Treasure Island is a beautiful beachside community known for its beautiful sandy shores and vibrant nightlife. It's perfect for renters seeking both relaxation and entertainment. | Treasure Island Beach, The Sunset Beach Pavilion, Treasure Bay Resort & Marina, Caddy's Treasure Island, Johns Pass, Sunset Beach |
| Clearwater Beach | Famous for its wide, white sandy beaches and clear waters. Clearwater Beach is popular among tourists and offers a range of activities for all ages. | Pier 60, Clearwater Marine Aquarium, Caladesi Island State Park, Sand Key Park, Splash Harbour Water Park, Beach Walk |
| St. Pete Beach | St. Pete Beach is known for its relaxing vibes and beautiful beaches. It attracts a lot of visitors looking for a vacation destination that's laid-back and fun. | St. Pete Beach, Pass-a-Grille Beach, Fort De Soto Park, The Don CeSar Hotel, Historic Corey Avenue, Pinellas Trail |
| Indian Rocks Beach | Indian Rocks Beach is a quieter beach destination known for its friendly community atmosphere and stunning beaches, attracting families and couples. | Indian Rocks Beach, Crush Craft Thai Street Food, Indian Rocks Historical Museum, Hammock Park, Kirk's Fountain Service, Tiki Gardens |
| Dunedin | Dunedin is a charming town known for its parks, waterfront activities, and vibrant downtown with shops and restaurants, making it appealing to a diverse crowd. | Dunedin Marina, Honeymoon Island State Park, Dunedin Golf Club, Pinellas Trail, Klein's Fish Camp, Blue Jays spring training |
| Safety Harbor | Safety Harbor is recognized for its unique shops, historic sites, and waterfront parks. It offers a warm community feeling and is popular among travelers looking to experience local culture. | Safety Harbor Spa, Phillipe Park, Old Safety Harbor Community Center, Safety Harbor Museum, Tampa Bay Area trails, Impressionist Art Gallery |
Understanding Airbnb License Requirements & STR Laws in Seminole (2026)
While Seminole, Florida, United States currently shows low STR regulations, specific Airbnb license requirements might still exist or change. Always verify the latest short term rental regulations and Airbnb license requirements directly with local government authorities for Seminole to ensure full compliance before hosting.
(Source: AirROI data, 2026, based on 0% licensed listings)
Top Performing Airbnb Properties in Seminole (2026)
Benchmark your potential! Explore examples of top-performing Airbnb properties in Seminolebased on Trailing Twelve Month (TTM) revenue. Analyze their characteristics, revenue, occupancy rate, and ADR to understand what drives success in this market.
Heated Pool, Pickleball, Bowling, Mini Golf, Bball
Entire Place • 5 bedrooms
Clearwater Oasis | Heated Pool, Basketball, Games!
Entire Place • 6 bedrooms
WOW Clearwater Resort! Heated Pool, Pickleball
Entire Place • 5 bedrooms
16 beds, 5BA, 2 Acres, Salt POOL, Spa
Entire Place • 7 bedrooms
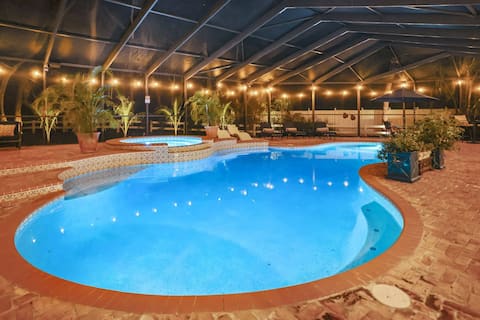
16 BEDS, Events, Salt Pool/Spa, Outdoor Kichen
Entire Place • 7 bedrooms
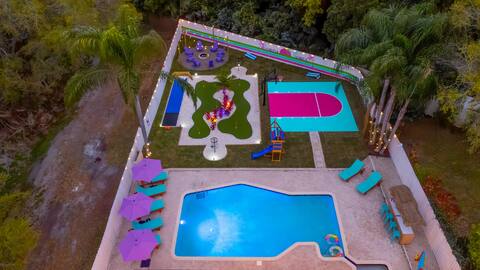
Tropic Vibes | Basketball, Mini Golf, Heated Pool!
Entire Place • 5 bedrooms
Note: Performance varies based on location, size, amenities, seasonality, and management quality. Data reflects the past 12 months.
Top Performing Airbnb Hosts in Seminole (2026)
Learn from the best! This table showcases top-performing Airbnb hosts in Seminole based on the number of properties managed and estimated total revenue over the past year. Analyze their scale and performance metrics.
| Host Name | Properties | Grossing Revenue | Stay Reviews | Avg Rating |
|---|---|---|---|---|
| Sabrina | 14 | $2,573,457 | 1614 | 4.87/5.0 |
| Kyle And Nicole | 8 | $951,244 | 293 | 4.87/5.0 |
| Mark | 8 | $827,337 | 438 | 4.84/5.0 |
| Stephanie | 6 | $745,810 | 1486 | 4.96/5.0 |
| Elliott And Kylie | 7 | $553,554 | 181 | 4.88/5.0 |
| Lauren | 2 | $489,377 | 73 | 5.00/5.0 |
| Sandra | 6 | $487,885 | 1149 | 4.98/5.0 |
| Beaches USA Rentals And Manage | 7 | $477,057 | 357 | 4.81/5.0 |
| Vacation Rentals Of Florida | 4 | $461,619 | 215 | 4.50/5.0 |
| Evolve | 17 | $433,441 | 446 | 4.62/5.0 |
Analyzing the strategies of top hosts, such as their property selection, pricing, and guest communication, can offer valuable lessons for optimizing your own Airbnb operations in Seminole.
Dive Deeper: Advanced Seminole STR Market Data (2026)
Ready to unlock more insights? AirROI provides access to advanced metrics and comprehensive Airbnb data for Seminole. Explore detailed analytics beyond this report to refine your investment strategy, optimize pricing, and maximize your vacation rental profits.
Explore Advanced MetricsSeminole Short-Term Rental Market Composition (2026): Property & Room Types
Room Type Distribution
Property Type Distribution
Market Composition Insights for Seminole
- The Seminole Airbnb market composition is heavily skewed towards Entire Home/Apt listings, which make up 97.5% of the 519 active rentals. This indicates strong guest preference for privacy and space.
- Looking at the property type distribution in Seminole, House properties are the most common (74.8%), reflecting the local real estate landscape.
- Houses represent a significant 74.8% portion, catering likely to families or larger groups.
- Smaller segments like outdoor/unique, others, hotel/boutique (combined 8.9%) offer potential for unique stay experiences.
Seminole Airbnb Room Capacity Analysis (2026): Bedroom Distribution
Distribution of Listings by Number of Bedrooms
Room Capacity Insights for Seminole
- The dominant room capacity in Seminole is 3 bedrooms listings, making up 31.2% of the market. This suggests a strong demand for properties suitable for families or small groups.
- Together, 3 bedrooms and 1 bedroom properties represent 51.4% of the active Airbnb listings in Seminole, indicating a high concentration in these sizes.
- A significant 60.5% of listings offer 3+ bedrooms, catering to larger groups and families seeking more space in Seminole.
Seminole Vacation Rental Guest Capacity Trends (2026)
Distribution of Listings by Guest Capacity
Guest Capacity Insights for Seminole
- The most common guest capacity trend in Seminole vacation rentals is listings accommodating 8+ guests (50.3%). This suggests the primary traveler segment is likely larger groups.
- Properties designed for 8+ guests and 4 guests dominate the Seminole STR market, accounting for 64.8% of listings.
- 66.5% of properties accommodate 6+ guests, serving the market segment for larger families or group travel in Seminole.
- On average, properties in Seminole are equipped to host 6.1 guests.
Seminole Airbnb Booking Patterns (2026): Available vs. Booked Days
Available Days Distribution
Booked Days Distribution
Booking Pattern Insights for Seminole
- The most common availability pattern in Seminole falls within the 181-270 days range, representing 35.5% of listings. This suggests many properties have significant open periods on their calendars.
- Approximately 65.4% of listings show high availability (181+ days open annually), indicating potential for increased bookings or specific owner usage patterns.
- For booked days, the 91-180 days range is most frequent in Seminole (35.3%), reflecting common guest stay durations or potential owner blocking patterns.
- A notable 36.6% of properties secure long booking periods (181+ days booked per year), highlighting successful long-term rental strategies or significant owner usage.
Seminole Airbnb Minimum Stay Requirements Analysis
Distribution of Listings by Minimum Night Requirement
1 Night
44 listings
8.5% of total
2 Nights
111 listings
21.4% of total
3 Nights
79 listings
15.2% of total
4-6 Nights
46 listings
8.9% of total
7-29 Nights
37 listings
7.1% of total
30+ Nights
202 listings
38.9% of total
Key Insights
- The most prevalent minimum stay requirement in Seminole is 30+ Nights, adopted by 38.9% of listings. This highlights the market's preference for longer commitments.
- A significant segment (38.9%) caters to monthly stays (30+ nights) in Seminole, pointing to opportunities in the extended-stay market.
Recommendations
- Align with the market by considering a 30+ Nights minimum stay, as 38.9% of Seminole hosts use this setting.
- If feasible, allowing 1-night stays, especially midweek or during low season, could capture last-minute bookings, as only 8.5% currently do.
- Explore offering discounts for stays of 30+ nights to attract the 38.9% of the market seeking extended stays.
- Adjust minimum nights based on seasonality – potentially shorter during low season and longer during peak demand periods in Seminole.
Seminole Airbnb Cancellation Policy Trends Analysis (2026)
Limited
19 listings
3.7% of total
Super Strict 30 Days
18 listings
3.5% of total
Super Strict 60 Days
8 listings
1.5% of total
Flexible
58 listings
11.2% of total
Moderate
143 listings
27.6% of total
Firm
205 listings
39.6% of total
Strict
67 listings
12.9% of total
Cancellation Policy Insights for Seminole
- The prevailing Airbnb cancellation policy trend in Seminole is Firm, used by 39.6% of listings.
- A majority (52.5%) of hosts in Seminole utilize Firm or Strict policies, indicating a market where hosts prioritize booking security.
Recommendations for Hosts
- Consider adopting a Firm policy to align with the 39.6% market standard in Seminole.
- Using a Strict policy might deter some guests, as only 12.9% of listings use it. Evaluate if potential revenue protection outweighs possible lower booking rates.
- Regularly review your cancellation policy against competitors and market demand shifts in Seminole.
Seminole STR Booking Lead Time Analysis (2026)
Average Booking Lead Time by Month
Booking Lead Time Insights for Seminole
- The overall average booking lead time for vacation rentals in Seminole is 52 days.
- Guests book furthest in advance for stays during March (average 77 days), likely coinciding with peak travel demand or local events.
- The shortest booking windows occur for stays in September (average 34 days), indicating more last-minute travel plans during this time.
- Seasonally, Winter (64 days avg.) sees the longest lead times, while Summer (41 days avg.) has the shortest, reflecting typical travel planning cycles.
Recommendations for Hosts
- Use the overall average lead time (52 days) as a baseline for your pricing and availability strategy in Seminole.
- For March stays, consider implementing length-of-stay discounts or slightly higher rates for bookings made less than 77 days out to capitalize on advance planning.
- Target marketing efforts for the Winter season well in advance (at least 64 days) to capture early planners.
- Monitor your own booking lead times against these Seminole averages to identify opportunities for dynamic pricing adjustments.
Popular & Essential Airbnb Amenities in Seminole (2026)
Amenity Prevalence
Amenity Insights for Seminole
- Essential amenities in Seminole that guests expect include: Wifi, Air conditioning, TV, Smoke alarm, Free parking on premises, Coffee maker, Hot water, Refrigerator, Kitchen. Lacking these (any) could significantly impact bookings.
- Popular amenities like Microwave are common but not universal. Offering these can provide a competitive edge.
Recommendations for Hosts
- Ensure your listing includes all essential amenities for Seminole: Wifi, Air conditioning, TV, Smoke alarm, Free parking on premises, Coffee maker, Hot water, Refrigerator, Kitchen.
- Prioritize adding missing essentials: Air conditioning, TV, Smoke alarm, Free parking on premises, Coffee maker, Hot water, Refrigerator, Kitchen.
- Consider adding popular differentiators like Microwave to increase appeal.
- Highlight unique or less common amenities you offer (e.g., hot tub, dedicated workspace, EV charger) in your listing description and photos.
- Regularly check competitor amenities in Seminole to stay competitive.
Seminole Airbnb Guest Demographics & Profile Analysis (2026)
Guest Profile Summary for Seminole
- The typical guest profile for Airbnb in Seminole consists of primarily domestic travelers (94%), often arriving from nearby Orlando, typically belonging to the Post-2000s (Gen Z/Alpha) group (50%), primarily speaking English or Spanish.
- Domestic travelers account for 94.2% of guests.
- Key international markets include United States (94.2%) and Canada (2.3%).
- Top languages spoken are English (72.3%) followed by Spanish (14.4%).
- A significant demographic segment is the Post-2000s (Gen Z/Alpha) group, representing 50% of guests.
Recommendations for Hosts
- Target domestic marketing efforts towards travelers from Orlando and Tampa.
- Tailor amenities and listing descriptions to appeal to the dominant Post-2000s (Gen Z/Alpha) demographic (e.g., highlight fast WiFi, smart home features, local guides).
- Highlight unique local experiences or amenities relevant to the primary guest profile.
- Consider seasonal promotions aligned with peak travel times for key origin markets.
Nearby Short-Term Rental Market Comparison
How does the Seminole Airbnb market stack up against its neighbors? Compare key performance metrics like average monthly revenue, ADR, and occupancy rates in surrounding areas to understand the broader regional STR landscape.
| Market | Active Properties | Monthly Revenue | Daily Rate | Avg. Occupancy |
|---|---|---|---|---|
| Anna Maria island | 587 | $7,996 | $823.96 | 41% |
| Anna Maria | 56 | $6,434 | $692.96 | 52% |
| Reunion | 12 | $6,321 | $580.45 | 44% |
| Boca Grande | 31 | $6,128 | $787.07 | 37% |
| Indian Rocks Beach | 842 | $5,560 | $419.63 | 49% |
| Captiva | 291 | $5,443 | $667.40 | 36% |
| Siesta Key | 1,175 | $5,206 | $518.91 | 42% |
| Belleair Beach | 94 | $5,086 | $339.65 | 53% |
| Bradenton Beach | 122 | $4,977 | $507.12 | 42% |
| Thonotosassa | 17 | $4,309 | $347.75 | 50% |