Santa Rosa Beach Airbnb Market Analysis 2026: Short Term Rental Data & Vacation Rental Statistics in Florida, United States
Is Airbnb profitable in Santa Rosa Beach in 2026? Explore comprehensive Airbnb analytics for Santa Rosa Beach, Florida, United States to uncover income potential. This 2026 STR market report for Santa Rosa Beach, based on AirROI data from February 2025 to January 2026, reveals key trends in the bustling market of 3,191 active listings.
Whether you're considering an Airbnb investment in Santa Rosa Beach, optimizing your existing vacation rental, or exploring rental arbitrage opportunities, understanding the Santa Rosa Beach Airbnb data is crucial. Leveraging the low regulation environment is key to maximizing your short term rental income potential. Let's dive into the specifics.
Key Santa Rosa Beach Airbnb Performance Metrics Overview
Monthly Airbnb Revenue Variations & Income Potential in Santa Rosa Beach (2026)
Understanding the monthly revenue variations for Airbnb listings in Santa Rosa Beach is key to maximizing your short term rental income potential. Seasonality significantly impacts earnings. Our analysis, based on data from the past 12 months, shows that the peak revenue month for STRs in Santa Rosa Beach is typically July, while January often presents the lowest earnings, highlighting opportunities for strategic pricing adjustments during shoulder and low seasons. Explore the typical Airbnb income in Santa Rosa Beach across different performance tiers:
- Best-in-class properties (Top 10%) achieve $14,336+ monthly, often utilizing dynamic pricing and superior guest experiences.
- Strong performing properties (Top 25%) earn $8,963 or more, indicating effective management and desirable locations/amenities.
- Typical properties (Median) generate around $5,199 per month, representing the average market performance.
- Entry-level properties (Bottom 25%) see earnings around $2,795, often with potential for optimization.
Average Monthly Airbnb Earnings Trend in Santa Rosa Beach
Santa Rosa Beach Airbnb Occupancy Rate Trends (2026)
Maximize your bookings by understanding the Santa Rosa Beach STR occupancy trends. Seasonal demand shifts significantly influence how often properties are booked. Typically, Julysees the highest demand (peak season occupancy), while January experiences the lowest (low season). Effective strategies, like adjusting minimum stays or offering promotions, can boost occupancy during slower periods. Here's how different property tiers perform in Santa Rosa Beach:
- Best-in-class properties (Top 10%) achieve 74%+ occupancy, indicating high desirability and potentially optimized availability.
- Strong performing properties (Top 25%) maintain 58% or higher occupancy, suggesting good market fit and guest satisfaction.
- Typical properties (Median) have an occupancy rate around 39%.
- Entry-level properties (Bottom 25%) average 22% occupancy, potentially facing higher vacancy.
Average Monthly Occupancy Rate Trend in Santa Rosa Beach
Average Daily Rate (ADR) Airbnb Trends in Santa Rosa Beach (2026)
Effective short term rental pricing strategy in Santa Rosa Beach involves understanding monthly ADR fluctuations. The Average Daily Rate (ADR) for Airbnb in Santa Rosa Beach typically peaks in June and dips lowest during February. Leveraging Airbnb dynamic pricing tools or strategies based on this seasonality can significantly boost revenue. Here's a look at the typical nightly rates achieved:
- Best-in-class properties (Top 10%) command rates of $952+ per night, often due to premium features or locations.
- Strong performing properties (Top 25%) achieve nightly rates of $633 or more.
- Typical properties (Median) charge around $437 per night.
- Entry-level properties (Bottom 25%) earn around $306 per night.
Average Daily Rate (ADR) Trend by Month in Santa Rosa Beach
Get Live Santa Rosa Beach Market Intelligence 👇

Explore Real-time Analytics
Airbnb Seasonality Analysis & Trends in Santa Rosa Beach (2026)
Peak Season (July, June, May)
- Revenue averages $11,131 per month
- Occupancy rates average 57.4%
- Daily rates average $600
Shoulder Season
- Revenue averages $6,409 per month
- Occupancy maintains around 40.1%
- Daily rates hold near $518
Low Season (January, February, December)
- Revenue drops to average $3,786 per month
- Occupancy decreases to average 26.3%
- Daily rates adjust to average $487
Seasonality Insights for Santa Rosa Beach
- The Airbnb seasonality in Santa Rosa Beach shows highly seasonal trends requiring careful strategy. While the sections above show seasonal averages, it's also insightful to look at the extremes:
- During the high season, the absolute peak month showcases Santa Rosa Beach's highest earning potential, with monthly revenues capable of climbing to $13,050, occupancy reaching a high of 65.4%, and ADRs peaking at $632.
- Conversely, the slowest single month of the year, typically falling within the low season, marks the market's lowest point. In this month, revenue might dip to $3,174, occupancy could drop to 19.4%, and ADRs may adjust down to $425.
- Understanding both the seasonal averages and these monthly peaks and troughs in revenue, occupancy, and ADR is crucial for maximizing your Airbnb profit potential in Santa Rosa Beach.
Seasonal Strategies for Maximizing Profit
- Peak Season: Maximize revenue through premium pricing and potentially longer minimum stays. Ensure high availability.
- Low Season: Offer competitive pricing, special promotions (e.g., extended stay discounts), and flexible cancellation policies. Target off-season travelers like remote workers or budget-conscious guests.
- Shoulder Seasons: Implement dynamic pricing that balances peak and low rates. Target weekend travelers or specific events. Offer slightly more flexible terms than peak season.
- Regularly analyze your own performance against these Santa Rosa Beach seasonality benchmarks and adjust your pricing and availability strategy accordingly.
Best Areas for Airbnb Investment in Santa Rosa Beach (2026)
Exploring the top neighborhoods for short-term rentals in Santa Rosa Beach? This section highlights key areas, outlining why they are attractive for hosts and guests, along with notable local attractions. Consider these locations based on your target guest profile and investment strategy.
| Neighborhood / Area | Why Host Here? (Target Guests & Appeal) | Key Attractions & Landmarks |
|---|---|---|
| Gulfview Heights | Quaint beach community known for its stunning Gulf views and beautiful homes. Ideal for families and couples looking for a relaxing beach getaway with plenty of amenities. | Gulfview Heights Beach, WaterColor Beach Club, Grayton Beach State Park, Butterfly Beach, Local dining options |
| Seagrove Beach | Popular destination that offers a blend of natural beauty and upscale living. Perfect for visitors looking for a quieter beach experience with proximity to shopping and dining. | Seagrove Beach, Eastern Lake, The Seaside Amphitheater, Local Art Galleries, Nature Trails |
| WaterColor | A beautifully designed community known for its stunning architecture and lush landscapes. Popular for its family-friendly atmosphere and access to various outdoor activities. | WaterColor Inn, Western Lake, Coastal dune lakes, Nature trails, WaterColor Shop |
| Grayton Beach | A historic beach town with a laid-back atmosphere, known for its stunning beaches and local art scene. Great for tourists seeking a unique cultural experience. | Grayton Beach State Park, Red Bar, Grayton Beach, Local art shops, Nature trails |
| Dune Allen Beach | A low-key beach destination that offers a peaceful retreat ideal for families. Known for its natural beauty and scenic waterways. | Dune Allen Beach, St. Andrews State Park, Santa Rosa Golf Club, Local dining options, Scenic bike trails |
| Point Washington | A charming area offering lush forests and serene lakes, perfect for those seeking a nature-rich experience away from the hustle and bustle. | Point Washington State Forest, Eastern Lake, Local hiking trails, Wildlife viewing, Kayaking opportunities |
| Santa Rosa Beach | The heart of the scenic 30A area, known for its stunning beaches and vibrant community. It's a prime location for both relaxation and entertainment. | Santa Rosa Beach, Blue Mountain Beach, Local shops and galleries, Beach access, Nature trails |
| Inlet Beach | A growing community that offers beautiful beaches and easy access to nearby attractions. Increasingly popular among both families and young travelers. | Inlet Beach, Camp Helen State Park, Local dining and shopping, Scenic views, Outdoor activities |
Understanding Airbnb License Requirements & STR Laws in Santa Rosa Beach (2026)
While Santa Rosa Beach, Florida, United States currently shows low STR regulations, specific Airbnb license requirements might still exist or change. Always verify the latest short term rental regulations and Airbnb license requirements directly with local government authorities for Santa Rosa Beach to ensure full compliance before hosting.
(Source: AirROI data, 2026, based on 0% licensed listings)
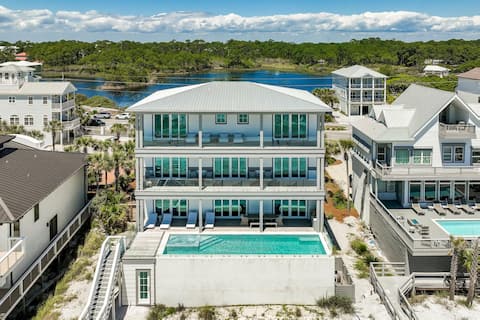
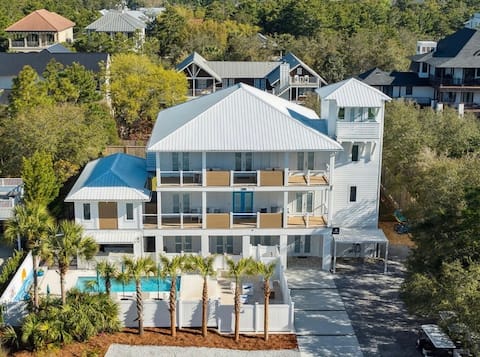
Top Performing Airbnb Properties in Santa Rosa Beach (2026)
Benchmark your potential! Explore examples of top-performing Airbnb properties in Santa Rosa Beachbased on Trailing Twelve Month (TTM) revenue. Analyze their characteristics, revenue, occupancy rate, and ADR to understand what drives success in this market.

Seawalk Sanctuary | Beachfront | Rooftop Pool
Entire Place • 6 bedrooms
Barefoot Bliss by Stay on 30a
Entire Place • 6 bedrooms

Sleeps 26! Huge Pool, LSV, Bikes, Steps to Beach!
Entire Place • 6 bedrooms
FREE Pool Heat • 9BR Luxe | Game Rm, 2 LSV + Grill
Entire Place • 9 bedrooms

Majestic View | Community Pool | Steps to Beach!
Entire Place • 5 bedrooms

20% Off to Start the Year | Heated Pool
Entire Place • 4 bedrooms
Note: Performance varies based on location, size, amenities, seasonality, and management quality. Data reflects the past 12 months.
Top Performing Airbnb Hosts in Santa Rosa Beach (2026)
Learn from the best! This table showcases top-performing Airbnb hosts in Santa Rosa Beach based on the number of properties managed and estimated total revenue over the past year. Analyze their scale and performance metrics.
| Host Name | Properties | Grossing Revenue | Stay Reviews | Avg Rating |
|---|---|---|---|---|
| 360 Blue | 127 | $13,676,495 | 435 | 4.76/5.0 |
| Oversee | 115 | $12,358,965 | 629 | 4.83/5.0 |
| Southern Holiday Homes | 60 | $10,381,758 | 1669 | 4.76/5.0 |
| RealJoy | 160 | $7,773,082 | 3075 | 4.70/5.0 |
| 30A Beach Girls By AvantStay | 74 | $5,809,622 | 512 | 4.82/5.0 |
| Benchmark Management 30A | 172 | $5,584,145 | 1555 | 4.51/5.0 |
| Nancy | 79 | $5,350,344 | 2087 | 4.85/5.0 |
| Echelon | 20 | $3,307,552 | 59 | 4.93/5.0 |
| Scenic Stays | 82 | $3,140,605 | 443 | 4.66/5.0 |
| Emerald Coast Vacation Rentals | 46 | $3,085,769 | 716 | 4.71/5.0 |
Analyzing the strategies of top hosts, such as their property selection, pricing, and guest communication, can offer valuable lessons for optimizing your own Airbnb operations in Santa Rosa Beach.
Dive Deeper: Advanced Santa Rosa Beach STR Market Data (2026)
Ready to unlock more insights? AirROI provides access to advanced metrics and comprehensive Airbnb data for Santa Rosa Beach. Explore detailed analytics beyond this report to refine your investment strategy, optimize pricing, and maximize your vacation rental profits.
Explore Advanced MetricsSanta Rosa Beach Short-Term Rental Market Composition (2026): Property & Room Types
Room Type Distribution
Property Type Distribution
Market Composition Insights for Santa Rosa Beach
- The Santa Rosa Beach Airbnb market composition is heavily skewed towards Entire Home/Apt listings, which make up 99.7% of the 3,191 active rentals. This indicates strong guest preference for privacy and space.
- Looking at the property type distribution in Santa Rosa Beach, House properties are the most common (68.5%), reflecting the local real estate landscape.
- Houses represent a significant 68.5% portion, catering likely to families or larger groups.
- Smaller segments like hotel/boutique, outdoor/unique, others, unique stays (combined 1.1%) offer potential for unique stay experiences.
Santa Rosa Beach Airbnb Room Capacity Analysis (2026): Bedroom Distribution
Distribution of Listings by Number of Bedrooms
Room Capacity Insights for Santa Rosa Beach
- The dominant room capacity in Santa Rosa Beach is 4 bedrooms listings, making up 27.2% of the market. This suggests a strong demand for properties suitable for families or small groups.
- Together, 4 bedrooms and 3 bedrooms properties represent 52.9% of the active Airbnb listings in Santa Rosa Beach, indicating a high concentration in these sizes.
- A significant 69.7% of listings offer 3+ bedrooms, catering to larger groups and families seeking more space in Santa Rosa Beach.
Santa Rosa Beach Vacation Rental Guest Capacity Trends (2026)
Distribution of Listings by Guest Capacity
Guest Capacity Insights for Santa Rosa Beach
- The most common guest capacity trend in Santa Rosa Beach vacation rentals is listings accommodating 8+ guests (66.2%). This suggests the primary traveler segment is likely larger groups.
- Properties designed for 8+ guests and 6 guests dominate the Santa Rosa Beach STR market, accounting for 83.3% of listings.
- 87.0% of properties accommodate 6+ guests, serving the market segment for larger families or group travel in Santa Rosa Beach.
- On average, properties in Santa Rosa Beach are equipped to host 7.1 guests.
Santa Rosa Beach Airbnb Booking Patterns (2026): Available vs. Booked Days
Available Days Distribution
Booked Days Distribution
Booking Pattern Insights for Santa Rosa Beach
- The most common availability pattern in Santa Rosa Beach falls within the 271-366 days range, representing 46.4% of listings. This suggests many properties have significant open periods on their calendars.
- Approximately 84.3% of listings show high availability (181+ days open annually), indicating potential for increased bookings or specific owner usage patterns.
- For booked days, the 91-180 days range is most frequent in Santa Rosa Beach (38.8%), reflecting common guest stay durations or potential owner blocking patterns.
- A notable 16.9% of properties secure long booking periods (181+ days booked per year), highlighting successful long-term rental strategies or significant owner usage.
Santa Rosa Beach Airbnb Minimum Stay Requirements Analysis
Distribution of Listings by Minimum Night Requirement
1 Night
110 listings
3.5% of total
2 Nights
241 listings
7.6% of total
3 Nights
470 listings
14.7% of total
4-6 Nights
336 listings
10.5% of total
7-29 Nights
30 listings
0.9% of total
30+ Nights
2000 listings
62.8% of total
Key Insights
- The most prevalent minimum stay requirement in Santa Rosa Beach is 30+ Nights, adopted by 62.8% of listings. This highlights the market's preference for longer commitments.
- Very short stays (1-2 nights) are less common (11.1%), suggesting hosts prefer slightly longer bookings to optimize turnover.
- A significant segment (62.8%) caters to monthly stays (30+ nights) in Santa Rosa Beach, pointing to opportunities in the extended-stay market.
Recommendations
- Align with the market by considering a 30+ Nights minimum stay, as 62.8% of Santa Rosa Beach hosts use this setting.
- If feasible, allowing 1-night stays, especially midweek or during low season, could capture last-minute bookings, as only 3.5% currently do.
- Explore offering discounts for stays of 30+ nights to attract the 62.8% of the market seeking extended stays.
- Adjust minimum nights based on seasonality – potentially shorter during low season and longer during peak demand periods in Santa Rosa Beach.
Santa Rosa Beach Airbnb Cancellation Policy Trends Analysis (2026)
Super Strict 30 Days
391 listings
12.3% of total
Limited
199 listings
6.3% of total
Super Strict 60 Days
527 listings
16.6% of total
Flexible
104 listings
3.3% of total
Moderate
286 listings
9% of total
Firm
1343 listings
42.3% of total
Strict
325 listings
10.2% of total
Cancellation Policy Insights for Santa Rosa Beach
- The prevailing Airbnb cancellation policy trend in Santa Rosa Beach is Firm, used by 42.3% of listings.
- A majority (52.5%) of hosts in Santa Rosa Beach utilize Firm or Strict policies, indicating a market where hosts prioritize booking security.
Recommendations for Hosts
- Consider adopting a Firm policy to align with the 42.3% market standard in Santa Rosa Beach.
- Using a Strict policy might deter some guests, as only 10.2% of listings use it. Evaluate if potential revenue protection outweighs possible lower booking rates.
- Regularly review your cancellation policy against competitors and market demand shifts in Santa Rosa Beach.
Santa Rosa Beach STR Booking Lead Time Analysis (2026)
Average Booking Lead Time by Month
Booking Lead Time Insights for Santa Rosa Beach
- The overall average booking lead time for vacation rentals in Santa Rosa Beach is 65 days.
- Guests book furthest in advance for stays during November (average 82 days), likely coinciding with peak travel demand or local events.
- The shortest booking windows occur for stays in March (average 56 days), indicating more last-minute travel plans during this time.
- Seasonally, Fall (74 days avg.) sees the longest lead times, while Winter (60 days avg.) has the shortest, reflecting typical travel planning cycles.
Recommendations for Hosts
- Use the overall average lead time (65 days) as a baseline for your pricing and availability strategy in Santa Rosa Beach.
- For November stays, consider implementing length-of-stay discounts or slightly higher rates for bookings made less than 82 days out to capitalize on advance planning.
- Target marketing efforts for the Fall season well in advance (at least 74 days) to capture early planners.
- Monitor your own booking lead times against these Santa Rosa Beach averages to identify opportunities for dynamic pricing adjustments.
Popular & Essential Airbnb Amenities in Santa Rosa Beach (2026)
Amenity Prevalence
Amenity Insights for Santa Rosa Beach
- Essential amenities in Santa Rosa Beach that guests expect include: Air conditioning, Wifi, TV, Kitchen, Smoke alarm, Coffee maker, Heating, Refrigerator, Washer. Lacking these (any) could significantly impact bookings.
- Popular amenities like Free parking on premises are common but not universal. Offering these can provide a competitive edge.
Recommendations for Hosts
- Ensure your listing includes all essential amenities for Santa Rosa Beach: Air conditioning, Wifi, TV, Kitchen, Smoke alarm, Coffee maker, Heating, Refrigerator, Washer.
- Prioritize adding missing essentials: Air conditioning, Wifi, TV, Kitchen, Smoke alarm, Coffee maker, Heating, Refrigerator, Washer.
- Consider adding popular differentiators like Free parking on premises to increase appeal.
- Highlight unique or less common amenities you offer (e.g., hot tub, dedicated workspace, EV charger) in your listing description and photos.
- Regularly check competitor amenities in Santa Rosa Beach to stay competitive.
Santa Rosa Beach Airbnb Guest Demographics & Profile Analysis (2026)
Guest Profile Summary for Santa Rosa Beach
- The typical guest profile for Airbnb in Santa Rosa Beach consists of primarily domestic travelers (99%), often arriving from nearby Atlanta, typically belonging to the Post-2000s (Gen Z/Alpha) group (50%), primarily speaking English or Spanish.
- Domestic travelers account for 98.5% of guests.
- Key international markets include United States (98.5%) and United Kingdom (0.3%).
- Top languages spoken are English (77.4%) followed by Spanish (12.8%).
- A significant demographic segment is the Post-2000s (Gen Z/Alpha) group, representing 50% of guests.
Recommendations for Hosts
- Target domestic marketing efforts towards travelers from Atlanta and Nashville.
- Tailor amenities and listing descriptions to appeal to the dominant Post-2000s (Gen Z/Alpha) demographic (e.g., highlight fast WiFi, smart home features, local guides).
- Highlight unique local experiences or amenities relevant to the primary guest profile.
- Consider seasonal promotions aligned with peak travel times for key origin markets.
Nearby Short-Term Rental Market Comparison
How does the Santa Rosa Beach Airbnb market stack up against its neighbors? Compare key performance metrics like average monthly revenue, ADR, and occupancy rates in surrounding areas to understand the broader regional STR landscape.
| Market | Active Properties | Monthly Revenue | Daily Rate | Avg. Occupancy |
|---|---|---|---|---|
| Alys Beach | 441 | $6,989 | $682.56 | 43% |
| Seaside | 669 | $6,696 | $783.03 | 38% |
| Seacrest Beach | 350 | $6,613 | $593.69 | 44% |
| Rosemary Beach | 533 | $6,251 | $659.86 | 42% |
| Seacrest | 28 | $4,993 | $635.35 | 39% |
| Inlet Beach | 98 | $4,870 | $534.43 | 41% |
| Walton County | 134 | $4,764 | $592.07 | 38% |
| Watersound | 126 | $4,640 | $495.06 | 40% |
| Perdido Beach | 10 | $4,353 | $297.45 | 51% |
| Destin | 3,836 | $4,090 | $433.35 | 40% |