Sailfish Point Airbnb Market Analysis 2026: Short Term Rental Data & Vacation Rental Statistics in Florida, United States
Is Airbnb profitable in Sailfish Point in 2026? Explore comprehensive Airbnb analytics for Sailfish Point, Florida, United States to uncover income potential. This 2026 STR market report for Sailfish Point, based on AirROI data from February 2025 to January 2026, reveals key trends in the niche market of 19 active listings.
Whether you're considering an Airbnb investment in Sailfish Point, optimizing your existing vacation rental, or exploring rental arbitrage opportunities, understanding the Sailfish Point Airbnb data is crucial. Leveraging the low regulation environment is key to maximizing your short term rental income potential. Let's dive into the specifics.
Key Sailfish Point Airbnb Performance Metrics Overview
Monthly Airbnb Revenue Variations & Income Potential in Sailfish Point (2026)
Understanding the monthly revenue variations for Airbnb listings in Sailfish Point is key to maximizing your short term rental income potential. Seasonality significantly impacts earnings. Our analysis, based on data from the past 12 months, shows that the peak revenue month for STRs in Sailfish Point is typically July, while January often presents the lowest earnings, highlighting opportunities for strategic pricing adjustments during shoulder and low seasons. Explore the typical Airbnb income in Sailfish Point across different performance tiers:
- Best-in-class properties (Top 10%) achieve $41,995+ monthly, often utilizing dynamic pricing and superior guest experiences.
- Strong performing properties (Top 25%) earn $33,947 or more, indicating effective management and desirable locations/amenities.
- Typical properties (Median) generate around $24,815 per month, representing the average market performance.
- Entry-level properties (Bottom 25%) see earnings around $17,854, often with potential for optimization.
Average Monthly Airbnb Earnings Trend in Sailfish Point
Sailfish Point Airbnb Occupancy Rate Trends (2026)
Maximize your bookings by understanding the Sailfish Point STR occupancy trends. Seasonal demand shifts significantly influence how often properties are booked. Typically, Julysees the highest demand (peak season occupancy), while January experiences the lowest (low season). Effective strategies, like adjusting minimum stays or offering promotions, can boost occupancy during slower periods. Here's how different property tiers perform in Sailfish Point:
- Best-in-class properties (Top 10%) achieve 80%+ occupancy, indicating high desirability and potentially optimized availability.
- Strong performing properties (Top 25%) maintain 69% or higher occupancy, suggesting good market fit and guest satisfaction.
- Typical properties (Median) have an occupancy rate around 57%.
- Entry-level properties (Bottom 25%) average 43% occupancy, potentially facing higher vacancy.
Average Monthly Occupancy Rate Trend in Sailfish Point
Average Daily Rate (ADR) Airbnb Trends in Sailfish Point (2026)
Effective short term rental pricing strategy in Sailfish Point involves understanding monthly ADR fluctuations. The Average Daily Rate (ADR) for Airbnb in Sailfish Point typically peaks in July and dips lowest during November. Leveraging Airbnb dynamic pricing tools or strategies based on this seasonality can significantly boost revenue. Here's a look at the typical nightly rates achieved:
- Best-in-class properties (Top 10%) command rates of $2,849+ per night, often due to premium features or locations.
- Strong performing properties (Top 25%) achieve nightly rates of $2,049 or more.
- Typical properties (Median) charge around $1,586 per night.
- Entry-level properties (Bottom 25%) earn around $1,381 per night.
Average Daily Rate (ADR) Trend by Month in Sailfish Point
Get Live Sailfish Point Market Intelligence 👇

Explore Real-time Analytics
Airbnb Seasonality Analysis & Trends in Sailfish Point (2026)
Peak Season (July, June, April)
- Revenue averages $40,336 per month
- Occupancy rates average 75.3%
- Daily rates average $2,115
Shoulder Season
- Revenue averages $25,215 per month
- Occupancy maintains around 56.8%
- Daily rates hold near $1,743
Low Season (January, September, October)
- Revenue drops to average $14,311 per month
- Occupancy decreases to average 33.5%
- Daily rates adjust to average $1,614
Seasonality Insights for Sailfish Point
- The Airbnb seasonality in Sailfish Point shows highly seasonal trends requiring careful strategy. While the sections above show seasonal averages, it's also insightful to look at the extremes:
- During the high season, the absolute peak month showcases Sailfish Point's highest earning potential, with monthly revenues capable of climbing to $48,362, occupancy reaching a high of 82.4%, and ADRs peaking at $2,306.
- Conversely, the slowest single month of the year, typically falling within the low season, marks the market's lowest point. In this month, revenue might dip to $12,263, occupancy could drop to 23.0%, and ADRs may adjust down to $1,456.
- Understanding both the seasonal averages and these monthly peaks and troughs in revenue, occupancy, and ADR is crucial for maximizing your Airbnb profit potential in Sailfish Point.
Seasonal Strategies for Maximizing Profit
- Peak Season: Maximize revenue through premium pricing and potentially longer minimum stays. Ensure high availability.
- Low Season: Offer competitive pricing, special promotions (e.g., extended stay discounts), and flexible cancellation policies. Target off-season travelers like remote workers or budget-conscious guests.
- Shoulder Seasons: Implement dynamic pricing that balances peak and low rates. Target weekend travelers or specific events. Offer slightly more flexible terms than peak season.
- Regularly analyze your own performance against these Sailfish Point seasonality benchmarks and adjust your pricing and availability strategy accordingly.
Best Areas for Airbnb Investment in Sailfish Point (2026)
Exploring the top neighborhoods for short-term rentals in Sailfish Point? This section highlights key areas, outlining why they are attractive for hosts and guests, along with notable local attractions. Consider these locations based on your target guest profile and investment strategy.
| Neighborhood / Area | Why Host Here? (Target Guests & Appeal) | Key Attractions & Landmarks |
|---|---|---|
| Sailfish Point | Exclusive oceanfront community renowned for luxury homes and marina access. Ideal for affluent travelers seeking privacy, beautiful views, and top-notch amenities like golf and tennis. | Sailfish Point Marina, Private Beach Access, Golf Course, Tennis Courts, Swimming Pools |
| Stuart Beach | Beautiful beach area popular for its family-friendly atmosphere and outdoor activities. Great for tourists looking for a relaxing beach vacation with nearby restaurants and entertainment. | Stuart Beach Park, The Oceanographic Institute, Boat Rentals, Nearby Restaurants, Fishing Spots |
| Hutchinson Island | Known for its stunning beaches and natural beauty, this area attracts tourists for its outdoor activities and quieter beach experience away from the city. | Hutchinson Island Beach, Bathtub Reef, Elliott Museum, Dolphin Watching Tours, Nature Trails |
| Downtown Stuart | Charming downtown area with historic buildings, local shops, and waterfront dining. Perfect for tourists who enjoy culture, history, and a vibrant community ambiance. | Haney Circle Park, Stuart Heritage Museum, Shops and Art Galleries, Waterfront Dining, Local Events |
| Port Salerno | A quaint fishing village appealing to those interested in seafood and local culture. Offers a unique, authentic experience with scenic views. | Port Salerno Commercial Fishing, Restaurants along the waterfront, Local Art Shows, Fishing Charters, Nature Preserves |
| Jensen Beach | A laid-back beach town ideal for families and those looking to escape the hustle and bustle, featuring beautiful beaches and quaint shops. | Jensen Beach Park, Shopping at Jensen Beach Plaza, Water Sports, Local Art Festivals, Restaurants |
| Martin County Beaches | With various beautiful beaches, this area caters to all types of tourists, from those looking for lively beach parties to serene and secluded spots. | Bathtub Reef Beach, Savanna State Preserve, Tropical Wildlife Viewing, Snorkeling Spots, Oceanfront Dining |
| Royal Palm Beach | Family-friendly community with recreational parks appealing to those who want easy access to amenities and green spaces. Great for families visiting the area. | Osprey Oaks Golf Club, Royal Palm Beach Commons Park, Local Shopping Centers, Events and Festivals, Family Activities |
Understanding Airbnb License Requirements & STR Laws in Sailfish Point (2026)
While Sailfish Point, Florida, United States currently shows low STR regulations, specific Airbnb license requirements might still exist or change. Always verify the latest short term rental regulations and Airbnb license requirements directly with local government authorities for Sailfish Point to ensure full compliance before hosting.
(Source: AirROI data, 2026, finding no licensed listings among those analyzed)
Top Performing Airbnb Properties in Sailfish Point (2026)
Benchmark your potential! Explore examples of top-performing Airbnb properties in Sailfish Pointbased on Trailing Twelve Month (TTM) revenue. Analyze their characteristics, revenue, occupancy rate, and ADR to understand what drives success in this market.
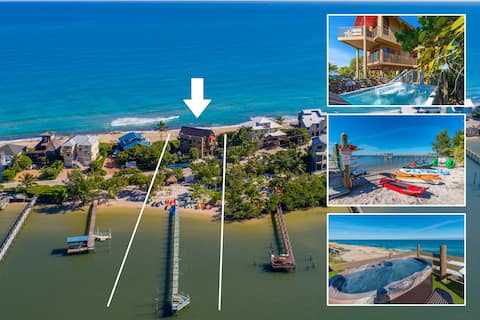
Art on the Beach: 8BR/5BA Oceanfront w/pool+dock!
Entire Place • 8 bedrooms
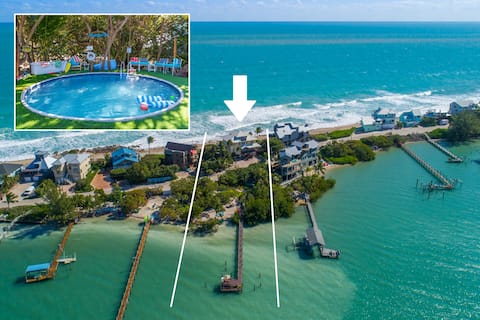
Eden Beach Retreat:7BR/7BA w/Dock, hot tub, & more
Entire Place • 7 bedrooms
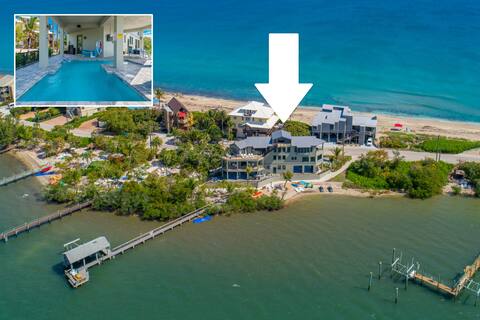
Nirvana Shores:8BR/6BA Pool! Dock! Hot Tub! +More!
Entire Place • 8 bedrooms

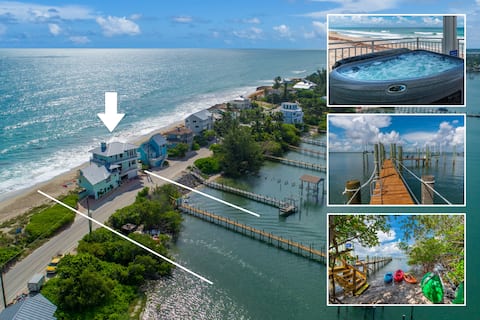
Carpe Diem:7BR/5BA Private Beach+Pool/dock/hot tub
Entire Place • 7 bedrooms
Xanadu: 12+BR/6BA On BEACH w/Elevator,2 Pools+Dock
Entire Place • 13 bedrooms

Gemini Beach: Home with 2 beaches, 2 Pools + Dock
Entire Place • 7 bedrooms
Note: Performance varies based on location, size, amenities, seasonality, and management quality. Data reflects the past 12 months.
Top Performing Airbnb Hosts in Sailfish Point (2026)
Learn from the best! This table showcases top-performing Airbnb hosts in Sailfish Point based on the number of properties managed and estimated total revenue over the past year. Analyze their scale and performance metrics.
| Host Name | Properties | Grossing Revenue | Stay Reviews | Avg Rating |
|---|---|---|---|---|
| Al | 17 | $3,522,252 | 695 | 4.95/5.0 |
| Patrick | 1 | $187,494 | 60 | 4.93/5.0 |
| Ohiopyle Vacation Rentals | 1 | $99,809 | 53 | 4.87/5.0 |
Analyzing the strategies of top hosts, such as their property selection, pricing, and guest communication, can offer valuable lessons for optimizing your own Airbnb operations in Sailfish Point.
Dive Deeper: Advanced Sailfish Point STR Market Data (2026)
Ready to unlock more insights? AirROI provides access to advanced metrics and comprehensive Airbnb data for Sailfish Point. Explore detailed analytics beyond this report to refine your investment strategy, optimize pricing, and maximize your vacation rental profits.
Explore Advanced MetricsSailfish Point Short-Term Rental Market Composition (2026): Property & Room Types
Room Type Distribution
Property Type Distribution
Market Composition Insights for Sailfish Point
- The Sailfish Point Airbnb market composition is heavily skewed towards Entire Home/Apt listings, which make up 100% of the 19 active rentals. This indicates strong guest preference for privacy and space.
- Looking at the property type distribution in Sailfish Point, House properties are the most common (100%), reflecting the local real estate landscape.
- Houses represent a significant 100% portion, catering likely to families or larger groups.
Sailfish Point Airbnb Room Capacity Analysis (2026): Bedroom Distribution
Distribution of Listings by Number of Bedrooms
Room Capacity Insights for Sailfish Point
- The dominant room capacity in Sailfish Point is 5+ bedrooms listings, making up 89.5% of the market. This suggests a strong demand for properties suitable for families or small groups.
- Together, 5+ bedrooms and 4 bedrooms properties represent 94.8% of the active Airbnb listings in Sailfish Point, indicating a high concentration in these sizes.
- A significant 100.1% of listings offer 3+ bedrooms, catering to larger groups and families seeking more space in Sailfish Point.
Sailfish Point Vacation Rental Guest Capacity Trends (2026)
Distribution of Listings by Guest Capacity
Guest Capacity Insights for Sailfish Point
- The most common guest capacity trend in Sailfish Point vacation rentals is listings accommodating 8+ guests (94.7%). This suggests the primary traveler segment is likely larger groups.
- Properties designed for 8+ guests and 6 guests dominate the Sailfish Point STR market, accounting for 100.0% of listings.
- 100.0% of properties accommodate 6+ guests, serving the market segment for larger families or group travel in Sailfish Point.
- On average, properties in Sailfish Point are equipped to host 7.9 guests.
Sailfish Point Airbnb Booking Patterns (2026): Available vs. Booked Days
Available Days Distribution
Booked Days Distribution
Booking Pattern Insights for Sailfish Point
- The most common availability pattern in Sailfish Point falls within the 181-270 days range, representing 36.8% of listings. This suggests many properties have significant open periods on their calendars.
- Approximately 68.4% of listings show high availability (181+ days open annually), indicating potential for increased bookings or specific owner usage patterns.
- For booked days, the 181-270 days range is most frequent in Sailfish Point (36.8%), reflecting common guest stay durations or potential owner blocking patterns.
- A notable 36.8% of properties secure long booking periods (181+ days booked per year), highlighting successful long-term rental strategies or significant owner usage.
Sailfish Point Airbnb Minimum Stay Requirements Analysis
Distribution of Listings by Minimum Night Requirement
4-6 Nights
14 listings
73.7% of total
30+ Nights
5 listings
26.3% of total
Key Insights
- The most prevalent minimum stay requirement in Sailfish Point is 4-6 Nights, adopted by 73.7% of listings. This highlights the market's preference for longer commitments.
- A significant segment (26.3%) caters to monthly stays (30+ nights) in Sailfish Point, pointing to opportunities in the extended-stay market.
Recommendations
- Align with the market by considering a 4-6 Nights minimum stay, as 73.7% of Sailfish Point hosts use this setting.
- Explore offering discounts for stays of 30+ nights to attract the 26.3% of the market seeking extended stays.
- Adjust minimum nights based on seasonality – potentially shorter during low season and longer during peak demand periods in Sailfish Point.
Sailfish Point Airbnb Cancellation Policy Trends Analysis (2026)
Firm
19 listings
100% of total
Cancellation Policy Insights for Sailfish Point
- The prevailing Airbnb cancellation policy trend in Sailfish Point is Firm, used by 100% of listings.
- A majority (100.0%) of hosts in Sailfish Point utilize Firm or Strict policies, indicating a market where hosts prioritize booking security.
Recommendations for Hosts
- Consider adopting a Firm policy to align with the 100% market standard in Sailfish Point.
- Regularly review your cancellation policy against competitors and market demand shifts in Sailfish Point.
Sailfish Point STR Booking Lead Time Analysis (2026)
Average Booking Lead Time by Month
Booking Lead Time Insights for Sailfish Point
- The overall average booking lead time for vacation rentals in Sailfish Point is 160 days.
- Guests book furthest in advance for stays during March (average 203 days), likely coinciding with peak travel demand or local events.
- The shortest booking windows occur for stays in August (average 72 days), indicating more last-minute travel plans during this time.
- Seasonally, Spring (159 days avg.) sees the longest lead times, while Summer (135 days avg.) has the shortest, reflecting typical travel planning cycles.
Recommendations for Hosts
- Use the overall average lead time (160 days) as a baseline for your pricing and availability strategy in Sailfish Point.
- For March stays, consider implementing length-of-stay discounts or slightly higher rates for bookings made less than 203 days out to capitalize on advance planning.
- Target marketing efforts for the Spring season well in advance (at least 159 days) to capture early planners.
- Monitor your own booking lead times against these Sailfish Point averages to identify opportunities for dynamic pricing adjustments.
Popular & Essential Airbnb Amenities in Sailfish Point (2026)
Amenity Prevalence
No amenities with partial availability (less than 100%) were found to display in the chart. All essential amenities might be present in all listings. Check insights below.
Amenity Insights for Sailfish Point
- Essential amenities in Sailfish Point that guests expect include: Free parking on premises, Microwave, Dedicated workspace, Kitchen, Heating, Beach access, Refrigerator, Iron, Dryer, Air conditioning. Lacking these (any) could significantly impact bookings.
Recommendations for Hosts
- Ensure your listing includes all essential amenities for Sailfish Point: Free parking on premises, Microwave, Dedicated workspace, Kitchen, Heating, Beach access, Refrigerator, Iron, Dryer, Air conditioning.
- Highlight unique or less common amenities you offer (e.g., hot tub, dedicated workspace, EV charger) in your listing description and photos.
- Regularly check competitor amenities in Sailfish Point to stay competitive.
Sailfish Point Airbnb Guest Demographics & Profile Analysis (2026)
Guest Profile Summary for Sailfish Point
- The typical guest profile for Airbnb in Sailfish Point consists of primarily domestic travelers (97%), often arriving from nearby Tampa, typically belonging to the Post-2000s (Gen Z/Alpha) group (50%), primarily speaking English or Spanish.
- Domestic travelers account for 97.0% of guests.
- Key international markets include United States (97%) and United Kingdom (3%).
- Top languages spoken are English (83.3%) followed by Spanish (16.7%).
- A significant demographic segment is the Post-2000s (Gen Z/Alpha) group, representing 50% of guests.
Recommendations for Hosts
- Target domestic marketing efforts towards travelers from Tampa and Key Largo.
- Tailor amenities and listing descriptions to appeal to the dominant Post-2000s (Gen Z/Alpha) demographic (e.g., highlight fast WiFi, smart home features, local guides).
- Highlight unique local experiences or amenities relevant to the primary guest profile.
- Consider seasonal promotions aligned with peak travel times for key origin markets.
Nearby Short-Term Rental Market Comparison
How does the Sailfish Point Airbnb market stack up against its neighbors? Compare key performance metrics like average monthly revenue, ADR, and occupancy rates in surrounding areas to understand the broader regional STR landscape.
| Market | Active Properties | Monthly Revenue | Daily Rate | Avg. Occupancy |
|---|---|---|---|---|
| Lake Clarke Shores | 26 | $6,710 | $516.52 | 46% |
| Reunion | 12 | $6,321 | $580.45 | 44% |
| Lighthouse Point | 75 | $6,205 | $472.94 | 51% |
| Melbourne Beach | 275 | $5,384 | $488.83 | 43% |
| Tequesta | 43 | $4,920 | $376.96 | 50% |
| Juno Beach | 39 | $4,807 | $377.00 | 47% |
| Parkland | 17 | $4,637 | $369.21 | 47% |
| Ocean Ridge | 14 | $4,588 | $602.78 | 48% |
| Plantation | 121 | $4,249 | $438.64 | 44% |
| Delray Beach | 708 | $4,094 | $372.35 | 48% |