Rosemary Beach Airbnb Market Analysis 2026: Short Term Rental Data & Vacation Rental Statistics in Florida, United States
Is Airbnb profitable in Rosemary Beach in 2026? Explore comprehensive Airbnb analytics for Rosemary Beach, Florida, United States to uncover income potential. This 2026 STR market report for Rosemary Beach, based on AirROI data from February 2025 to January 2026, reveals key trends in the market of 533 active listings.
Whether you're considering an Airbnb investment in Rosemary Beach, optimizing your existing vacation rental, or exploring rental arbitrage opportunities, understanding the Rosemary Beach Airbnb data is crucial. Leveraging the low regulation environment is key to maximizing your short term rental income potential. Let's dive into the specifics.
Key Rosemary Beach Airbnb Performance Metrics Overview
Monthly Airbnb Revenue Variations & Income Potential in Rosemary Beach (2026)
Understanding the monthly revenue variations for Airbnb listings in Rosemary Beach is key to maximizing your short term rental income potential. Seasonality significantly impacts earnings. Our analysis, based on data from the past 12 months, shows that the peak revenue month for STRs in Rosemary Beach is typically July, while January often presents the lowest earnings, highlighting opportunities for strategic pricing adjustments during shoulder and low seasons. Explore the typical Airbnb income in Rosemary Beach across different performance tiers:
- Best-in-class properties (Top 10%) achieve $16,985+ monthly, often utilizing dynamic pricing and superior guest experiences.
- Strong performing properties (Top 25%) earn $10,772 or more, indicating effective management and desirable locations/amenities.
- Typical properties (Median) generate around $6,592 per month, representing the average market performance.
- Entry-level properties (Bottom 25%) see earnings around $3,754, often with potential for optimization.
Average Monthly Airbnb Earnings Trend in Rosemary Beach
Rosemary Beach Airbnb Occupancy Rate Trends (2026)
Maximize your bookings by understanding the Rosemary Beach STR occupancy trends. Seasonal demand shifts significantly influence how often properties are booked. Typically, Julysees the highest demand (peak season occupancy), while January experiences the lowest (low season). Effective strategies, like adjusting minimum stays or offering promotions, can boost occupancy during slower periods. Here's how different property tiers perform in Rosemary Beach:
- Best-in-class properties (Top 10%) achieve 75%+ occupancy, indicating high desirability and potentially optimized availability.
- Strong performing properties (Top 25%) maintain 61% or higher occupancy, suggesting good market fit and guest satisfaction.
- Typical properties (Median) have an occupancy rate around 43%.
- Entry-level properties (Bottom 25%) average 24% occupancy, potentially facing higher vacancy.
Average Monthly Occupancy Rate Trend in Rosemary Beach
Average Daily Rate (ADR) Airbnb Trends in Rosemary Beach (2026)
Effective short term rental pricing strategy in Rosemary Beach involves understanding monthly ADR fluctuations. The Average Daily Rate (ADR) for Airbnb in Rosemary Beach typically peaks in June and dips lowest during February. Leveraging Airbnb dynamic pricing tools or strategies based on this seasonality can significantly boost revenue. Here's a look at the typical nightly rates achieved:
- Best-in-class properties (Top 10%) command rates of $1,177+ per night, often due to premium features or locations.
- Strong performing properties (Top 25%) achieve nightly rates of $780 or more.
- Typical properties (Median) charge around $514 per night.
- Entry-level properties (Bottom 25%) earn around $376 per night.
Average Daily Rate (ADR) Trend by Month in Rosemary Beach
Get Live Rosemary Beach Market Intelligence 👇

Explore Real-time Analytics
Airbnb Seasonality Analysis & Trends in Rosemary Beach (2026)
Peak Season (July, June, May)
- Revenue averages $13,031 per month
- Occupancy rates average 58.7%
- Daily rates average $738
Shoulder Season
- Revenue averages $8,118 per month
- Occupancy maintains around 43.3%
- Daily rates hold near $629
Low Season (January, February, December)
- Revenue drops to average $4,615 per month
- Occupancy decreases to average 27.2%
- Daily rates adjust to average $582
Seasonality Insights for Rosemary Beach
- The Airbnb seasonality in Rosemary Beach shows highly seasonal trends requiring careful strategy. While the sections above show seasonal averages, it's also insightful to look at the extremes:
- During the high season, the absolute peak month showcases Rosemary Beach's highest earning potential, with monthly revenues capable of climbing to $14,659, occupancy reaching a high of 65.0%, and ADRs peaking at $774.
- Conversely, the slowest single month of the year, typically falling within the low season, marks the market's lowest point. In this month, revenue might dip to $3,830, occupancy could drop to 20.5%, and ADRs may adjust down to $511.
- Understanding both the seasonal averages and these monthly peaks and troughs in revenue, occupancy, and ADR is crucial for maximizing your Airbnb profit potential in Rosemary Beach.
Seasonal Strategies for Maximizing Profit
- Peak Season: Maximize revenue through premium pricing and potentially longer minimum stays. Ensure high availability.
- Low Season: Offer competitive pricing, special promotions (e.g., extended stay discounts), and flexible cancellation policies. Target off-season travelers like remote workers or budget-conscious guests.
- Shoulder Seasons: Implement dynamic pricing that balances peak and low rates. Target weekend travelers or specific events. Offer slightly more flexible terms than peak season.
- Regularly analyze your own performance against these Rosemary Beach seasonality benchmarks and adjust your pricing and availability strategy accordingly.
Best Areas for Airbnb Investment in Rosemary Beach (2026)
Exploring the top neighborhoods for short-term rentals in Rosemary Beach? This section highlights key areas, outlining why they are attractive for hosts and guests, along with notable local attractions. Consider these locations based on your target guest profile and investment strategy.
| Neighborhood / Area | Why Host Here? (Target Guests & Appeal) | Key Attractions & Landmarks |
|---|---|---|
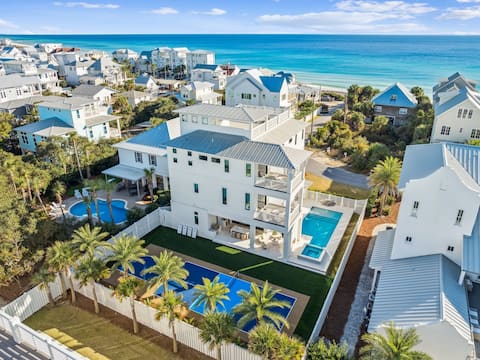
| Rosemary Beach | Charming beach town known for its Gulf front homes, beautiful architecture, and strict preservation of character. Ideal for families and travelers looking for a relaxing beach getaway with a small-town feel. | Rosemary Beach Town Center, Rosemary Beach Farmers Market, Eastern Lake, High Pointe Beach, The Gulf Restaurant, St. Joe Beach |
| Seaside | Famous for its picturesque streets and pastel-colored homes, Seaside offers a unique, walkable community experience. Perfect for families and those looking for a vibrant beach atmosphere with shops and eateries. | Seaside Amphitheater, Seaside Chapel, Seaside Post Office, The Blue Box Theatre, Sea Oats Beach, Bud & Alley’s Restaurant |
| Alys Beach | Upscale vacation community with stunning white architecture and landscaped courtyards. Appeals to luxury travelers and those in search of serene beach experiences. | Alys Beach nature trails, Fountain at Alys Beach, Caliza Pool, Alys Beach's Gulf views, Peddler’s Pavilion, Alys Beach events |
| Inlet Beach | Quieter than its neighbors while still providing easy beach access. Ideal for families and groups looking for spacious accommodations close to the beach. | Inlet Beach Access, Camp Helen State Park, Lake Powell, Inlet Beach Shopping, Restaurants nearby, Scenic Highway 30A |
| Grayton Beach | Eclectic beach community known for its artsy vibe and laid-back atmosphere. Great for younger travelers looking for unique accommodations and outdoor activities. | Grayton Beach State Park, Grayton Beach Historic District, The Red Bar, Boating and fishing, Nature trails, Grayton Beach Arts Festival |
| WaterColor | Family-friendly community adjacent to Seaside, known for its resort-style amenities. Perfect for families and larger groups seeking a beach vacation with diverse activities. | WaterColor Inn & Resort, WaterColor Beach Club, Cerulean Park, Nature trails, WaterColor Marina, Art galleries |
| Santa Rosa Beach | Offers a beautiful mix of beach and local culture. Popular among tourists for its natural beauty and proximity to state parks. | Santa Rosa Beach Access, Point Washington State Forest, Gulf Place Town Center, Local art shops, Santa Rosa Golf Club, Sprawling beaches |
| Miramar Beach | Famous for its expansive beaches and family-friendly resorts. Ideal for travelers looking for a lively beach vacation with plenty of activities. | Miramar Beach Access, Silver Sands Premium Outlets, Miramar Beach restaurants, Destin Commons, Water sports activities, Beachfront dining |
Understanding Airbnb License Requirements & STR Laws in Rosemary Beach (2026)
While Rosemary Beach, Florida, United States currently shows low STR regulations, specific Airbnb license requirements might still exist or change. Always verify the latest short term rental regulations and Airbnb license requirements directly with local government authorities for Rosemary Beach to ensure full compliance before hosting.
(Source: AirROI data, 2026, finding no licensed listings among those analyzed)
Top Performing Airbnb Properties in Rosemary Beach (2026)
Benchmark your potential! Explore examples of top-performing Airbnb properties in Rosemary Beachbased on Trailing Twelve Month (TTM) revenue. Analyze their characteristics, revenue, occupancy rate, and ADR to understand what drives success in this market.
Pickleton Place - Pool! Spa! Pickle Ball Court!
Entire Place • 7 bedrooms
Beach Access | POOL | Gulf View | 11 Beds
Entire Place �• 5 bedrooms
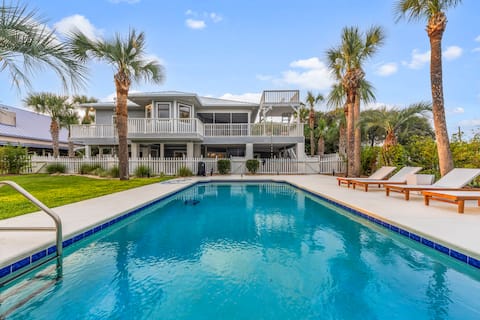
Rosemary: Private Heated Pool,Private Beach,Bikes
Entire Place • 5 bedrooms
20% Off to Start the Year | Private Beach + Pool
Entire Place • 4 bedrooms

20% Off to Start the Year – Private Pool + Bikes
Entire Place • 6 bedrooms

Pompano Palms - Private Pool! Gulf Views!
Entire Place • 6 bedrooms
Note: Performance varies based on location, size, amenities, seasonality, and management quality. Data reflects the past 12 months.
Top Performing Airbnb Hosts in Rosemary Beach (2026)
Learn from the best! This table showcases top-performing Airbnb hosts in Rosemary Beach based on the number of properties managed and estimated total revenue over the past year. Analyze their scale and performance metrics.
| Host Name | Properties | Grossing Revenue | Stay Reviews | Avg Rating |
|---|---|---|---|---|
| 360 Blue | 44 | $5,458,485 | 135 | 4.62/5.0 |
| Oversee | 16 | $1,824,515 | 110 | 4.69/5.0 |
| 30aEscapes | 33 | $1,713,320 | 105 | 4.66/5.0 |
| Kalos Dwellings | 14 | $1,670,589 | 428 | 4.91/5.0 |
| David | 21 | $1,408,796 | 2470 | 4.75/5.0 |
| Echelon | 9 | $1,267,147 | 29 | 4.69/5.0 |
| 30A Vacay | 15 | $1,031,670 | 145 | 4.49/5.0 |
| RealJoy | 10 | $998,487 | 288 | 4.71/5.0 |
| 30A Beach Girls By AvantStay | 13 | $979,471 | 119 | 4.81/5.0 |
| Panhandle Getaways | 20 | $977,910 | 149 | 4.65/5.0 |
Analyzing the strategies of top hosts, such as their property selection, pricing, and guest communication, can offer valuable lessons for optimizing your own Airbnb operations in Rosemary Beach.
Dive Deeper: Advanced Rosemary Beach STR Market Data (2026)
Ready to unlock more insights? AirROI provides access to advanced metrics and comprehensive Airbnb data for Rosemary Beach. Explore detailed analytics beyond this report to refine your investment strategy, optimize pricing, and maximize your vacation rental profits.
Explore Advanced MetricsRosemary Beach Short-Term Rental Market Composition (2026): Property & Room Types
Room Type Distribution
Property Type Distribution
Market Composition Insights for Rosemary Beach
- The Rosemary Beach Airbnb market composition is heavily skewed towards Entire Home/Apt listings, which make up 99.8% of the 533 active rentals. This indicates strong guest preference for privacy and space.
- Looking at the property type distribution in Rosemary Beach, House properties are the most common (72.4%), reflecting the local real estate landscape.
- Houses represent a significant 72.4% portion, catering likely to families or larger groups.
- Smaller segments like hotel/boutique, others (combined 2.2%) offer potential for unique stay experiences.
Rosemary Beach Airbnb Room Capacity Analysis (2026): Bedroom Distribution
Distribution of Listings by Number of Bedrooms
Room Capacity Insights for Rosemary Beach
- The dominant room capacity in Rosemary Beach is 3 bedrooms listings, making up 25.5% of the market. This suggests a strong demand for properties suitable for families or small groups.
- Together, 3 bedrooms and 4 bedrooms properties represent 50.3% of the active Airbnb listings in Rosemary Beach, indicating a high concentration in these sizes.
- A significant 69.6% of listings offer 3+ bedrooms, catering to larger groups and families seeking more space in Rosemary Beach.
Rosemary Beach Vacation Rental Guest Capacity Trends (2026)
Distribution of Listings by Guest Capacity
Guest Capacity Insights for Rosemary Beach
- The most common guest capacity trend in Rosemary Beach vacation rentals is listings accommodating 8+ guests (66.2%). This suggests the primary traveler segment is likely larger groups.
- Properties designed for 8+ guests and 6 guests dominate the Rosemary Beach STR market, accounting for 80.1% of listings.
- 83.3% of properties accommodate 6+ guests, serving the market segment for larger families or group travel in Rosemary Beach.
- On average, properties in Rosemary Beach are equipped to host 6.9 guests.
Rosemary Beach Airbnb Booking Patterns (2026): Available vs. Booked Days
Available Days Distribution
Booked Days Distribution
Booking Pattern Insights for Rosemary Beach
- The most common availability pattern in Rosemary Beach falls within the 271-366 days range, representing 42.8% of listings. This suggests many properties have significant open periods on their calendars.
- Approximately 80.7% of listings show high availability (181+ days open annually), indicating potential for increased bookings or specific owner usage patterns.
- For booked days, the 91-180 days range is most frequent in Rosemary Beach (37.9%), reflecting common guest stay durations or potential owner blocking patterns.
- A notable 20.9% of properties secure long booking periods (181+ days booked per year), highlighting successful long-term rental strategies or significant owner usage.
Rosemary Beach Airbnb Minimum Stay Requirements Analysis
Distribution of Listings by Minimum Night Requirement
1 Night
18 listings
3.4% of total
2 Nights
29 listings
5.5% of total
3 Nights
77 listings
14.5% of total
4-6 Nights
42 listings
7.9% of total
7-29 Nights
5 listings
0.9% of total
30+ Nights
361 listings
67.9% of total
Key Insights
- The most prevalent minimum stay requirement in Rosemary Beach is 30+ Nights, adopted by 67.9% of listings. This highlights the market's preference for longer commitments.
- Very short stays (1-2 nights) are less common (8.9%), suggesting hosts prefer slightly longer bookings to optimize turnover.
- A significant segment (67.9%) caters to monthly stays (30+ nights) in Rosemary Beach, pointing to opportunities in the extended-stay market.
Recommendations
- Align with the market by considering a 30+ Nights minimum stay, as 67.9% of Rosemary Beach hosts use this setting.
- If feasible, allowing 1-night stays, especially midweek or during low season, could capture last-minute bookings, as only 3.4% currently do.
- Explore offering discounts for stays of 30+ nights to attract the 67.9% of the market seeking extended stays.
- Adjust minimum nights based on seasonality – potentially shorter during low season and longer during peak demand periods in Rosemary Beach.
Rosemary Beach Airbnb Cancellation Policy Trends Analysis (2026)
Super Strict 60 Days
128 listings
24.2% of total
Limited
14 listings
2.6% of total
Super Strict 30 Days
76 listings
14.3% of total
Flexible
10 listings
1.9% of total
Moderate
30 listings
5.7% of total
Firm
232 listings
43.8% of total
Strict
40 listings
7.5% of total
Cancellation Policy Insights for Rosemary Beach
- The prevailing Airbnb cancellation policy trend in Rosemary Beach is Firm, used by 43.8% of listings.
- A majority (51.3%) of hosts in Rosemary Beach utilize Firm or Strict policies, indicating a market where hosts prioritize booking security.
- Strict cancellation policies are quite rare (7.5%), potentially making listings with this policy less competitive unless justified by high demand or property type.
Recommendations for Hosts
- Consider adopting a Firm policy to align with the 43.8% market standard in Rosemary Beach.
- Using a Strict policy might deter some guests, as only 7.5% of listings use it. Evaluate if potential revenue protection outweighs possible lower booking rates.
- Regularly review your cancellation policy against competitors and market demand shifts in Rosemary Beach.
Rosemary Beach STR Booking Lead Time Analysis (2026)
Average Booking Lead Time by Month
Booking Lead Time Insights for Rosemary Beach
- The overall average booking lead time for vacation rentals in Rosemary Beach is 73 days.
- Guests book furthest in advance for stays during November (average 85 days), likely coinciding with peak travel demand or local events.
- The shortest booking windows occur for stays in February (average 51 days), indicating more last-minute travel plans during this time.
- Seasonally, Fall (81 days avg.) sees the longest lead times, while Winter (64 days avg.) has the shortest, reflecting typical travel planning cycles.
Recommendations for Hosts
- Use the overall average lead time (73 days) as a baseline for your pricing and availability strategy in Rosemary Beach.
- For November stays, consider implementing length-of-stay discounts or slightly higher rates for bookings made less than 85 days out to capitalize on advance planning.
- Target marketing efforts for the Fall season well in advance (at least 81 days) to capture early planners.
- Monitor your own booking lead times against these Rosemary Beach averages to identify opportunities for dynamic pricing adjustments.
Popular & Essential Airbnb Amenities in Rosemary Beach (2026)
Amenity Prevalence
Amenity Insights for Rosemary Beach
- Essential amenities in Rosemary Beach that guests expect include: Wifi, Air conditioning, TV, Smoke alarm, Coffee maker, Kitchen, Microwave. Lacking these (any) could significantly impact bookings.
- Popular amenities like Free parking on premises, Heating, Dishes and silverware are common but not universal. Offering these can provide a competitive edge.
Recommendations for Hosts
- Ensure your listing includes all essential amenities for Rosemary Beach: Wifi, Air conditioning, TV, Smoke alarm, Coffee maker, Kitchen, Microwave.
- Prioritize adding missing essentials: Wifi, Air conditioning, TV, Smoke alarm, Coffee maker, Kitchen, Microwave.
- Consider adding popular differentiators like Free parking on premises or Heating to increase appeal.
- Highlight unique or less common amenities you offer (e.g., hot tub, dedicated workspace, EV charger) in your listing description and photos.
- Regularly check competitor amenities in Rosemary Beach to stay competitive.
Rosemary Beach Airbnb Guest Demographics & Profile Analysis (2026)
Guest Profile Summary for Rosemary Beach
- The typical guest profile for Airbnb in Rosemary Beach consists of primarily domestic travelers (98%), often arriving from nearby Atlanta, typically belonging to the Post-2000s (Gen Z/Alpha) group (50%), primarily speaking English or Spanish.
- Domestic travelers account for 98.2% of guests.
- Key international markets include United States (98.2%) and DC (0.4%).
- Top languages spoken are English (73.6%) followed by Spanish (13.7%).
- A significant demographic segment is the Post-2000s (Gen Z/Alpha) group, representing 50% of guests.
Recommendations for Hosts
- Target domestic marketing efforts towards travelers from Atlanta and Nashville.
- Tailor amenities and listing descriptions to appeal to the dominant Post-2000s (Gen Z/Alpha) demographic (e.g., highlight fast WiFi, smart home features, local guides).
- Highlight unique local experiences or amenities relevant to the primary guest profile.
- Consider seasonal promotions aligned with peak travel times for key origin markets.
Nearby Short-Term Rental Market Comparison
How does the Rosemary Beach Airbnb market stack up against its neighbors? Compare key performance metrics like average monthly revenue, ADR, and occupancy rates in surrounding areas to understand the broader regional STR landscape.
| Market | Active Properties | Monthly Revenue | Daily Rate | Avg. Occupancy |
|---|---|---|---|---|
| Alys Beach | 441 | $6,989 | $682.56 | 43% |
| Seaside | 669 | $6,696 | $783.03 | 38% |
| Seacrest Beach | 350 | $6,613 | $593.69 | 44% |
| Santa Rosa Beach | 3,191 | $5,047 | $539.15 | 41% |
| Seacrest | 28 | $4,993 | $635.35 | 39% |
| Inlet Beach | 98 | $4,870 | $534.43 | 41% |
| Walton County | 134 | $4,764 | $592.07 | 38% |
| Watersound | 126 | $4,640 | $495.06 | 40% |
| Perdido Beach | 10 | $4,353 | $297.45 | 51% |
| Destin | 3,836 | $4,090 | $433.35 | 40% |