Redington Shores Airbnb Market Analysis 2026: Short Term Rental Data & Vacation Rental Statistics in Florida, United States
Is Airbnb profitable in Redington Shores in 2026? Explore comprehensive Airbnb analytics for Redington Shores, Florida, United States to uncover income potential. This 2026 STR market report for Redington Shores, based on AirROI data from February 2025 to January 2026, reveals key trends in the niche market of 172 active listings.
Whether you're considering an Airbnb investment in Redington Shores, optimizing your existing vacation rental, or exploring rental arbitrage opportunities, understanding the Redington Shores Airbnb data is crucial. Leveraging the low regulation environment is key to maximizing your short term rental income potential. Let's dive into the specifics.
Key Redington Shores Airbnb Performance Metrics Overview
Monthly Airbnb Revenue Variations & Income Potential in Redington Shores (2026)
Understanding the monthly revenue variations for Airbnb listings in Redington Shores is key to maximizing your short term rental income potential. Seasonality significantly impacts earnings. Our analysis, based on data from the past 12 months, shows that the peak revenue month for STRs in Redington Shores is typically March, while September often presents the lowest earnings, highlighting opportunities for strategic pricing adjustments during shoulder and low seasons. Explore the typical Airbnb income in Redington Shores across different performance tiers:
- Best-in-class properties (Top 10%) achieve $10,286+ monthly, often utilizing dynamic pricing and superior guest experiences.
- Strong performing properties (Top 25%) earn $6,864 or more, indicating effective management and desirable locations/amenities.
- Typical properties (Median) generate around $3,825 per month, representing the average market performance.
- Entry-level properties (Bottom 25%) see earnings around $1,836, often with potential for optimization.
Average Monthly Airbnb Earnings Trend in Redington Shores
Redington Shores Airbnb Occupancy Rate Trends (2026)
Maximize your bookings by understanding the Redington Shores STR occupancy trends. Seasonal demand shifts significantly influence how often properties are booked. Typically, Marchsees the highest demand (peak season occupancy), while January experiences the lowest (low season). Effective strategies, like adjusting minimum stays or offering promotions, can boost occupancy during slower periods. Here's how different property tiers perform in Redington Shores:
- Best-in-class properties (Top 10%) achieve 77%+ occupancy, indicating high desirability and potentially optimized availability.
- Strong performing properties (Top 25%) maintain 62% or higher occupancy, suggesting good market fit and guest satisfaction.
- Typical properties (Median) have an occupancy rate around 40%.
- Entry-level properties (Bottom 25%) average 19% occupancy, potentially facing higher vacancy.
Average Monthly Occupancy Rate Trend in Redington Shores
Average Daily Rate (ADR) Airbnb Trends in Redington Shores (2026)
Effective short term rental pricing strategy in Redington Shores involves understanding monthly ADR fluctuations. The Average Daily Rate (ADR) for Airbnb in Redington Shores typically peaks in March and dips lowest during August. Leveraging Airbnb dynamic pricing tools or strategies based on this seasonality can significantly boost revenue. Here's a look at the typical nightly rates achieved:
- Best-in-class properties (Top 10%) command rates of $587+ per night, often due to premium features or locations.
- Strong performing properties (Top 25%) achieve nightly rates of $419 or more.
- Typical properties (Median) charge around $268 per night.
- Entry-level properties (Bottom 25%) earn around $173 per night.
Average Daily Rate (ADR) Trend by Month in Redington Shores
Get Live Redington Shores Market Intelligence 👇

Explore Real-time Analytics
Airbnb Seasonality Analysis & Trends in Redington Shores (2026)
Peak Season (March, February, July)
- Revenue averages $7,490 per month
- Occupancy rates average 56.2%
- Daily rates average $363
Shoulder Season
- Revenue averages $4,749 per month
- Occupancy maintains around 40.1%
- Daily rates hold near $322
Low Season (January, September, October)
- Revenue drops to average $3,437 per month
- Occupancy decreases to average 30.9%
- Daily rates adjust to average $324
Seasonality Insights for Redington Shores
- The Airbnb seasonality in Redington Shores shows highly seasonal trends requiring careful strategy. While the sections above show seasonal averages, it's also insightful to look at the extremes:
- During the high season, the absolute peak month showcases Redington Shores's highest earning potential, with monthly revenues capable of climbing to $8,879, occupancy reaching a high of 64.1%, and ADRs peaking at $400.
- Conversely, the slowest single month of the year, typically falling within the low season, marks the market's lowest point. In this month, revenue might dip to $3,221, occupancy could drop to 28.0%, and ADRs may adjust down to $298.
- Understanding both the seasonal averages and these monthly peaks and troughs in revenue, occupancy, and ADR is crucial for maximizing your Airbnb profit potential in Redington Shores.
Seasonal Strategies for Maximizing Profit
- Peak Season: Maximize revenue through premium pricing and potentially longer minimum stays. Ensure high availability.
- Low Season: Offer competitive pricing, special promotions (e.g., extended stay discounts), and flexible cancellation policies. Target off-season travelers like remote workers or budget-conscious guests.
- Shoulder Seasons: Implement dynamic pricing that balances peak and low rates. Target weekend travelers or specific events. Offer slightly more flexible terms than peak season.
- Regularly analyze your own performance against these Redington Shores seasonality benchmarks and adjust your pricing and availability strategy accordingly.
Best Areas for Airbnb Investment in Redington Shores (2026)
Exploring the top neighborhoods for short-term rentals in Redington Shores? This section highlights key areas, outlining why they are attractive for hosts and guests, along with notable local attractions. Consider these locations based on your target guest profile and investment strategy.
| Neighborhood / Area | Why Host Here? (Target Guests & Appeal) | Key Attractions & Landmarks |
|---|---|---|
| North Redington Beach | A peaceful beach community known for its pristine beaches and family-friendly atmosphere. Ideal for guests looking for a quiet retreat away from the bustle of larger towns. | Redington Beach, John's Pass Village, Tangerine Plaza, Sunset Beach, Madeira Beach, Redington Long Pier |
| Madeira Beach | Popular for its beautiful coastline and vibrant local community, perfect for families and beachgoers. Homey yet lively, this area attracts a variety of visitors year-round. | John's Pass, Madeira Beach Boardwalk, Gators Cafe & Saloon, R.O.C. Park, Madeira Beach Recreation Department, Gators Dockside |
| Treasure Island | Known for its sandy beaches and waterfront activities, Treasure Island is a favorite among tourists who enjoy outdoor recreation, dining, and nightlife. | Treasure Island Beach, Johns Pass, Caddy's on the Beach, Sunset Beach Park, Treasure Bay Golf and Tennis, Gulf Front Park |
| St. Pete Beach | Offers beautiful beaches, eclectic dining, and a vibrant arts scene. It attracts a diverse crowd seeking both relaxation and entertainment. | St. Pete Beach, Ego Alley, The Don CeSar Hotel, Pass-a-Grille Beach, Fort De Soto Park, Suncoast Seabird Sanctuary |
| Clearwater Beach | Famous for its soft white sands and numerous activities including water sports and nightlife, Clearwater Beach is a highly sought-after destination. | Clearwater Beach, Pier 60, Caladesi Island State Park, Clearwater Marine Aquarium, Sand Key Park, Frenchy's Rockaway Grill |
| Indian Rocks Beach | A quieter beach community, known for its beautiful sunsets and laid-back atmosphere. Popular among families and those looking to escape the crowd. | Indian Rocks Beach, Kirk's 100% Pure Ice Cream, Splash Harbour Water Park, Indian Rocks Nature Preserve, Bicycle Trail, George MC Farlane Park |
| Sand Key | A more exclusive beach area, it offers tranquility while still being close to local attractions. It’s great for travelers seeking a luxurious getaway. | Sand Key Park, Caladesi Island State Park, Sand Key Beach, Local restaurants and shops, Boat rentals, Clearwater Beach proximity |
| Redington Shores | A charming coastal town with a mix of locals and tourists. Ideal for those who wish to experience a quaint beach vibe with easy access to nearby attractions. | Redington Shores Beach, Redington Long Pier, Nearby beach walk areas, Local dining spots, Water sports, Nature trails |
Understanding Airbnb License Requirements & STR Laws in Redington Shores (2026)
While Redington Shores, Florida, United States currently shows low STR regulations, specific Airbnb license requirements might still exist or change. Always verify the latest short term rental regulations and Airbnb license requirements directly with local government authorities for Redington Shores to ensure full compliance before hosting.
(Source: AirROI data, 2026, based on 3% licensed listings)
Top Performing Airbnb Properties in Redington Shores (2026)
Benchmark your potential! Explore examples of top-performing Airbnb properties in Redington Shoresbased on Trailing Twelve Month (TTM) revenue. Analyze their characteristics, revenue, occupancy rate, and ADR to understand what drives success in this market.

Private Luxury Oceanfront Resort with Pool & Spa
Entire Place • 8 bedrooms

Seaclusion~Breathtaking,Beachfront Home, Pets OK!
Entire Place ��• 4 bedrooms
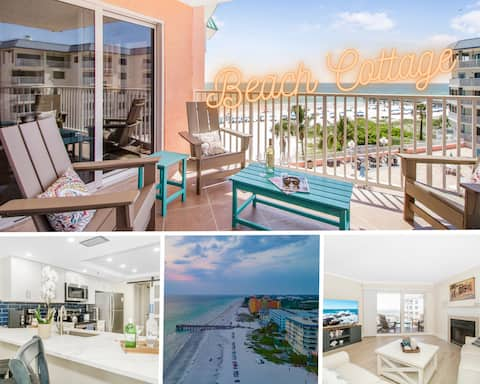
Beach Cottage 1411 Indian Shores, Gulf Front 3BR
Entire Place • 3 bedrooms

Direct Beachfront Living with Oversized Balcony
Entire Place • 3 bedrooms
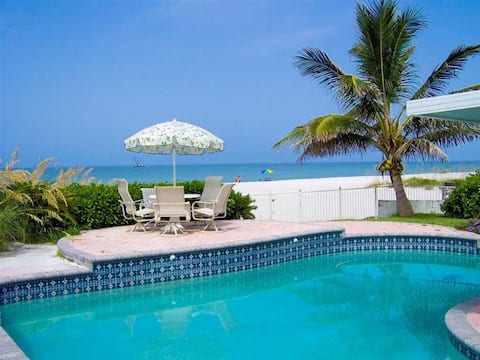
Gulf Front Home With Pool/Hot Tub
Entire Place • 5 bedrooms

Beach Front Condo 3 bathrooms 3 bedrooms/5 beds
Entire Place • 3 bedrooms
Note: Performance varies based on location, size, amenities, seasonality, and management quality. Data reflects the past 12 months.
Top Performing Airbnb Hosts in Redington Shores (2026)
Learn from the best! This table showcases top-performing Airbnb hosts in Redington Shores based on the number of properties managed and estimated total revenue over the past year. Analyze their scale and performance metrics.
| Host Name | Properties | Grossing Revenue | Stay Reviews | Avg Rating |
|---|---|---|---|---|
| Christopher Eric | 28 | $1,375,190 | 326 | 4.56/5.0 |
| Resort Rentals | 9 | $632,920 | 174 | 4.58/5.0 |
| Eva | 1 | $408,961 | 74 | 4.85/5.0 |
| Anthony | 2 | $237,717 | 50 | 5.00/5.0 |
| Nexthome Beach Time Realty | 2 | $223,787 | 6 | 5.00/5.0 |
| Happy Place Vacation Rentals | 3 | $205,600 | 75 | 4.83/5.0 |
| Stephany | 7 | $181,345 | 183 | 4.90/5.0 |
| At Home Property Mgmt And Real | 2 | $160,613 | 77 | 4.83/5.0 |
| Scott | 10 | $142,349 | 251 | 4.77/5.0 |
| Lysette | 3 | $141,220 | 71 | 5.00/5.0 |
Analyzing the strategies of top hosts, such as their property selection, pricing, and guest communication, can offer valuable lessons for optimizing your own Airbnb operations in Redington Shores.
Dive Deeper: Advanced Redington Shores STR Market Data (2026)
Ready to unlock more insights? AirROI provides access to advanced metrics and comprehensive Airbnb data for Redington Shores. Explore detailed analytics beyond this report to refine your investment strategy, optimize pricing, and maximize your vacation rental profits.
Explore Advanced MetricsRedington Shores Short-Term Rental Market Composition (2026): Property & Room Types
Room Type Distribution
Property Type Distribution
Market Composition Insights for Redington Shores
- The Redington Shores Airbnb market composition is heavily skewed towards Entire Home/Apt listings, which make up 90.1% of the 172 active rentals. This indicates strong guest preference for privacy and space.
- Looking at the property type distribution in Redington Shores, Apartment/Condo properties are the most common (71.5%), reflecting the local real estate landscape.
- Houses represent a significant 18.6% portion, catering likely to families or larger groups.
- The presence of 9.3% Hotel/Boutique listings indicates integration with traditional hospitality.
- Smaller segments like others (combined 0.6%) offer potential for unique stay experiences.
Redington Shores Airbnb Room Capacity Analysis (2026): Bedroom Distribution
Distribution of Listings by Number of Bedrooms
Room Capacity Insights for Redington Shores
- The dominant room capacity in Redington Shores is 3 bedrooms listings, making up 36.6% of the market. This suggests a strong demand for properties suitable for families or small groups.
- Together, 3 bedrooms and 2 bedrooms properties represent 68.6% of the active Airbnb listings in Redington Shores, indicating a high concentration in these sizes.
- A significant 42.4% of listings offer 3+ bedrooms, catering to larger groups and families seeking more space in Redington Shores.
Redington Shores Vacation Rental Guest Capacity Trends (2026)
Distribution of Listings by Guest Capacity
Guest Capacity Insights for Redington Shores
- The most common guest capacity trend in Redington Shores vacation rentals is listings accommodating 8+ guests (39%). This suggests the primary traveler segment is likely larger groups.
- Properties designed for 8+ guests and 6 guests dominate the Redington Shores STR market, accounting for 62.8% of listings.
- 63.4% of properties accommodate 6+ guests, serving the market segment for larger families or group travel in Redington Shores.
- On average, properties in Redington Shores are equipped to host 5.8 guests.
Redington Shores Airbnb Booking Patterns (2026): Available vs. Booked Days
Available Days Distribution
Booked Days Distribution
Booking Pattern Insights for Redington Shores
- The most common availability pattern in Redington Shores falls within the 271-366 days range, representing 53.5% of listings. This suggests many properties have significant open periods on their calendars.
- Approximately 83.2% of listings show high availability (181+ days open annually), indicating potential for increased bookings or specific owner usage patterns.
- For booked days, the 31-90 days range is most frequent in Redington Shores (32.6%), reflecting common guest stay durations or potential owner blocking patterns.
- A notable 19.2% of properties secure long booking periods (181+ days booked per year), highlighting successful long-term rental strategies or significant owner usage.
Redington Shores Airbnb Minimum Stay Requirements Analysis
Distribution of Listings by Minimum Night Requirement
1 Night
16 listings
9.3% of total
2 Nights
10 listings
5.8% of total
3 Nights
8 listings
4.7% of total
4-6 Nights
28 listings
16.3% of total
7-29 Nights
23 listings
13.4% of total
30+ Nights
87 listings
50.6% of total
Key Insights
- The most prevalent minimum stay requirement in Redington Shores is 30+ Nights, adopted by 50.6% of listings. This highlights the market's preference for longer commitments.
- Very short stays (1-2 nights) are less common (15.1%), suggesting hosts prefer slightly longer bookings to optimize turnover.
- A significant segment (50.6%) caters to monthly stays (30+ nights) in Redington Shores, pointing to opportunities in the extended-stay market.
Recommendations
- Align with the market by considering a 30+ Nights minimum stay, as 50.6% of Redington Shores hosts use this setting.
- If feasible, allowing 1-night stays, especially midweek or during low season, could capture last-minute bookings, as only 9.3% currently do.
- Explore offering discounts for stays of 30+ nights to attract the 50.6% of the market seeking extended stays.
- Adjust minimum nights based on seasonality – potentially shorter during low season and longer during peak demand periods in Redington Shores.
Redington Shores Airbnb Cancellation Policy Trends Analysis (2026)
Super Strict 60 Days
3 listings
1.7% of total
Limited
4 listings
2.3% of total
Super Strict 30 Days
38 listings
22.1% of total
Flexible
12 listings
7% of total
Moderate
25 listings
14.5% of total
Firm
64 listings
37.2% of total
Strict
26 listings
15.1% of total
Cancellation Policy Insights for Redington Shores
- The prevailing Airbnb cancellation policy trend in Redington Shores is Firm, used by 37.2% of listings.
- A majority (52.3%) of hosts in Redington Shores utilize Firm or Strict policies, indicating a market where hosts prioritize booking security.
Recommendations for Hosts
- Consider adopting a Firm policy to align with the 37.2% market standard in Redington Shores.
- Regularly review your cancellation policy against competitors and market demand shifts in Redington Shores.
Redington Shores STR Booking Lead Time Analysis (2026)
Average Booking Lead Time by Month
Booking Lead Time Insights for Redington Shores
- The overall average booking lead time for vacation rentals in Redington Shores is 75 days.
- Guests book furthest in advance for stays during February (average 113 days), likely coinciding with peak travel demand or local events.
- The shortest booking windows occur for stays in September (average 50 days), indicating more last-minute travel plans during this time.
- Seasonally, Winter (89 days avg.) sees the longest lead times, while Summer (56 days avg.) has the shortest, reflecting typical travel planning cycles.
Recommendations for Hosts
- Use the overall average lead time (75 days) as a baseline for your pricing and availability strategy in Redington Shores.
- For February stays, consider implementing length-of-stay discounts or slightly higher rates for bookings made less than 113 days out to capitalize on advance planning.
- Target marketing efforts for the Winter season well in advance (at least 89 days) to capture early planners.
- Monitor your own booking lead times against these Redington Shores averages to identify opportunities for dynamic pricing adjustments.
Popular & Essential Airbnb Amenities in Redington Shores (2026)
Amenity Prevalence
Amenity Insights for Redington Shores
- Essential amenities in Redington Shores that guests expect include: Air conditioning, TV, Wifi, Free parking on premises, Kitchen, Refrigerator. Lacking these (any) could significantly impact bookings.
- Popular amenities like Coffee maker, Dishes and silverware, Hot water are common but not universal. Offering these can provide a competitive edge.
Recommendations for Hosts
- Ensure your listing includes all essential amenities for Redington Shores: Air conditioning, TV, Wifi, Free parking on premises, Kitchen, Refrigerator.
- Prioritize adding missing essentials: TV, Wifi, Free parking on premises, Kitchen, Refrigerator.
- Consider adding popular differentiators like Coffee maker or Dishes and silverware to increase appeal.
- Highlight unique or less common amenities you offer (e.g., hot tub, dedicated workspace, EV charger) in your listing description and photos.
- Regularly check competitor amenities in Redington Shores to stay competitive.
Redington Shores Airbnb Guest Demographics & Profile Analysis (2026)
Guest Profile Summary for Redington Shores
- The typical guest profile for Airbnb in Redington Shores consists of primarily domestic travelers (98%), often arriving from nearby Tampa, typically belonging to the Post-2000s (Gen Z/Alpha) group (50%), primarily speaking English or Spanish.
- Domestic travelers account for 97.9% of guests.
- Key international markets include United States (97.9%) and United Kingdom (0.4%).
- Top languages spoken are English (74.6%) followed by Spanish (13.3%).
- A significant demographic segment is the Post-2000s (Gen Z/Alpha) group, representing 50% of guests.
Recommendations for Hosts
- Target domestic marketing efforts towards travelers from Tampa and Orlando.
- Tailor amenities and listing descriptions to appeal to the dominant Post-2000s (Gen Z/Alpha) demographic (e.g., highlight fast WiFi, smart home features, local guides).
- Highlight unique local experiences or amenities relevant to the primary guest profile.
- Consider seasonal promotions aligned with peak travel times for key origin markets.
Nearby Short-Term Rental Market Comparison
How does the Redington Shores Airbnb market stack up against its neighbors? Compare key performance metrics like average monthly revenue, ADR, and occupancy rates in surrounding areas to understand the broader regional STR landscape.
| Market | Active Properties | Monthly Revenue | Daily Rate | Avg. Occupancy |
|---|---|---|---|---|
| Anna Maria island | 587 | $7,996 | $823.96 | 41% |
| Anna Maria | 56 | $6,434 | $692.96 | 52% |
| Reunion | 12 | $6,321 | $580.45 | 44% |
| Boca Grande | 31 | $6,128 | $787.07 | 37% |
| Indian Rocks Beach | 842 | $5,560 | $419.63 | 49% |
| Captiva | 291 | $5,443 | $667.40 | 36% |
| Siesta Key | 1,175 | $5,206 | $518.91 | 42% |
| Belleair Beach | 94 | $5,086 | $339.65 | 53% |
| Bradenton Beach | 122 | $4,977 | $507.12 | 42% |
| Thonotosassa | 17 | $4,309 | $347.75 | 50% |