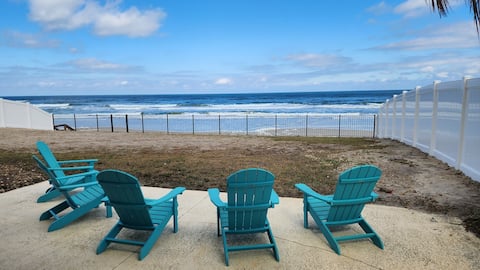
Ponce Inlet Airbnb Market Analysis 2026: Short Term Rental Data & Vacation Rental Statistics in Florida, United States
Is Airbnb profitable in Ponce Inlet in 2026? Explore comprehensive Airbnb analytics for Ponce Inlet, Florida, United States to uncover income potential. This 2026 STR market report for Ponce Inlet, based on AirROI data from February 2025 to January 2026, reveals key trends in the niche market of 74 active listings.
Whether you're considering an Airbnb investment in Ponce Inlet, optimizing your existing vacation rental, or exploring rental arbitrage opportunities, understanding the Ponce Inlet Airbnb data is crucial. Leveraging the low regulation environment is key to maximizing your short term rental income potential. Let's dive into the specifics.
Key Ponce Inlet Airbnb Performance Metrics Overview
Monthly Airbnb Revenue Variations & Income Potential in Ponce Inlet (2026)
Understanding the monthly revenue variations for Airbnb listings in Ponce Inlet is key to maximizing your short term rental income potential. Seasonality significantly impacts earnings. Our analysis, based on data from the past 12 months, shows that the peak revenue month for STRs in Ponce Inlet is typically March, while October often presents the lowest earnings, highlighting opportunities for strategic pricing adjustments during shoulder and low seasons. Explore the typical Airbnb income in Ponce Inlet across different performance tiers:
- Best-in-class properties (Top 10%) achieve $8,368+ monthly, often utilizing dynamic pricing and superior guest experiences.
- Strong performing properties (Top 25%) earn $5,924 or more, indicating effective management and desirable locations/amenities.
- Typical properties (Median) generate around $3,601 per month, representing the average market performance.
- Entry-level properties (Bottom 25%) see earnings around $1,825, often with potential for optimization.
Average Monthly Airbnb Earnings Trend in Ponce Inlet
Ponce Inlet Airbnb Occupancy Rate Trends (2026)
Maximize your bookings by understanding the Ponce Inlet STR occupancy trends. Seasonal demand shifts significantly influence how often properties are booked. Typically, Marchsees the highest demand (peak season occupancy), while December experiences the lowest (low season). Effective strategies, like adjusting minimum stays or offering promotions, can boost occupancy during slower periods. Here's how different property tiers perform in Ponce Inlet:
- Best-in-class properties (Top 10%) achieve 87%+ occupancy, indicating high desirability and potentially optimized availability.
- Strong performing properties (Top 25%) maintain 71% or higher occupancy, suggesting good market fit and guest satisfaction.
- Typical properties (Median) have an occupancy rate around 47%.
- Entry-level properties (Bottom 25%) average 24% occupancy, potentially facing higher vacancy.
Average Monthly Occupancy Rate Trend in Ponce Inlet
Average Daily Rate (ADR) Airbnb Trends in Ponce Inlet (2026)
Effective short term rental pricing strategy in Ponce Inlet involves understanding monthly ADR fluctuations. The Average Daily Rate (ADR) for Airbnb in Ponce Inlet typically peaks in June and dips lowest during September. Leveraging Airbnb dynamic pricing tools or strategies based on this seasonality can significantly boost revenue. Here's a look at the typical nightly rates achieved:
- Best-in-class properties (Top 10%) command rates of $467+ per night, often due to premium features or locations.
- Strong performing properties (Top 25%) achieve nightly rates of $301 or more.
- Typical properties (Median) charge around $228 per night.
- Entry-level properties (Bottom 25%) earn around $168 per night.
Average Daily Rate (ADR) Trend by Month in Ponce Inlet
Get Live Ponce Inlet Market Intelligence 👇

Explore Real-time Analytics
Airbnb Seasonality Analysis & Trends in Ponce Inlet (2026)
Peak Season (March, July, April)
- Revenue averages $6,416 per month
- Occupancy rates average 66.1%
- Daily rates average $279
Shoulder Season
- Revenue averages $4,268 per month
- Occupancy maintains around 46.4%
- Daily rates hold near $269
Low Season (January, October, December)
- Revenue drops to average $2,837 per month
- Occupancy decreases to average 34.6%
- Daily rates adjust to average $267
Seasonality Insights for Ponce Inlet
- The Airbnb seasonality in Ponce Inlet shows highly seasonal trends requiring careful strategy. While the sections above show seasonal averages, it's also insightful to look at the extremes:
- During the high season, the absolute peak month showcases Ponce Inlet's highest earning potential, with monthly revenues capable of climbing to $6,967, occupancy reaching a high of 71.7%, and ADRs peaking at $282.
- Conversely, the slowest single month of the year, typically falling within the low season, marks the market's lowest point. In this month, revenue might dip to $2,713, occupancy could drop to 33.6%, and ADRs may adjust down to $255.
- Understanding both the seasonal averages and these monthly peaks and troughs in revenue, occupancy, and ADR is crucial for maximizing your Airbnb profit potential in Ponce Inlet.
Seasonal Strategies for Maximizing Profit
- Peak Season: Maximize revenue through premium pricing and potentially longer minimum stays. Ensure high availability.
- Low Season: Offer competitive pricing, special promotions (e.g., extended stay discounts), and flexible cancellation policies. Target off-season travelers like remote workers or budget-conscious guests.
- Shoulder Seasons: Implement dynamic pricing that balances peak and low rates. Target weekend travelers or specific events. Offer slightly more flexible terms than peak season.
- Regularly analyze your own performance against these Ponce Inlet seasonality benchmarks and adjust your pricing and availability strategy accordingly.
Best Areas for Airbnb Investment in Ponce Inlet (2026)
Exploring the top neighborhoods for short-term rentals in Ponce Inlet? This section highlights key areas, outlining why they are attractive for hosts and guests, along with notable local attractions. Consider these locations based on your target guest profile and investment strategy.
| Neighborhood / Area | Why Host Here? (Target Guests & Appeal) | Key Attractions & Landmarks |
|---|---|---|
| Ponce Inlet Beach | A picturesque beach community known for its sandy shores and tranquil atmosphere. Ideal for families and beachgoers seeking a relaxing getaway with beautiful views. | Ponce Inlet Lighthouse, Mary McLeod Bethune Beach Park, New Smyrna Beach, Ponce Preserve, Speedway |
| Lighthouse Point | This area features breathtaking ocean views and is perfect for guests interested in historic attractions. Visitors appreciate the unique charm and proximity to the coast. | Ponce Inlet Lighthouse, Lighthouse Point Park, Inlet Harbor Marina, Tarpon River, Historical lighthouse tours |
| Atlantic Ocean Drive | A scenic route that offers easy access to the beach and popular local dining. Great for tourists wanting a taste of coastal life. | Beachfront dining, Ponce Inlet piers, Watersports activities, Sunset views, Walking/biking trails |
| Old Ponce Inlet | Known for its rich history and quaint homes, it attracts visitors who appreciate cultural heritage and local art. An intimate area with a strong community feel. | Old Ponce Inlet Neighborhood, Art galleries, Local festivals, Historic sites, Cozy cafes |
| Inlet Harbor | A vibrant area famous for its fishing and boating community. Best suited for water enthusiasts and those looking to explore marine activities. | Fishing charters, Boat rentals, Inlet Harbor Marina, Scenic boat tours, Wildlife observation |
| Ponce Preserve | This nature preserve offers a peaceful retreat with walking trails and wildlife. Ideal for nature lovers and those who enjoy outdoor activities. | Nature trails, Wildlife observation, Picnic areas, Historical sites, Eco-tours |
| South Peninsula | This part of Ponce Inlet is quiet and family-friendly, making it perfect for relaxing vacations away from the hustle and bustle of larger tourist areas. | Family-friendly beaches, Parks, Local shops, Playgrounds, Community events |
| Speedway Boulevard | Close to the Daytona International Speedway, attracting racing fans and event-goers. Perfect location for sports enthusiasts looking to experience local events. | Daytona International Speedway, Racing events, Nearby attractions, Sporting activities, Local nightlife |
Understanding Airbnb License Requirements & STR Laws in Ponce Inlet (2026)
While Ponce Inlet, Florida, United States currently shows low STR regulations, specific Airbnb license requirements might still exist or change. Always verify the latest short term rental regulations and Airbnb license requirements directly with local government authorities for Ponce Inlet to ensure full compliance before hosting.
(Source: AirROI data, 2026, finding no licensed listings among those analyzed)
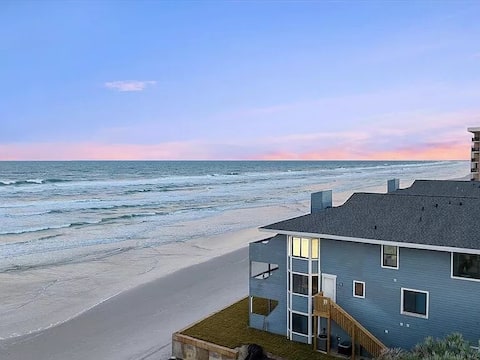
Top Performing Airbnb Properties in Ponce Inlet (2026)
Benchmark your potential! Explore examples of top-performing Airbnb properties in Ponce Inletbased on Trailing Twelve Month (TTM) revenue. Analyze their characteristics, revenue, occupancy rate, and ADR to understand what drives success in this market.
"Ocean Waves" - Direct Oceanfront Beach House
Entire Place • 6 bedrooms

Private Multi-Million Dollar Riverfront Retreat
Entire Place • 4 bedrooms

Wow! Oceanfront 2BR2BA KING STE PonceInlet FAV
Entire Place • 2 bedrooms

Sunrise Solitude Oceanfront Beach Condo with Pool
Entire Place • 2 bedrooms
Ponce Inlet Villa on Preserve Beach
Entire Place • 3 bedrooms

Sandcastle Harbor Pool & FirePit
Entire Place • 3 bedrooms
Note: Performance varies based on location, size, amenities, seasonality, and management quality. Data reflects the past 12 months.
Top Performing Airbnb Hosts in Ponce Inlet (2026)
Learn from the best! This table showcases top-performing Airbnb hosts in Ponce Inlet based on the number of properties managed and estimated total revenue over the past year. Analyze their scale and performance metrics.
| Host Name | Properties | Grossing Revenue | Stay Reviews | Avg Rating |
|---|---|---|---|---|
| Bree | 4 | $277,673 | 397 | 4.96/5.0 |
| Candy & John | 1 | $151,237 | 17 | 5.00/5.0 |
| Salty | 5 | $143,268 | 23 | 4.90/5.0 |
| Lucas | 1 | $127,504 | 24 | 4.92/5.0 |
| Ana | 1 | $104,278 | 25 | 5.00/5.0 |
| Lizette | 1 | $87,395 | 18 | 4.83/5.0 |
| Salty Dog | 1 | $87,174 | 14 | 5.00/5.0 |
| Julie | 1 | $65,869 | 112 | 4.99/5.0 |
| Dean | 1 | $63,785 | 49 | 4.92/5.0 |
| Oceans Luxury Vacations | 3 | $62,314 | 35 | 4.27/5.0 |
Analyzing the strategies of top hosts, such as their property selection, pricing, and guest communication, can offer valuable lessons for optimizing your own Airbnb operations in Ponce Inlet.
Dive Deeper: Advanced Ponce Inlet STR Market Data (2026)
Ready to unlock more insights? AirROI provides access to advanced metrics and comprehensive Airbnb data for Ponce Inlet. Explore detailed analytics beyond this report to refine your investment strategy, optimize pricing, and maximize your vacation rental profits.
Explore Advanced MetricsPonce Inlet Short-Term Rental Market Composition (2026): Property & Room Types
Room Type Distribution
Property Type Distribution
Market Composition Insights for Ponce Inlet
- The Ponce Inlet Airbnb market composition is heavily skewed towards Entire Home/Apt listings, which make up 100% of the 74 active rentals. This indicates strong guest preference for privacy and space.
- Looking at the property type distribution in Ponce Inlet, Apartment/Condo properties are the most common (64.9%), reflecting the local real estate landscape.
- Houses represent a significant 33.8% portion, catering likely to families or larger groups.
- Smaller segments like hotel/boutique (combined 1.4%) offer potential for unique stay experiences.
Ponce Inlet Airbnb Room Capacity Analysis (2026): Bedroom Distribution
Distribution of Listings by Number of Bedrooms
Room Capacity Insights for Ponce Inlet
- The dominant room capacity in Ponce Inlet is 2 bedrooms listings, making up 64.9% of the market. This suggests a strong demand for properties suitable for couples or solo travelers.
- Together, 2 bedrooms and 3 bedrooms properties represent 86.5% of the active Airbnb listings in Ponce Inlet, indicating a high concentration in these sizes.
- A significant 32.5% of listings offer 3+ bedrooms, catering to larger groups and families seeking more space in Ponce Inlet.
Ponce Inlet Vacation Rental Guest Capacity Trends (2026)
Distribution of Listings by Guest Capacity
Guest Capacity Insights for Ponce Inlet
- The most common guest capacity trend in Ponce Inlet vacation rentals is listings accommodating 6 guests (25.7%). This suggests the primary traveler segment is likely larger groups.
- Properties designed for 6 guests and 8+ guests dominate the Ponce Inlet STR market, accounting for 50.0% of listings.
- 60.8% of properties accommodate 6+ guests, serving the market segment for larger families or group travel in Ponce Inlet.
- On average, properties in Ponce Inlet are equipped to host 5.9 guests.
Ponce Inlet Airbnb Booking Patterns (2026): Available vs. Booked Days
Available Days Distribution
Booked Days Distribution
Booking Pattern Insights for Ponce Inlet
- The most common availability pattern in Ponce Inlet falls within the 271-366 days range, representing 54.1% of listings. This suggests many properties have significant open periods on their calendars.
- Approximately 78.4% of listings show high availability (181+ days open annually), indicating potential for increased bookings or specific owner usage patterns.
- For booked days, the 31-90 days range is most frequent in Ponce Inlet (28.4%), reflecting common guest stay durations or potential owner blocking patterns.
- A notable 21.6% of properties secure long booking periods (181+ days booked per year), highlighting successful long-term rental strategies or significant owner usage.
Ponce Inlet Airbnb Minimum Stay Requirements Analysis
Distribution of Listings by Minimum Night Requirement
2 Nights
2 listings
2.7% of total
3 Nights
10 listings
13.5% of total
4-6 Nights
6 listings
8.1% of total
7-29 Nights
33 listings
44.6% of total
30+ Nights
23 listings
31.1% of total
Key Insights
- The most prevalent minimum stay requirement in Ponce Inlet is 7-29 Nights, adopted by 44.6% of listings. This highlights the market's preference for shorter, flexible bookings.
- Very short stays (1-2 nights) are less common (2.7%), suggesting hosts prefer slightly longer bookings to optimize turnover.
- A significant segment (31.1%) caters to monthly stays (30+ nights) in Ponce Inlet, pointing to opportunities in the extended-stay market.
Recommendations
- Align with the market by considering a 7-29 Nights minimum stay, as 44.6% of Ponce Inlet hosts use this setting.
- Explore offering discounts for stays of 30+ nights to attract the 31.1% of the market seeking extended stays.
- Adjust minimum nights based on seasonality – potentially shorter during low season and longer during peak demand periods in Ponce Inlet.
Ponce Inlet Airbnb Cancellation Policy Trends Analysis (2026)
Limited
1 listings
1.4% of total
Super Strict 30 Days
1 listings
1.4% of total
Flexible
6 listings
8.2% of total
Moderate
13 listings
17.8% of total
Firm
39 listings
53.4% of total
Strict
13 listings
17.8% of total
Cancellation Policy Insights for Ponce Inlet
- The prevailing Airbnb cancellation policy trend in Ponce Inlet is Firm, used by 53.4% of listings.
- A majority (71.2%) of hosts in Ponce Inlet utilize Firm or Strict policies, indicating a market where hosts prioritize booking security.
Recommendations for Hosts
- Consider adopting a Firm policy to align with the 53.4% market standard in Ponce Inlet.
- Regularly review your cancellation policy against competitors and market demand shifts in Ponce Inlet.
Ponce Inlet STR Booking Lead Time Analysis (2026)
Average Booking Lead Time by Month
Booking Lead Time Insights for Ponce Inlet
- The overall average booking lead time for vacation rentals in Ponce Inlet is 87 days.
- Guests book furthest in advance for stays during March (average 136 days), likely coinciding with peak travel demand or local events.
- The shortest booking windows occur for stays in September (average 39 days), indicating more last-minute travel plans during this time.
- Seasonally, Winter (105 days avg.) sees the longest lead times, while Fall (49 days avg.) has the shortest, reflecting typical travel planning cycles.
Recommendations for Hosts
- Use the overall average lead time (87 days) as a baseline for your pricing and availability strategy in Ponce Inlet.
- For March stays, consider implementing length-of-stay discounts or slightly higher rates for bookings made less than 136 days out to capitalize on advance planning.
- Target marketing efforts for the Winter season well in advance (at least 105 days) to capture early planners.
- Monitor your own booking lead times against these Ponce Inlet averages to identify opportunities for dynamic pricing adjustments.
Popular & Essential Airbnb Amenities in Ponce Inlet (2026)
Amenity Prevalence
Amenity Insights for Ponce Inlet
- Essential amenities in Ponce Inlet that guests expect include: Wifi, Air conditioning, Kitchen, Free parking on premises, TV, Smoke alarm, Washer. Lacking these (any) could significantly impact bookings.
- Popular amenities like Refrigerator, Dishes and silverware, Microwave are common but not universal. Offering these can provide a competitive edge.
Recommendations for Hosts
- Ensure your listing includes all essential amenities for Ponce Inlet: Wifi, Air conditioning, Kitchen, Free parking on premises, TV, Smoke alarm, Washer.
- Prioritize adding missing essentials: Free parking on premises, TV, Smoke alarm, Washer.
- Consider adding popular differentiators like Refrigerator or Dishes and silverware to increase appeal.
- Highlight unique or less common amenities you offer (e.g., hot tub, dedicated workspace, EV charger) in your listing description and photos.
- Regularly check competitor amenities in Ponce Inlet to stay competitive.
Ponce Inlet Airbnb Guest Demographics & Profile Analysis (2026)
Guest Profile Summary for Ponce Inlet
- The typical guest profile for Airbnb in Ponce Inlet consists of primarily domestic travelers (97%), often arriving from nearby Orlando, typically belonging to the Post-2000s (Gen Z/Alpha) group (50%), primarily speaking English or Spanish.
- Domestic travelers account for 97.1% of guests.
- Key international markets include United States (97.1%) and Canada (1.2%).
- Top languages spoken are English (80.2%) followed by Spanish (6.6%).
- A significant demographic segment is the Post-2000s (Gen Z/Alpha) group, representing 50% of guests.
Recommendations for Hosts
- Target domestic marketing efforts towards travelers from Orlando and New York.
- Tailor amenities and listing descriptions to appeal to the dominant Post-2000s (Gen Z/Alpha) demographic (e.g., highlight fast WiFi, smart home features, local guides).
- Highlight unique local experiences or amenities relevant to the primary guest profile.
- Consider seasonal promotions aligned with peak travel times for key origin markets.
Nearby Short-Term Rental Market Comparison
How does the Ponce Inlet Airbnb market stack up against its neighbors? Compare key performance metrics like average monthly revenue, ADR, and occupancy rates in surrounding areas to understand the broader regional STR landscape.
| Market | Active Properties | Monthly Revenue | Daily Rate | Avg. Occupancy |
|---|---|---|---|---|
| St. Johns County | 12 | $6,964 | $592.43 | 47% |
| Reunion | 12 | $6,321 | $580.45 | 44% |
| Ponte Vedra Beach | 224 | $5,720 | $574.75 | 43% |
| Vilano Beach | 173 | $5,571 | $442.95 | 45% |
| Melbourne Beach | 275 | $5,384 | $488.83 | 43% |
| Jacksonville Beach | 763 | $4,123 | $328.32 | 49% |
| Campbell | 22 | $4,011 | $343.05 | 51% |
| Indian Harbour Beach | 131 | $3,895 | $289.71 | 50% |
| Cocoa Beach | 983 | $3,883 | $307.17 | 48% |
| Indialantic | 59 | $3,861 | $352.33 | 44% |