Pompano Beach Airbnb Market Analysis 2026: Short Term Rental Data & Vacation Rental Statistics in Florida, United States
Is Airbnb profitable in Pompano Beach in 2026? Explore comprehensive Airbnb analytics for Pompano Beach, Florida, United States to uncover income potential. This 2026 STR market report for Pompano Beach, based on AirROI data from February 2025 to January 2026, reveals key trends in the bustling market of 1,319 active listings.
Whether you're considering an Airbnb investment in Pompano Beach, optimizing your existing vacation rental, or exploring rental arbitrage opportunities, understanding the Pompano Beach Airbnb data is crucial. Leveraging the low regulation environment is key to maximizing your short term rental income potential. Let's dive into the specifics.
Key Pompano Beach Airbnb Performance Metrics Overview
Monthly Airbnb Revenue Variations & Income Potential in Pompano Beach (2026)
Understanding the monthly revenue variations for Airbnb listings in Pompano Beach is key to maximizing your short term rental income potential. Seasonality significantly impacts earnings. Our analysis, based on data from the past 12 months, shows that the peak revenue month for STRs in Pompano Beach is typically March, while September often presents the lowest earnings, highlighting opportunities for strategic pricing adjustments during shoulder and low seasons. Explore the typical Airbnb income in Pompano Beach across different performance tiers:
- Best-in-class properties (Top 10%) achieve $10,024+ monthly, often utilizing dynamic pricing and superior guest experiences.
- Strong performing properties (Top 25%) earn $6,102 or more, indicating effective management and desirable locations/amenities.
- Typical properties (Median) generate around $3,067 per month, representing the average market performance.
- Entry-level properties (Bottom 25%) see earnings around $1,410, often with potential for optimization.
Average Monthly Airbnb Earnings Trend in Pompano Beach
Pompano Beach Airbnb Occupancy Rate Trends (2026)
Maximize your bookings by understanding the Pompano Beach STR occupancy trends. Seasonal demand shifts significantly influence how often properties are booked. Typically, Marchsees the highest demand (peak season occupancy), while September experiences the lowest (low season). Effective strategies, like adjusting minimum stays or offering promotions, can boost occupancy during slower periods. Here's how different property tiers perform in Pompano Beach:
- Best-in-class properties (Top 10%) achieve 84%+ occupancy, indicating high desirability and potentially optimized availability.
- Strong performing properties (Top 25%) maintain 71% or higher occupancy, suggesting good market fit and guest satisfaction.
- Typical properties (Median) have an occupancy rate around 47%.
- Entry-level properties (Bottom 25%) average 24% occupancy, potentially facing higher vacancy.
Average Monthly Occupancy Rate Trend in Pompano Beach
Average Daily Rate (ADR) Airbnb Trends in Pompano Beach (2026)
Effective short term rental pricing strategy in Pompano Beach involves understanding monthly ADR fluctuations. The Average Daily Rate (ADR) for Airbnb in Pompano Beach typically peaks in December and dips lowest during August. Leveraging Airbnb dynamic pricing tools or strategies based on this seasonality can significantly boost revenue. Here's a look at the typical nightly rates achieved:
- Best-in-class properties (Top 10%) command rates of $513+ per night, often due to premium features or locations.
- Strong performing properties (Top 25%) achieve nightly rates of $344 or more.
- Typical properties (Median) charge around $217 per night.
- Entry-level properties (Bottom 25%) earn around $148 per night.
Average Daily Rate (ADR) Trend by Month in Pompano Beach
Get Live Pompano Beach Market Intelligence 👇

Explore Real-time Analytics
Airbnb Seasonality Analysis & Trends in Pompano Beach (2026)
Peak Season (March, February, December)
- Revenue averages $6,220 per month
- Occupancy rates average 58.5%
- Daily rates average $316
Shoulder Season
- Revenue averages $4,197 per month
- Occupancy maintains around 45.6%
- Daily rates hold near $284
Low Season (May, September, October)
- Revenue drops to average $3,524 per month
- Occupancy decreases to average 40.9%
- Daily rates adjust to average $269
Seasonality Insights for Pompano Beach
- The Airbnb seasonality in Pompano Beach shows highly seasonal trends requiring careful strategy. While the sections above show seasonal averages, it's also insightful to look at the extremes:
- During the high season, the absolute peak month showcases Pompano Beach's highest earning potential, with monthly revenues capable of climbing to $6,957, occupancy reaching a high of 67.8%, and ADRs peaking at $346.
- Conversely, the slowest single month of the year, typically falling within the low season, marks the market's lowest point. In this month, revenue might dip to $3,090, occupancy could drop to 38.1%, and ADRs may adjust down to $258.
- Understanding both the seasonal averages and these monthly peaks and troughs in revenue, occupancy, and ADR is crucial for maximizing your Airbnb profit potential in Pompano Beach.
Seasonal Strategies for Maximizing Profit
- Peak Season: Maximize revenue through premium pricing and potentially longer minimum stays. Ensure high availability.
- Low Season: Offer competitive pricing, special promotions (e.g., extended stay discounts), and flexible cancellation policies. Target off-season travelers like remote workers or budget-conscious guests.
- Shoulder Seasons: Implement dynamic pricing that balances peak and low rates. Target weekend travelers or specific events. Offer slightly more flexible terms than peak season.
- Regularly analyze your own performance against these Pompano Beach seasonality benchmarks and adjust your pricing and availability strategy accordingly.
Best Areas for Airbnb Investment in Pompano Beach (2026)
Exploring the top neighborhoods for short-term rentals in Pompano Beach? This section highlights key areas, outlining why they are attractive for hosts and guests, along with notable local attractions. Consider these locations based on your target guest profile and investment strategy.
| Neighborhood / Area | Why Host Here? (Target Guests & Appeal) | Key Attractions & Landmarks |
|---|---|---|
| Deerfield Beach | A popular family-friendly beach destination with a picturesque pier and calm waters. It attracts tourists seeking a relaxed beach atmosphere and various recreational activities. | Deerfield Beach International Fishing Pier, Quiet Waters Park, Sullivan Park, The Cove Shopping Center |
| Hillsboro Beach | Known for its upscale waterfront properties and pristine beaches, Hillsboro Beach offers serene surroundings and a luxurious feel, making it appealing for high-end travelers. | Hillsboro Lighthouse, North Beach Park, Hillsboro Beach, Intracoastal Waterway views |
| Lauderdale-by-the-Sea | A charming coastal town with beautiful beaches and a vibrant arts scene. It is less commercial than nearby areas, attracting those looking for a quaint beach getaway. | Anglin's Fishing Pier, Lauderdale-by-the-Sea Beach, Sealife Park, Diverse dining options |
| Pompano Beach | The heart of Pompano Beach boasts beautiful public beaches, a blossoming cultural scene, and easy access to water sports, making it an ideal spot for tourists. | Pompano Beach Pier, Pompano Beach Parks and Recreation, Sample-McDougald House, Pompano Citi Centre |
| Cypress Creek | A growing area with proximity to commercial districts and entertainment, attractive for business travelers and those seeking more urban Airbnb options. | The Promenade at Coconut Creek, Local shopping and dining, Nearby parks |
| Coconut Creek | Home to nature reserves and plenty of shopping, Coconut Creek attracts families and outdoor enthusiasts, providing a peaceful environment close to urban amenities. | Butterfly World, Coconut Creek Community Center, Local parks |
| Fort Lauderdale | Just south of Pompano Beach, Fort Lauderdale is known for its boating canals and stunning beaches, attracting both tourists and business travelers alike. | Las Olas Boulevard, Fort Lauderdale Beach, Broward Center for the Performing Arts |
| Boca Raton | Located to the south, Boca Raton is known for its luxury shopping and beautiful parks, appealing to a more affluent crowd seeking upscale Airbnb accommodations. | Mizner Park, Gumbo Limbo Nature Center, Boca Raton Museum of Art |
Understanding Airbnb License Requirements & STR Laws in Pompano Beach (2026)
While Pompano Beach, Florida, United States currently shows low STR regulations, specific Airbnb license requirements might still exist or change. Always verify the latest short term rental regulations and Airbnb license requirements directly with local government authorities for Pompano Beach to ensure full compliance before hosting.
(Source: AirROI data, 2026, based on 0% licensed listings)
Top Performing Airbnb Properties in Pompano Beach (2026)
Benchmark your potential! Explore examples of top-performing Airbnb properties in Pompano Beachbased on Trailing Twelve Month (TTM) revenue. Analyze their characteristics, revenue, occupancy rate, and ADR to understand what drives success in this market.
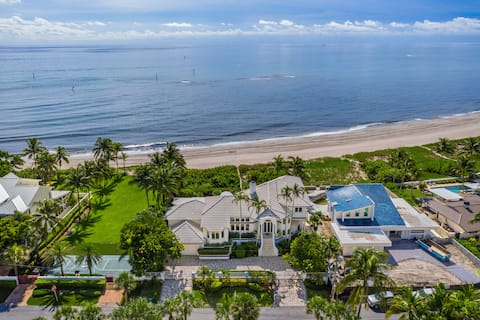
Luxury Oceanfront - Managed By Brampton Park
Entire Place • 6 bedrooms
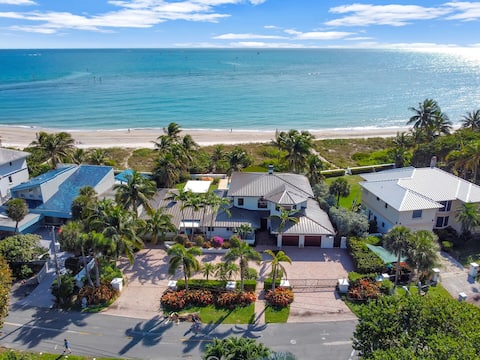
2200 Stunning Oceanfront | by Brampton Park
Entire Place • 5 bedrooms
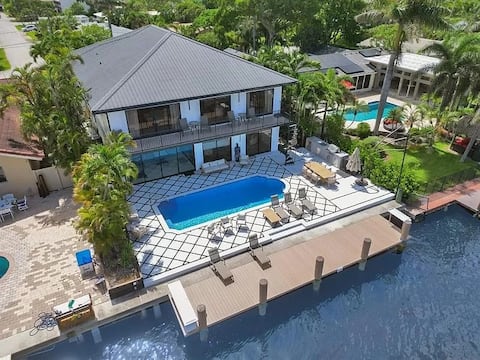
Modern Mansion on the Water!
Entire Place • 5 bedrooms
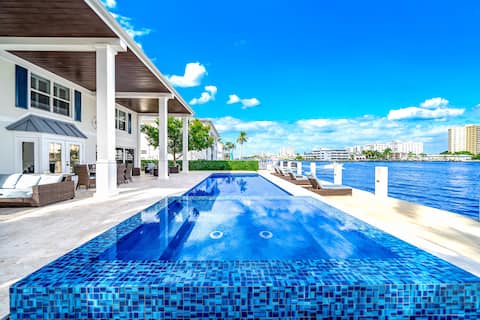
Waterfront Gem! Heated Pool+HotTub! Close 2 Beach!
Entire Place • 5 bedrooms
8BR Resort w/ Pool & Tons of Games - 22 Guests
Entire Place • 8 bedrooms
Private Beach Access-Heated Pool-Tiki Hut-Grill
Entire Place • 4 bedrooms
Note: Performance varies based on location, size, amenities, seasonality, and management quality. Data reflects the past 12 months.
Top Performing Airbnb Hosts in Pompano Beach (2026)
Learn from the best! This table showcases top-performing Airbnb hosts in Pompano Beach based on the number of properties managed and estimated total revenue over the past year. Analyze their scale and performance metrics.
| Host Name | Properties | Grossing Revenue | Stay Reviews | Avg Rating |
|---|---|---|---|---|
| BG Luxe Properties | 26 | $2,679,227 | 1440 | 4.85/5.0 |
| Brampton Park | 11 | $2,034,241 | 131 | 4.94/5.0 |
| Designedvr | 10 | $940,956 | 730 | 4.79/5.0 |
| Maor Maier | 11 | $608,963 | 697 | 4.89/5.0 |
| Nicholette | 8 | $559,938 | 614 | 4.80/5.0 |
| Deen. | 4 | $550,696 | 183 | 4.66/5.0 |
| Andres And Gabrielle | 7 | $547,465 | 265 | 4.98/5.0 |
| IRenta | 8 | $531,696 | 273 | 4.86/5.0 |
| Grace | 6 | $511,454 | 351 | 4.94/5.0 |
| Live Suite | 43 | $509,512 | 361 | 4.66/5.0 |
Analyzing the strategies of top hosts, such as their property selection, pricing, and guest communication, can offer valuable lessons for optimizing your own Airbnb operations in Pompano Beach.
Dive Deeper: Advanced Pompano Beach STR Market Data (2026)
Ready to unlock more insights? AirROI provides access to advanced metrics and comprehensive Airbnb data for Pompano Beach. Explore detailed analytics beyond this report to refine your investment strategy, optimize pricing, and maximize your vacation rental profits.
Explore Advanced MetricsPompano Beach Short-Term Rental Market Composition (2026): Property & Room Types
Room Type Distribution
Property Type Distribution
Market Composition Insights for Pompano Beach
- The Pompano Beach Airbnb market composition is heavily skewed towards Entire Home/Apt listings, which make up 91.1% of the 1,319 active rentals. This indicates strong guest preference for privacy and space.
- Looking at the property type distribution in Pompano Beach, Apartment/Condo properties are the most common (47.3%), reflecting the local real estate landscape.
- Houses represent a significant 44.3% portion, catering likely to families or larger groups.
- The presence of 6.4% Hotel/Boutique listings indicates integration with traditional hospitality.
- Smaller segments like others, outdoor/unique (combined 2.1%) offer potential for unique stay experiences.
Pompano Beach Airbnb Room Capacity Analysis (2026): Bedroom Distribution
Distribution of Listings by Number of Bedrooms
Room Capacity Insights for Pompano Beach
- The dominant room capacity in Pompano Beach is 1 bedroom listings, making up 29.3% of the market. This suggests a strong demand for properties suitable for couples or solo travelers.
- Together, 1 bedroom and 2 bedrooms properties represent 56.4% of the active Airbnb listings in Pompano Beach, indicating a high concentration in these sizes.
- A significant 31.8% of listings offer 3+ bedrooms, catering to larger groups and families seeking more space in Pompano Beach.
Pompano Beach Vacation Rental Guest Capacity Trends (2026)
Distribution of Listings by Guest Capacity
Guest Capacity Insights for Pompano Beach
- The most common guest capacity trend in Pompano Beach vacation rentals is listings accommodating 8+ guests (24.6%). This suggests the primary traveler segment is likely larger groups.
- Properties designed for 8+ guests and 6 guests dominate the Pompano Beach STR market, accounting for 47.3% of listings.
- 49.2% of properties accommodate 6+ guests, serving the market segment for larger families or group travel in Pompano Beach.
- On average, properties in Pompano Beach are equipped to host 5.0 guests.
Pompano Beach Airbnb Booking Patterns (2026): Available vs. Booked Days
Available Days Distribution
Booked Days Distribution
Booking Pattern Insights for Pompano Beach
- The most common availability pattern in Pompano Beach falls within the 271-366 days range, representing 47.5% of listings. This suggests many properties have significant open periods on their calendars.
- Approximately 73.2% of listings show high availability (181+ days open annually), indicating potential for increased bookings or specific owner usage patterns.
- For booked days, the 31-90 days range is most frequent in Pompano Beach (28.5%), reflecting common guest stay durations or potential owner blocking patterns.
- A notable 27.9% of properties secure long booking periods (181+ days booked per year), highlighting successful long-term rental strategies or significant owner usage.
Pompano Beach Airbnb Minimum Stay Requirements Analysis
Distribution of Listings by Minimum Night Requirement
1 Night
143 listings
10.8% of total
2 Nights
317 listings
24% of total
3 Nights
156 listings
11.8% of total
4-6 Nights
153 listings
11.6% of total
7-29 Nights
52 listings
3.9% of total
30+ Nights
498 listings
37.8% of total
Key Insights
- The most prevalent minimum stay requirement in Pompano Beach is 30+ Nights, adopted by 37.8% of listings. This highlights the market's preference for longer commitments.
- A significant segment (37.8%) caters to monthly stays (30+ nights) in Pompano Beach, pointing to opportunities in the extended-stay market.
Recommendations
- Align with the market by considering a 30+ Nights minimum stay, as 37.8% of Pompano Beach hosts use this setting.
- If feasible, allowing 1-night stays, especially midweek or during low season, could capture last-minute bookings, as only 10.8% currently do.
- Explore offering discounts for stays of 30+ nights to attract the 37.8% of the market seeking extended stays.
- Adjust minimum nights based on seasonality – potentially shorter during low season and longer during peak demand periods in Pompano Beach.
Pompano Beach Airbnb Cancellation Policy Trends Analysis (2026)
Limited
20 listings
1.5% of total
Refundable
2 listings
0.2% of total
Non-refundable
1 listings
0.1% of total
Super Strict 30 Days
59 listings
4.5% of total
Super Strict 60 Days
9 listings
0.7% of total
Flexible
172 listings
13.1% of total
Moderate
255 listings
19.3% of total
Firm
484 listings
36.7% of total
Strict
316 listings
24% of total
Cancellation Policy Insights for Pompano Beach
- The prevailing Airbnb cancellation policy trend in Pompano Beach is Firm, used by 36.7% of listings.
- A majority (60.7%) of hosts in Pompano Beach utilize Firm or Strict policies, indicating a market where hosts prioritize booking security.
Recommendations for Hosts
- Consider adopting a Firm policy to align with the 36.7% market standard in Pompano Beach.
- Regularly review your cancellation policy against competitors and market demand shifts in Pompano Beach.
Pompano Beach STR Booking Lead Time Analysis (2026)
Average Booking Lead Time by Month
Booking Lead Time Insights for Pompano Beach
- The overall average booking lead time for vacation rentals in Pompano Beach is 43 days.
- Guests book furthest in advance for stays during February (average 71 days), likely coinciding with peak travel demand or local events.
- The shortest booking windows occur for stays in September (average 28 days), indicating more last-minute travel plans during this time.
- Seasonally, Winter (61 days avg.) sees the longest lead times, while Summer (30 days avg.) has the shortest, reflecting typical travel planning cycles.
Recommendations for Hosts
- Use the overall average lead time (43 days) as a baseline for your pricing and availability strategy in Pompano Beach.
- For February stays, consider implementing length-of-stay discounts or slightly higher rates for bookings made less than 71 days out to capitalize on advance planning.
- Target marketing efforts for the Winter season well in advance (at least 61 days) to capture early planners.
- Monitor your own booking lead times against these Pompano Beach averages to identify opportunities for dynamic pricing adjustments.
Popular & Essential Airbnb Amenities in Pompano Beach (2026)
Amenity Prevalence
Amenity Insights for Pompano Beach
- Essential amenities in Pompano Beach that guests expect include: Air conditioning, Wifi, TV, Smoke alarm, Free parking on premises. Lacking these (any) could significantly impact bookings.
- Popular amenities like Kitchen, Hot water, Hair dryer are common but not universal. Offering these can provide a competitive edge.
Recommendations for Hosts
- Ensure your listing includes all essential amenities for Pompano Beach: Air conditioning, Wifi, TV, Smoke alarm, Free parking on premises.
- Prioritize adding missing essentials: Air conditioning, Wifi, TV, Smoke alarm, Free parking on premises.
- Consider adding popular differentiators like Kitchen or Hot water to increase appeal.
- Highlight unique or less common amenities you offer (e.g., hot tub, dedicated workspace, EV charger) in your listing description and photos.
- Regularly check competitor amenities in Pompano Beach to stay competitive.
Pompano Beach Airbnb Guest Demographics & Profile Analysis (2026)
Guest Profile Summary for Pompano Beach
- The typical guest profile for Airbnb in Pompano Beach consists of primarily domestic travelers (85%), often arriving from nearby New York, typically belonging to the Post-2000s (Gen Z/Alpha) group (50%), primarily speaking English or Spanish.
- Domestic travelers account for 85.0% of guests.
- Key international markets include United States (85%) and Canada (4.8%).
- Top languages spoken are English (63.9%) followed by Spanish (17%).
- A significant demographic segment is the Post-2000s (Gen Z/Alpha) group, representing 50% of guests.
Recommendations for Hosts
- Target domestic marketing efforts towards travelers from New York and Miami.
- Tailor amenities and listing descriptions to appeal to the dominant Post-2000s (Gen Z/Alpha) demographic (e.g., highlight fast WiFi, smart home features, local guides).
- Highlight unique local experiences or amenities relevant to the primary guest profile.
- Consider seasonal promotions aligned with peak travel times for key origin markets.
Nearby Short-Term Rental Market Comparison
How does the Pompano Beach Airbnb market stack up against its neighbors? Compare key performance metrics like average monthly revenue, ADR, and occupancy rates in surrounding areas to understand the broader regional STR landscape.
| Market | Active Properties | Monthly Revenue | Daily Rate | Avg. Occupancy |
|---|---|---|---|---|
| Sailfish Point | 19 | $16,709 | $1587.63 | 48% |
| Bal Harbour Village | 37 | $8,846 | $850.63 | 34% |
| Lake Clarke Shores | 26 | $6,710 | $516.52 | 46% |
| Lighthouse Point | 75 | $6,205 | $472.94 | 51% |
| Pinecrest | 11 | $6,117 | $861.24 | 43% |
| North Bay Village | 120 | $6,032 | $561.12 | 44% |
| Tequesta | 43 | $4,920 | $376.96 | 50% |
| Juno Beach | 39 | $4,807 | $377.00 | 47% |
| Parkland | 17 | $4,637 | $369.21 | 47% |
| Ocean Ridge | 14 | $4,588 | $602.78 | 48% |