Pembroke Pines Airbnb Market Analysis 2026: Short Term Rental Data & Vacation Rental Statistics in Florida, United States
Is Airbnb profitable in Pembroke Pines in 2026? Explore comprehensive Airbnb analytics for Pembroke Pines, Florida, United States to uncover income potential. This 2026 STR market report for Pembroke Pines, based on AirROI data from February 2025 to January 2026, reveals key trends in the niche market of 160 active listings.
Whether you're considering an Airbnb investment in Pembroke Pines, optimizing your existing vacation rental, or exploring rental arbitrage opportunities, understanding the Pembroke Pines Airbnb data is crucial. Leveraging the low regulation environment is key to maximizing your short term rental income potential. Let's dive into the specifics.
Key Pembroke Pines Airbnb Performance Metrics Overview
Monthly Airbnb Revenue Variations & Income Potential in Pembroke Pines (2026)
Understanding the monthly revenue variations for Airbnb listings in Pembroke Pines is key to maximizing your short term rental income potential. Seasonality significantly impacts earnings. Our analysis, based on data from the past 12 months, shows that the peak revenue month for STRs in Pembroke Pines is typically March, while September often presents the lowest earnings, highlighting opportunities for strategic pricing adjustments during shoulder and low seasons. Explore the typical Airbnb income in Pembroke Pines across different performance tiers:
- Best-in-class properties (Top 10%) achieve $7,893+ monthly, often utilizing dynamic pricing and superior guest experiences.
- Strong performing properties (Top 25%) earn $4,480 or more, indicating effective management and desirable locations/amenities.
- Typical properties (Median) generate around $2,150 per month, representing the average market performance.
- Entry-level properties (Bottom 25%) see earnings around $1,068, often with potential for optimization.
Average Monthly Airbnb Earnings Trend in Pembroke Pines
Pembroke Pines Airbnb Occupancy Rate Trends (2026)
Maximize your bookings by understanding the Pembroke Pines STR occupancy trends. Seasonal demand shifts significantly influence how often properties are booked. Typically, Marchsees the highest demand (peak season occupancy), while September experiences the lowest (low season). Effective strategies, like adjusting minimum stays or offering promotions, can boost occupancy during slower periods. Here's how different property tiers perform in Pembroke Pines:
- Best-in-class properties (Top 10%) achieve 86%+ occupancy, indicating high desirability and potentially optimized availability.
- Strong performing properties (Top 25%) maintain 73% or higher occupancy, suggesting good market fit and guest satisfaction.
- Typical properties (Median) have an occupancy rate around 51%.
- Entry-level properties (Bottom 25%) average 27% occupancy, potentially facing higher vacancy.
Average Monthly Occupancy Rate Trend in Pembroke Pines
Average Daily Rate (ADR) Airbnb Trends in Pembroke Pines (2026)
Effective short term rental pricing strategy in Pembroke Pines involves understanding monthly ADR fluctuations. The Average Daily Rate (ADR) for Airbnb in Pembroke Pines typically peaks in December and dips lowest during September. Leveraging Airbnb dynamic pricing tools or strategies based on this seasonality can significantly boost revenue. Here's a look at the typical nightly rates achieved:
- Best-in-class properties (Top 10%) command rates of $456+ per night, often due to premium features or locations.
- Strong performing properties (Top 25%) achieve nightly rates of $263 or more.
- Typical properties (Median) charge around $124 per night.
- Entry-level properties (Bottom 25%) earn around $79 per night.
Average Daily Rate (ADR) Trend by Month in Pembroke Pines
Get Live Pembroke Pines Market Intelligence 👇

Explore Real-time Analytics
Airbnb Seasonality Analysis & Trends in Pembroke Pines (2026)
Peak Season (March, February, December)
- Revenue averages $4,448 per month
- Occupancy rates average 59.1%
- Daily rates average $239
Shoulder Season
- Revenue averages $3,536 per month
- Occupancy maintains around 48.0%
- Daily rates hold near $221
Low Season (January, September, October)
- Revenue drops to average $3,010 per month
- Occupancy decreases to average 45.4%
- Daily rates adjust to average $214
Seasonality Insights for Pembroke Pines
- The Airbnb seasonality in Pembroke Pines shows moderate seasonality with distinct peak and low periods. While the sections above show seasonal averages, it's also insightful to look at the extremes:
- During the high season, the absolute peak month showcases Pembroke Pines's highest earning potential, with monthly revenues capable of climbing to $4,722, occupancy reaching a high of 64.2%, and ADRs peaking at $251.
- Conversely, the slowest single month of the year, typically falling within the low season, marks the market's lowest point. In this month, revenue might dip to $2,657, occupancy could drop to 43.5%, and ADRs may adjust down to $200.
- Understanding both the seasonal averages and these monthly peaks and troughs in revenue, occupancy, and ADR is crucial for maximizing your Airbnb profit potential in Pembroke Pines.
Seasonal Strategies for Maximizing Profit
- Peak Season: Maximize revenue through premium pricing and potentially longer minimum stays. Ensure high availability.
- Low Season: Offer competitive pricing, special promotions (e.g., extended stay discounts), and flexible cancellation policies. Target off-season travelers like remote workers or budget-conscious guests.
- Shoulder Seasons: Implement dynamic pricing that balances peak and low rates. Target weekend travelers or specific events. Offer slightly more flexible terms than peak season.
- Regularly analyze your own performance against these Pembroke Pines seasonality benchmarks and adjust your pricing and availability strategy accordingly.
Best Areas for Airbnb Investment in Pembroke Pines (2026)
Exploring the top neighborhoods for short-term rentals in Pembroke Pines? This section highlights key areas, outlining why they are attractive for hosts and guests, along with notable local attractions. Consider these locations based on your target guest profile and investment strategy.
| Neighborhood / Area | Why Host Here? (Target Guests & Appeal) | Key Attractions & Landmarks |
|---|---|---|
| Tamarac | A nearby suburban area that offers a peaceful environment and affordable housing, appealing to families and mature residents. | Tamarac Community Center, Woodmont Natural Area, Caporella Park, Tamarac Sports Complex |
| Davie | Close to Pembroke Pines, Davie has a rich selection of outdoor activities and is known for its equestrian culture. This attracts families and nature lovers. | Browning Dairy Park, Wolf Lake Park, Davie Rodeo, Tree Tops Park |
| Weston | An affluent community with top-rated schools and parks, Weston is perfect for long-term rentals and short-term stays for families visiting family or for business. | Weston Town Center, Everglades National Park, Weston Regional Park |
| Miramar | Just north of Pembroke Pines, Miramar offers a range of attractions and is popular among both families and young professionals. | Miramar Cultural Center, Miramar Regional Park, The Shops at Pembroke Gardens |
| Cooper City | A family-oriented neighborhood with great schools, parks, and a strong community vibe. Ideal for families looking to visit the area. | Pioneer Park, Cooper City Community Center, Cooper City Sports Park |
| Pembroke Park | With a strategic location near major highways, Pembroke Park has potential for short-term rentals targeting travelers wanting easy access to Miami and Fort Lauderdale. | Pembroke Park Community Center, Adventure Park of Pembroke Pines, Hollywood North Beach Park |
| Hollywood | Nearby Hollywood Beach offers a vibrant boardwalk, eateries, and a laid-back tropical vibe, attracting tourists looking for a beach destination. | Hollywood Beach Boardwalk, Hollywood North Beach Park, Anne Kolb Nature Center |
| Lauderhill | Another neighboring suburb that is emerging as a popular area for real estate investment due to its affordability and access to amenities. | Lauderdale Lakes Mall, Lauderhill Performing Arts Center, Stirling Road Park |
Understanding Airbnb License Requirements & STR Laws in Pembroke Pines (2026)
While Pembroke Pines, Florida, United States currently shows low STR regulations, specific Airbnb license requirements might still exist or change. Always verify the latest short term rental regulations and Airbnb license requirements directly with local government authorities for Pembroke Pines to ensure full compliance before hosting.
(Source: AirROI data, 2026, finding no licensed listings among those analyzed)
Top Performing Airbnb Properties in Pembroke Pines (2026)
Benchmark your potential! Explore examples of top-performing Airbnb properties in Pembroke Pinesbased on Trailing Twelve Month (TTM) revenue. Analyze their characteristics, revenue, occupancy rate, and ADR to understand what drives success in this market.
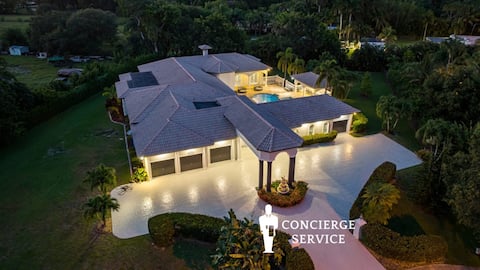
7000sf Mansion/Gameroom/Theater/Heated Pool
Entire Place • 9 bedrooms
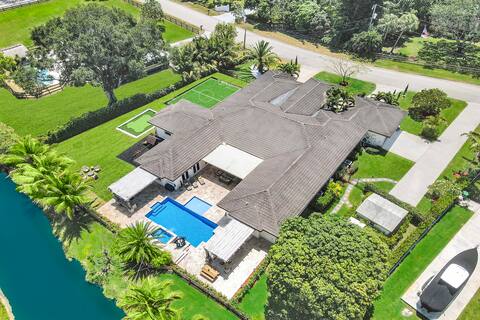
Luxury 8BR w/ Pool & Mini-golf & Soccer- 16 Guests
Entire Place • 8 bedrooms

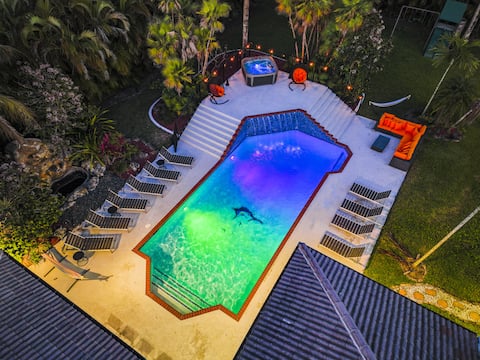
Top Villa | BBQ, Game Room, Hot Tub and Htd Pool
Entire Place • 6 bedrooms
7000sf Mansion Pool|Theater|Gameroom
Entire Place • 9 bedrooms

Luxe Resort 5BR Oasis Heated Pool HardRock Stadium
Entire Place • 5 bedrooms

Spacious 6BR w/ POOL & Tons of Games
Entire Place • 6 bedrooms
Note: Performance varies based on location, size, amenities, seasonality, and management quality. Data reflects the past 12 months.
Top Performing Airbnb Hosts in Pembroke Pines (2026)
Learn from the best! This table showcases top-performing Airbnb hosts in Pembroke Pines based on the number of properties managed and estimated total revenue over the past year. Analyze their scale and performance metrics.
| Host Name | Properties | Grossing Revenue | Stay Reviews | Avg Rating |
|---|---|---|---|---|
| Designedvr | 2 | $387,983 | 136 | 4.74/5.0 |
| Kevin | 6 | $298,899 | 614 | 4.91/5.0 |
| Laura | 2 | $252,934 | 514 | 4.75/5.0 |
| Chet | 1 | $238,590 | 47 | 4.62/5.0 |
| Solara | 1 | $206,948 | 154 | 4.80/5.0 |
| Chet | 1 | $204,444 | 69 | 4.77/5.0 |
| TMBK Enterprises | 2 | $198,433 | 29 | 4.79/5.0 |
| Charles | 1 | $153,856 | 253 | 4.79/5.0 |
| SurFlo Management | 4 | $133,603 | 603 | 4.93/5.0 |
| Nikita | 2 | $106,736 | 74 | 4.76/5.0 |
Analyzing the strategies of top hosts, such as their property selection, pricing, and guest communication, can offer valuable lessons for optimizing your own Airbnb operations in Pembroke Pines.
Dive Deeper: Advanced Pembroke Pines STR Market Data (2026)
Ready to unlock more insights? AirROI provides access to advanced metrics and comprehensive Airbnb data for Pembroke Pines. Explore detailed analytics beyond this report to refine your investment strategy, optimize pricing, and maximize your vacation rental profits.
Explore Advanced MetricsPembroke Pines Short-Term Rental Market Composition (2026): Property & Room Types
Room Type Distribution
Property Type Distribution
Market Composition Insights for Pembroke Pines
- The Pembroke Pines Airbnb market composition is heavily skewed towards Entire Home/Apt listings, which make up 65.6% of the 160 active rentals. This indicates strong guest preference for privacy and space.
- However, a notable 33.8% share for Private Rooms suggests opportunities for budget-conscious travelers or hosts renting out spare rooms.
- Looking at the property type distribution in Pembroke Pines, House properties are the most common (70.6%), reflecting the local real estate landscape.
- Houses represent a significant 70.6% portion, catering likely to families or larger groups.
- The presence of 5.6% Hotel/Boutique listings indicates integration with traditional hospitality.
- Smaller segments like outdoor/unique (combined 0.6%) offer potential for unique stay experiences.
Pembroke Pines Airbnb Room Capacity Analysis (2026): Bedroom Distribution
Distribution of Listings by Number of Bedrooms
Room Capacity Insights for Pembroke Pines
- The dominant room capacity in Pembroke Pines is 1 bedroom listings, making up 25.6% of the market. This suggests a strong demand for properties suitable for couples or solo travelers.
- Together, 1 bedroom and 3 bedrooms properties represent 42.5% of the active Airbnb listings in Pembroke Pines, indicating a high concentration in these sizes.
- A significant 35.1% of listings offer 3+ bedrooms, catering to larger groups and families seeking more space in Pembroke Pines.
Pembroke Pines Vacation Rental Guest Capacity Trends (2026)
Distribution of Listings by Guest Capacity
Guest Capacity Insights for Pembroke Pines
- The most common guest capacity trend in Pembroke Pines vacation rentals is listings accommodating 8+ guests (23.8%). This suggests the primary traveler segment is likely larger groups.
- Properties designed for 8+ guests and 2 guests dominate the Pembroke Pines STR market, accounting for 36.9% of listings.
- 35.1% of properties accommodate 6+ guests, serving the market segment for larger families or group travel in Pembroke Pines.
- On average, properties in Pembroke Pines are equipped to host 3.6 guests.
Pembroke Pines Airbnb Booking Patterns (2026): Available vs. Booked Days
Available Days Distribution
Booked Days Distribution
Booking Pattern Insights for Pembroke Pines
- The most common availability pattern in Pembroke Pines falls within the 271-366 days range, representing 41.9% of listings. This suggests many properties have significant open periods on their calendars.
- Approximately 66.9% of listings show high availability (181+ days open annually), indicating potential for increased bookings or specific owner usage patterns.
- For booked days, the 31-90 days range is most frequent in Pembroke Pines (26.3%), reflecting common guest stay durations or potential owner blocking patterns.
- A notable 35.1% of properties secure long booking periods (181+ days booked per year), highlighting successful long-term rental strategies or significant owner usage.
Pembroke Pines Airbnb Minimum Stay Requirements Analysis
Distribution of Listings by Minimum Night Requirement
1 Night
43 listings
26.9% of total
2 Nights
31 listings
19.4% of total
3 Nights
18 listings
11.3% of total
4-6 Nights
7 listings
4.4% of total
7-29 Nights
7 listings
4.4% of total
30+ Nights
54 listings
33.8% of total
Key Insights
- The most prevalent minimum stay requirement in Pembroke Pines is 30+ Nights, adopted by 33.8% of listings. This highlights the market's preference for longer commitments.
- A significant segment (33.8%) caters to monthly stays (30+ nights) in Pembroke Pines, pointing to opportunities in the extended-stay market.
Recommendations
- Align with the market by considering a 30+ Nights minimum stay, as 33.8% of Pembroke Pines hosts use this setting.
- If feasible, allowing 1-night stays, especially midweek or during low season, could capture last-minute bookings, as only 26.9% currently do.
- Explore offering discounts for stays of 30+ nights to attract the 33.8% of the market seeking extended stays.
- Adjust minimum nights based on seasonality – potentially shorter during low season and longer during peak demand periods in Pembroke Pines.
Pembroke Pines Airbnb Cancellation Policy Trends Analysis (2026)
Super Strict 30 Days
3 listings
1.9% of total
Limited
4 listings
2.5% of total
Flexible
44 listings
27.7% of total
Moderate
43 listings
27% of total
Firm
50 listings
31.4% of total
Strict
15 listings
9.4% of total
Cancellation Policy Insights for Pembroke Pines
- The prevailing Airbnb cancellation policy trend in Pembroke Pines is Firm, used by 31.4% of listings.
- There's a relatively balanced mix between guest-friendly (54.7%) and stricter (40.8%) policies, offering choices for different guest needs.
- Strict cancellation policies are quite rare (9.4%), potentially making listings with this policy less competitive unless justified by high demand or property type.
Recommendations for Hosts
- Consider adopting a Firm policy to align with the 31.4% market standard in Pembroke Pines.
- Using a Strict policy might deter some guests, as only 9.4% of listings use it. Evaluate if potential revenue protection outweighs possible lower booking rates.
- Regularly review your cancellation policy against competitors and market demand shifts in Pembroke Pines.
Pembroke Pines STR Booking Lead Time Analysis (2026)
Average Booking Lead Time by Month
Booking Lead Time Insights for Pembroke Pines
- The overall average booking lead time for vacation rentals in Pembroke Pines is 29 days.
- Guests book furthest in advance for stays during December (average 39 days), likely coinciding with peak travel demand or local events.
- The shortest booking windows occur for stays in September (average 24 days), indicating more last-minute travel plans during this time.
- Seasonally, Winter (34 days avg.) sees the longest lead times, while Summer (26 days avg.) has the shortest, reflecting typical travel planning cycles.
Recommendations for Hosts
- Use the overall average lead time (29 days) as a baseline for your pricing and availability strategy in Pembroke Pines.
- Target marketing efforts for the Winter season well in advance (at least 34 days) to capture early planners.
- Monitor your own booking lead times against these Pembroke Pines averages to identify opportunities for dynamic pricing adjustments.
Popular & Essential Airbnb Amenities in Pembroke Pines (2026)
Amenity Prevalence
Amenity Insights for Pembroke Pines
- Essential amenities in Pembroke Pines that guests expect include: Air conditioning, Wifi, Free parking on premises, TV. Lacking these (any) could significantly impact bookings.
- Popular amenities like Smoke alarm, Hot water, Hangers are common but not universal. Offering these can provide a competitive edge.
Recommendations for Hosts
- Ensure your listing includes all essential amenities for Pembroke Pines: Air conditioning, Wifi, Free parking on premises, TV.
- Prioritize adding missing essentials: Wifi, Free parking on premises, TV.
- Consider adding popular differentiators like Smoke alarm or Hot water to increase appeal.
- Highlight unique or less common amenities you offer (e.g., hot tub, dedicated workspace, EV charger) in your listing description and photos.
- Regularly check competitor amenities in Pembroke Pines to stay competitive.
Pembroke Pines Airbnb Guest Demographics & Profile Analysis (2026)
Guest Profile Summary for Pembroke Pines
- The typical guest profile for Airbnb in Pembroke Pines consists of primarily domestic travelers (82%), often arriving from nearby Miami, typically belonging to the Post-2000s (Gen Z/Alpha) group (50%), primarily speaking English or Spanish.
- Domestic travelers account for 82.2% of guests.
- Key international markets include United States (82.2%) and Canada (3.1%).
- Top languages spoken are English (59.4%) followed by Spanish (23.4%).
- A significant demographic segment is the Post-2000s (Gen Z/Alpha) group, representing 50% of guests.
Recommendations for Hosts
- Target domestic marketing efforts towards travelers from Miami and New York.
- Tailor amenities and listing descriptions to appeal to the dominant Post-2000s (Gen Z/Alpha) demographic (e.g., highlight fast WiFi, smart home features, local guides).
- Highlight unique local experiences or amenities relevant to the primary guest profile.
- Consider seasonal promotions aligned with peak travel times for key origin markets.
Nearby Short-Term Rental Market Comparison
How does the Pembroke Pines Airbnb market stack up against its neighbors? Compare key performance metrics like average monthly revenue, ADR, and occupancy rates in surrounding areas to understand the broader regional STR landscape.
| Market | Active Properties | Monthly Revenue | Daily Rate | Avg. Occupancy |
|---|---|---|---|---|
| Sailfish Point | 19 | $16,709 | $1587.63 | 48% |
| Bal Harbour Village | 37 | $8,846 | $850.63 | 34% |
| Lake Clarke Shores | 26 | $6,710 | $516.52 | 46% |
| Lighthouse Point | 75 | $6,205 | $472.94 | 51% |
| Pinecrest | 11 | $6,117 | $861.24 | 43% |
| North Bay Village | 120 | $6,032 | $561.12 | 44% |
| Tequesta | 43 | $4,920 | $376.96 | 50% |
| Juno Beach | 39 | $4,807 | $377.00 | 47% |
| Parkland | 17 | $4,637 | $369.21 | 47% |
| Ocean Ridge | 14 | $4,588 | $602.78 | 48% |