Parker Airbnb Market Analysis 2026: Short Term Rental Data & Vacation Rental Statistics in Florida, United States
Is Airbnb profitable in Parker in 2026? Explore comprehensive Airbnb analytics for Parker, Florida, United States to uncover income potential. This 2026 STR market report for Parker, based on AirROI data from February 2025 to January 2026, reveals key trends in the niche market of 24 active listings.
Whether you're considering an Airbnb investment in Parker, optimizing your existing vacation rental, or exploring rental arbitrage opportunities, understanding the Parker Airbnb data is crucial. Leveraging the low regulation environment is key to maximizing your short term rental income potential. Let's dive into the specifics.
Key Parker Airbnb Performance Metrics Overview
Monthly Airbnb Revenue Variations & Income Potential in Parker (2026)
Understanding the monthly revenue variations for Airbnb listings in Parker is key to maximizing your short term rental income potential. Seasonality significantly impacts earnings. Our analysis, based on data from the past 12 months, shows that the peak revenue month for STRs in Parker is typically June, while December often presents the lowest earnings, highlighting opportunities for strategic pricing adjustments during shoulder and low seasons. Explore the typical Airbnb income in Parker across different performance tiers:
- Best-in-class properties (Top 10%) achieve $4,718+ monthly, often utilizing dynamic pricing and superior guest experiences.
- Strong performing properties (Top 25%) earn $2,876 or more, indicating effective management and desirable locations/amenities.
- Typical properties (Median) generate around $1,777 per month, representing the average market performance.
- Entry-level properties (Bottom 25%) see earnings around $1,141, often with potential for optimization.
Average Monthly Airbnb Earnings Trend in Parker
Parker Airbnb Occupancy Rate Trends (2026)
Maximize your bookings by understanding the Parker STR occupancy trends. Seasonal demand shifts significantly influence how often properties are booked. Typically, Junesees the highest demand (peak season occupancy), while December experiences the lowest (low season). Effective strategies, like adjusting minimum stays or offering promotions, can boost occupancy during slower periods. Here's how different property tiers perform in Parker:
- Best-in-class properties (Top 10%) achieve 75%+ occupancy, indicating high desirability and potentially optimized availability.
- Strong performing properties (Top 25%) maintain 53% or higher occupancy, suggesting good market fit and guest satisfaction.
- Typical properties (Median) have an occupancy rate around 34%.
- Entry-level properties (Bottom 25%) average 21% occupancy, potentially facing higher vacancy.
Average Monthly Occupancy Rate Trend in Parker
Average Daily Rate (ADR) Airbnb Trends in Parker (2026)
Effective short term rental pricing strategy in Parker involves understanding monthly ADR fluctuations. The Average Daily Rate (ADR) for Airbnb in Parker typically peaks in June and dips lowest during February. Leveraging Airbnb dynamic pricing tools or strategies based on this seasonality can significantly boost revenue. Here's a look at the typical nightly rates achieved:
- Best-in-class properties (Top 10%) command rates of $245+ per night, often due to premium features or locations.
- Strong performing properties (Top 25%) achieve nightly rates of $208 or more.
- Typical properties (Median) charge around $176 per night.
- Entry-level properties (Bottom 25%) earn around $140 per night.
Average Daily Rate (ADR) Trend by Month in Parker
Get Live Parker Market Intelligence 👇

Explore Real-time Analytics
Airbnb Seasonality Analysis & Trends in Parker (2026)
Peak Season (June, July, May)
- Revenue averages $3,582 per month
- Occupancy rates average 54.7%
- Daily rates average $201
Shoulder Season
- Revenue averages $1,956 per month
- Occupancy maintains around 37.4%
- Daily rates hold near $168
Low Season (January, September, December)
- Revenue drops to average $1,499 per month
- Occupancy decreases to average 26.9%
- Daily rates adjust to average $176
Seasonality Insights for Parker
- The Airbnb seasonality in Parker shows highly seasonal trends requiring careful strategy. While the sections above show seasonal averages, it's also insightful to look at the extremes:
- During the high season, the absolute peak month showcases Parker's highest earning potential, with monthly revenues capable of climbing to $4,395, occupancy reaching a high of 64.7%, and ADRs peaking at $215.
- Conversely, the slowest single month of the year, typically falling within the low season, marks the market's lowest point. In this month, revenue might dip to $1,370, occupancy could drop to 24.2%, and ADRs may adjust down to $145.
- Understanding both the seasonal averages and these monthly peaks and troughs in revenue, occupancy, and ADR is crucial for maximizing your Airbnb profit potential in Parker.
Seasonal Strategies for Maximizing Profit
- Peak Season: Maximize revenue through premium pricing and potentially longer minimum stays. Ensure high availability.
- Low Season: Offer competitive pricing, special promotions (e.g., extended stay discounts), and flexible cancellation policies. Target off-season travelers like remote workers or budget-conscious guests.
- Shoulder Seasons: Implement dynamic pricing that balances peak and low rates. Target weekend travelers or specific events. Offer slightly more flexible terms than peak season.
- Regularly analyze your own performance against these Parker seasonality benchmarks and adjust your pricing and availability strategy accordingly.
Best Areas for Airbnb Investment in Parker (2026)
Exploring the top neighborhoods for short-term rentals in Parker? This section highlights key areas, outlining why they are attractive for hosts and guests, along with notable local attractions. Consider these locations based on your target guest profile and investment strategy.
| Neighborhood / Area | Why Host Here? (Target Guests & Appeal) | Key Attractions & Landmarks |
|---|---|---|
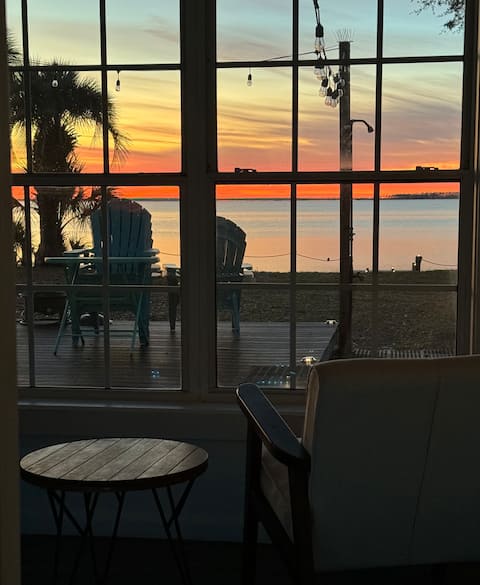
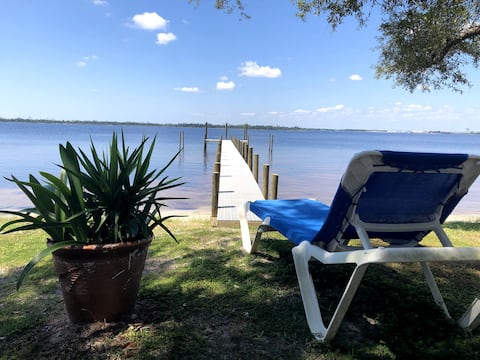
| Parker Waterfront | Scenic water views and easy access to recreational activities. Ideal for families and travelers looking for waterfront relaxation and adventure. | St. Andrews State Park, Shell Island, Parker Dam, Gulf Coast beaches, Fishing spots, Water sports |
| Historic Downtown Parker | Charming small-town atmosphere with historic buildings and local shops. Great for those seeking an authentic Floridian experience away from tourist hotspots. | Parker Historical Museum, Local restaurants, Antique shops, Events and festivals, Waterfront parks |
| Parker Acres | Residential neighborhood with spacious properties and family-friendly amenities. Attracts visitors looking for longer stays and a home-like atmosphere. | Parks, Community events, Family-friendly attractions, Local dining options |
| Parker County Club Area | Upscale area known for its golf courses and country club lifestyle. Popular with travelers looking for luxury and leisure activities. | Golf courses, Club facilities, Nature trails, High-end dining |
| Lighthouse Point | Exclusive area with beautiful waterfront properties and a relaxing environment. Perfect for discerning travelers seeking tranquility. | Private beaches, Lighthouse Park, Waterfront dining, Scenic views |
| Parker Marina District | Vibrant hub for boating and water activities. Great choice for adventure seekers and those looking to enjoy marine life. | Marina facilities, Boat rentals, Fishing opportunities, Dining by the water |
| Nature Trails Area | Surrounding natural beauty with access to trails and outdoor adventures. Appeals to nature lovers and those looking to explore the outdoors. | Nature trails, Wildlife viewing, Hiking and biking, Parks and picnic areas |
| Culver's Landing | Development area with potential for growth and investment. Attractive for those looking to capitalize on increasing tourism in Florida. | New developments, Emerging local businesses, Access to downtown amenities |
Understanding Airbnb License Requirements & STR Laws in Parker (2026)
While Parker, Florida, United States currently shows low STR regulations, specific Airbnb license requirements might still exist or change. Always verify the latest short term rental regulations and Airbnb license requirements directly with local government authorities for Parker to ensure full compliance before hosting.
(Source: AirROI data, 2026, finding no licensed listings among those analyzed)
Top Performing Airbnb Properties in Parker (2026)
Benchmark your potential! Explore examples of top-performing Airbnb properties in Parkerbased on Trailing Twelve Month (TTM) revenue. Analyze their characteristics, revenue, occupancy rate, and ADR to understand what drives success in this market.
Bay Beach Bungalow waterfront family vacation home
Entire Place • 3 bedrooms
Cozy Cottage in Florida Panhandle
Entire Place • 2 bedrooms

2 miles to Tyndall with dock and slips
Entire Place • 5 bedrooms
Our Hometown Cottage
Entire Place • 2 bedrooms
Water front amazing views and private beach
Entire Place • 1 bedroom

2 miles to Tyndall AFB. Dock with slips. Bay front
Entire Place • 3 bedrooms
Note: Performance varies based on location, size, amenities, seasonality, and management quality. Data reflects the past 12 months.
Top Performing Airbnb Hosts in Parker (2026)
Learn from the best! This table showcases top-performing Airbnb hosts in Parker based on the number of properties managed and estimated total revenue over the past year. Analyze their scale and performance metrics.
| Host Name | Properties | Grossing Revenue | Stay Reviews | Avg Rating |
|---|---|---|---|---|
| Donna | 14 | $252,242 | 705 | 4.90/5.0 |
| Darin | 1 | $65,602 | 208 | 4.93/5.0 |
| Kimberly | 1 | $40,611 | 75 | 4.87/5.0 |
| Evolve | 2 | $31,612 | 50 | 4.66/5.0 |
| Donna | 1 | $28,077 | 16 | 5.00/5.0 |
| Arell | 2 | $26,181 | 13 | 4.90/5.0 |
| Justin | 1 | $12,029 | 35 | 4.94/5.0 |
| Steven | 1 | $6,760 | 51 | 4.82/5.0 |
| Thomas | 1 | $1,848 | 27 | 4.81/5.0 |
Analyzing the strategies of top hosts, such as their property selection, pricing, and guest communication, can offer valuable lessons for optimizing your own Airbnb operations in Parker.
Dive Deeper: Advanced Parker STR Market Data (2026)
Ready to unlock more insights? AirROI provides access to advanced metrics and comprehensive Airbnb data for Parker. Explore detailed analytics beyond this report to refine your investment strategy, optimize pricing, and maximize your vacation rental profits.
Explore Advanced MetricsParker Short-Term Rental Market Composition (2026): Property & Room Types
Room Type Distribution
Property Type Distribution
Market Composition Insights for Parker
- The Parker Airbnb market composition is heavily skewed towards Entire Home/Apt listings, which make up 91.7% of the 24 active rentals. This indicates strong guest preference for privacy and space.
- Looking at the property type distribution in Parker, House properties are the most common (87.5%), reflecting the local real estate landscape.
- Houses represent a significant 87.5% portion, catering likely to families or larger groups.
Parker Airbnb Room Capacity Analysis (2026): Bedroom Distribution
Distribution of Listings by Number of Bedrooms
Room Capacity Insights for Parker
- The dominant room capacity in Parker is 2 bedrooms listings, making up 41.7% of the market. This suggests a strong demand for properties suitable for couples or solo travelers.
- Together, 2 bedrooms and 3 bedrooms properties represent 66.7% of the active Airbnb listings in Parker, indicating a high concentration in these sizes.
- A significant 33.4% of listings offer 3+ bedrooms, catering to larger groups and families seeking more space in Parker.
Parker Vacation Rental Guest Capacity Trends (2026)
Distribution of Listings by Guest Capacity
Guest Capacity Insights for Parker
- The most common guest capacity trend in Parker vacation rentals is listings accommodating 8+ guests (25%). This suggests the primary traveler segment is likely larger groups.
- Properties designed for 8+ guests and 6 guests dominate the Parker STR market, accounting for 50.0% of listings.
- 58.3% of properties accommodate 6+ guests, serving the market segment for larger families or group travel in Parker.
- On average, properties in Parker are equipped to host 5.2 guests.
Parker Airbnb Booking Patterns (2026): Available vs. Booked Days
Available Days Distribution
Booked Days Distribution
Booking Pattern Insights for Parker
- The most common availability pattern in Parker falls within the 271-366 days range, representing 50% of listings. This suggests many properties have significant open periods on their calendars.
- Approximately 83.3% of listings show high availability (181+ days open annually), indicating potential for increased bookings or specific owner usage patterns.
- For booked days, the 31-90 days range is most frequent in Parker (37.5%), reflecting common guest stay durations or potential owner blocking patterns.
- A notable 16.6% of properties secure long booking periods (181+ days booked per year), highlighting successful long-term rental strategies or significant owner usage.
Parker Airbnb Minimum Stay Requirements Analysis
Distribution of Listings by Minimum Night Requirement
1 Night
15 listings
62.5% of total
2 Nights
3 listings
12.5% of total
3 Nights
2 listings
8.3% of total
30+ Nights
4 listings
16.7% of total
Key Insights
- The most prevalent minimum stay requirement in Parker is 1 Night, adopted by 62.5% of listings. This highlights the market's preference for shorter, flexible bookings.
- A strong majority (75.0%) of the Parker Airbnb data shows acceptance of very short stays (1-2 nights), indicating a dynamic, high-turnover market.
- A significant segment (16.7%) caters to monthly stays (30+ nights) in Parker, pointing to opportunities in the extended-stay market.
Recommendations
- Align with the market by considering a 1 Night minimum stay, as 62.5% of Parker hosts use this setting.
- Explore offering discounts for stays of 30+ nights to attract the 16.7% of the market seeking extended stays.
- Adjust minimum nights based on seasonality – potentially shorter during low season and longer during peak demand periods in Parker.
Parker Airbnb Cancellation Policy Trends Analysis (2026)
Super Strict 30 Days
2 listings
8.3% of total
Flexible
3 listings
12.5% of total
Moderate
13 listings
54.2% of total
Firm
4 listings
16.7% of total
Strict
2 listings
8.3% of total
Cancellation Policy Insights for Parker
- The prevailing Airbnb cancellation policy trend in Parker is Moderate, used by 54.2% of listings.
- There's a relatively balanced mix between guest-friendly (66.7%) and stricter (25.0%) policies, offering choices for different guest needs.
- Strict cancellation policies are quite rare (8.3%), potentially making listings with this policy less competitive unless justified by high demand or property type.
Recommendations for Hosts
- Consider adopting a Moderate policy to align with the 54.2% market standard in Parker.
- Using a Strict policy might deter some guests, as only 8.3% of listings use it. Evaluate if potential revenue protection outweighs possible lower booking rates.
- Regularly review your cancellation policy against competitors and market demand shifts in Parker.
Parker STR Booking Lead Time Analysis (2026)
Average Booking Lead Time by Month
Booking Lead Time Insights for Parker
- The overall average booking lead time for vacation rentals in Parker is 35 days.
- Guests book furthest in advance for stays during March (average 48 days), likely coinciding with peak travel demand or local events.
- The shortest booking windows occur for stays in November (average 14 days), indicating more last-minute travel plans during this time.
- Seasonally, Summer (39 days avg.) sees the longest lead times, while Winter (25 days avg.) has the shortest, reflecting typical travel planning cycles.
Recommendations for Hosts
- Use the overall average lead time (35 days) as a baseline for your pricing and availability strategy in Parker.
- For March stays, consider implementing length-of-stay discounts or slightly higher rates for bookings made less than 48 days out to capitalize on advance planning.
- During November, focus on last-minute booking availability and promotions, as guests book with very short notice (14 days avg.).
- Target marketing efforts for the Summer season well in advance (at least 39 days) to capture early planners.
- Monitor your own booking lead times against these Parker averages to identify opportunities for dynamic pricing adjustments.
Popular & Essential Airbnb Amenities in Parker (2026)
Amenity Prevalence
Amenity Insights for Parker
- Essential amenities in Parker that guests expect include: Smoke alarm, Bed linens, Refrigerator, Microwave, Free parking on premises, Wifi, Fire extinguisher, Coffee maker, Hot water, Hair dryer. Lacking these (any) could significantly impact bookings.
Recommendations for Hosts
- Ensure your listing includes all essential amenities for Parker: Smoke alarm, Bed linens, Refrigerator, Microwave, Free parking on premises, Wifi, Fire extinguisher, Coffee maker, Hot water, Hair dryer.
- Prioritize adding missing essentials: Microwave, Free parking on premises, Wifi, Fire extinguisher, Coffee maker, Hot water, Hair dryer.
- Highlight unique or less common amenities you offer (e.g., hot tub, dedicated workspace, EV charger) in your listing description and photos.
- Regularly check competitor amenities in Parker to stay competitive.
Parker Airbnb Guest Demographics & Profile Analysis (2026)
Guest Profile Summary for Parker
- The typical guest profile for Airbnb in Parker consists of primarily domestic travelers (96%), often arriving from nearby San Antonio, typically belonging to the Post-2000s (Gen Z/Alpha) group (50%), primarily speaking English or Spanish.
- Domestic travelers account for 95.5% of guests.
- Key international markets include United States (95.5%) and Sweden (0.7%).
- Top languages spoken are English (72.1%) followed by Spanish (11.8%).
- A significant demographic segment is the Post-2000s (Gen Z/Alpha) group, representing 50% of guests.
Recommendations for Hosts
- Target domestic marketing efforts towards travelers from San Antonio and Atlanta.
- Tailor amenities and listing descriptions to appeal to the dominant Post-2000s (Gen Z/Alpha) demographic (e.g., highlight fast WiFi, smart home features, local guides).
- Highlight unique local experiences or amenities relevant to the primary guest profile.
- Consider seasonal promotions aligned with peak travel times for key origin markets.
Nearby Short-Term Rental Market Comparison
How does the Parker Airbnb market stack up against its neighbors? Compare key performance metrics like average monthly revenue, ADR, and occupancy rates in surrounding areas to understand the broader regional STR landscape.
| Market | Active Properties | Monthly Revenue | Daily Rate | Avg. Occupancy |
|---|---|---|---|---|
| Alys Beach | 441 | $6,989 | $682.56 | 43% |
| Seaside | 669 | $6,696 | $783.03 | 38% |
| Seacrest Beach | 350 | $6,613 | $593.69 | 44% |
| Rosemary Beach | 533 | $6,251 | $659.86 | 42% |
| Santa Rosa Beach | 3,191 | $5,047 | $539.15 | 41% |
| Seacrest | 28 | $4,993 | $635.35 | 39% |
| Inlet Beach | 98 | $4,870 | $534.43 | 41% |
| Saint George Island | 153 | $4,832 | $490.02 | 43% |
| Walton County | 134 | $4,764 | $592.07 | 38% |
| Watersound | 126 | $4,640 | $495.06 | 40% |