Panama City Beach Airbnb Market Analysis 2026: Short Term Rental Data & Vacation Rental Statistics in Florida, United States
Is Airbnb profitable in Panama City Beach in 2026? Explore comprehensive Airbnb analytics for Panama City Beach, Florida, United States to uncover income potential. This 2026 STR market report for Panama City Beach, based on AirROI data from February 2025 to January 2026, reveals key trends in the bustling market of 9,974 active listings.
Whether you're considering an Airbnb investment in Panama City Beach, optimizing your existing vacation rental, or exploring rental arbitrage opportunities, understanding the Panama City Beach Airbnb data is crucial. Navigating the high regulation landscape is key to maximizing your short term rental income potential. Let's dive into the specifics.
Key Panama City Beach Airbnb Performance Metrics Overview
Monthly Airbnb Revenue Variations & Income Potential in Panama City Beach (2026)
Understanding the monthly revenue variations for Airbnb listings in Panama City Beach is key to maximizing your short term rental income potential. Seasonality significantly impacts earnings. Our analysis, based on data from the past 12 months, shows that the peak revenue month for STRs in Panama City Beach is typically July, while January often presents the lowest earnings, highlighting opportunities for strategic pricing adjustments during shoulder and low seasons. Explore the typical Airbnb income in Panama City Beach across different performance tiers:
- Best-in-class properties (Top 10%) achieve $8,216+ monthly, often utilizing dynamic pricing and superior guest experiences.
- Strong performing properties (Top 25%) earn $5,574 or more, indicating effective management and desirable locations/amenities.
- Typical properties (Median) generate around $3,397 per month, representing the average market performance.
- Entry-level properties (Bottom 25%) see earnings around $1,845, often with potential for optimization.
Average Monthly Airbnb Earnings Trend in Panama City Beach
Panama City Beach Airbnb Occupancy Rate Trends (2026)
Maximize your bookings by understanding the Panama City Beach STR occupancy trends. Seasonal demand shifts significantly influence how often properties are booked. Typically, Julysees the highest demand (peak season occupancy), while January experiences the lowest (low season). Effective strategies, like adjusting minimum stays or offering promotions, can boost occupancy during slower periods. Here's how different property tiers perform in Panama City Beach:
- Best-in-class properties (Top 10%) achieve 76%+ occupancy, indicating high desirability and potentially optimized availability.
- Strong performing properties (Top 25%) maintain 60% or higher occupancy, suggesting good market fit and guest satisfaction.
- Typical properties (Median) have an occupancy rate around 39%.
- Entry-level properties (Bottom 25%) average 21% occupancy, potentially facing higher vacancy.
Average Monthly Occupancy Rate Trend in Panama City Beach
Average Daily Rate (ADR) Airbnb Trends in Panama City Beach (2026)
Effective short term rental pricing strategy in Panama City Beach involves understanding monthly ADR fluctuations. The Average Daily Rate (ADR) for Airbnb in Panama City Beach typically peaks in June and dips lowest during February. Leveraging Airbnb dynamic pricing tools or strategies based on this seasonality can significantly boost revenue. Here's a look at the typical nightly rates achieved:
- Best-in-class properties (Top 10%) command rates of $502+ per night, often due to premium features or locations.
- Strong performing properties (Top 25%) achieve nightly rates of $373 or more.
- Typical properties (Median) charge around $277 per night.
- Entry-level properties (Bottom 25%) earn around $212 per night.
Average Daily Rate (ADR) Trend by Month in Panama City Beach
Get Live Panama City Beach Market Intelligence 👇

Explore Real-time Analytics
Airbnb Seasonality Analysis & Trends in Panama City Beach (2026)
Peak Season (July, June, May)
- Revenue averages $6,982 per month
- Occupancy rates average 57.5%
- Daily rates average $375
Shoulder Season
- Revenue averages $3,785 per month
- Occupancy maintains around 41.7%
- Daily rates hold near $304
Low Season (January, November, December)
- Revenue drops to average $2,387 per month
- Occupancy decreases to average 25.0%
- Daily rates adjust to average $311
Seasonality Insights for Panama City Beach
- The Airbnb seasonality in Panama City Beach shows highly seasonal trends requiring careful strategy. While the sections above show seasonal averages, it's also insightful to look at the extremes:
- During the high season, the absolute peak month showcases Panama City Beach's highest earning potential, with monthly revenues capable of climbing to $8,218, occupancy reaching a high of 64.8%, and ADRs peaking at $398.
- Conversely, the slowest single month of the year, typically falling within the low season, marks the market's lowest point. In this month, revenue might dip to $2,171, occupancy could drop to 22.7%, and ADRs may adjust down to $253.
- Understanding both the seasonal averages and these monthly peaks and troughs in revenue, occupancy, and ADR is crucial for maximizing your Airbnb profit potential in Panama City Beach.
Seasonal Strategies for Maximizing Profit
- Peak Season: Maximize revenue through premium pricing and potentially longer minimum stays. Ensure high availability.
- Low Season: Offer competitive pricing, special promotions (e.g., extended stay discounts), and flexible cancellation policies. Target off-season travelers like remote workers or budget-conscious guests.
- Shoulder Seasons: Implement dynamic pricing that balances peak and low rates. Target weekend travelers or specific events. Offer slightly more flexible terms than peak season.
- Regularly analyze your own performance against these Panama City Beach seasonality benchmarks and adjust your pricing and availability strategy accordingly.
Best Areas for Airbnb Investment in Panama City Beach (2026)
Exploring the top neighborhoods for short-term rentals in Panama City Beach? This section highlights key areas, outlining why they are attractive for hosts and guests, along with notable local attractions. Consider these locations based on your target guest profile and investment strategy.
| Neighborhood / Area | Why Host Here? (Target Guests & Appeal) | Key Attractions & Landmarks |
|---|---|---|
| Panama City Beach | A renowned beach destination famous for its stunning white sandy beaches and emerald-green waters. It's a popular vacation spot for families and party-goers alike, making it an ideal location for vacation rentals. | Pier Park, Gulf World Marine Park, St. Andrews State Park, Captain Anderson's Marina, Shell Island, Panama City Beach Skywheel |
| East Front Beach Road | Offers a mix of beachside accommodations and proximity to attractions like Pier Park. It's particularly desirable for those looking to enjoy the beach and nearby dining and shopping. | Pier Park, M.B. Miller County Pier, Gulf View Cafe, Mellow Mushroom, The Dasher, Shaw Park |
| Thomas Drive | Known for its family-friendly atmosphere and close access to major attractions, making it a preferred choice for families and vacationing groups. | Schooners Beach Club, St. Andrews State Park, 864 m to be or not to be, Emerald Falls Family Recreation Center, Coconut Creek Family Fun Park |
| West End | This area offers a quieter, more relaxed beach experience while still being close to many popular attractions, great for visitors looking to avoid crowding. | Carillon Beach, Inlet Beach, The Hub, Watersound Beach, Camp Helen State Park |
| North Lagoon Drive | Provides a mix of waterfront properties and access to the bay, appealing for those looking for both beach and boating experiences. | Gran Lagunas, Nora's Cove, Sandy Point, Near Glassy Waters, Panama City Beach Boat Rentals |
| Laguna Beach | A peaceful alternative to the busier areas, known for its beautiful homes and residential vibe, making it appealing for longer stays and family vacations. | Laguna Beach Winery, Alys Beach, Seacrest Beach, Rosemary Beach |
| South Thomas Drive | Famous for its nightlife and beach parties, this area attracts younger crowds and is perfect for short-term rental investments to cater to party-goers. | Club La Vela, Coyote Ugly Saloon, The Hangout, Hurricane Oyster Bar |
| Frankford Avenue | An up-and-coming area that combines charm with proximity to the beach; appealing for those seeking rental opportunities in a developing neighborhood. | Frankford Avenue Beach Access, Taco Bell, Nearby Supermarket, Local boutiques and shops |
Understanding Airbnb License Requirements & STR Laws in Panama City Beach (2026)
Yes, Panama City Beach, Florida, United States enforces high STR regulations. Obtaining a license and ensuring compliance is almost certainly required according to current 2026 STR laws. Always verify the latest short term rental regulations and Airbnb license requirements directly with local government authorities for Panama City Beach to ensure full compliance before hosting.
(Source: AirROI data, 2026, based on 66% licensed listings)
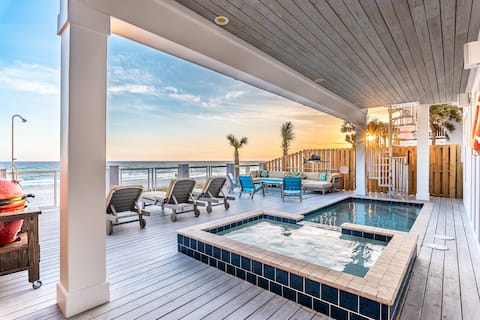
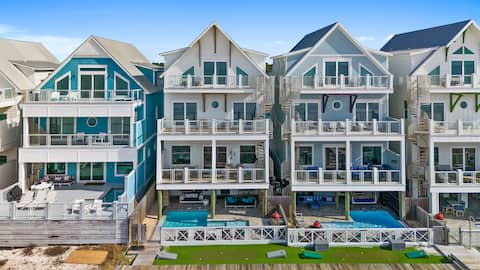
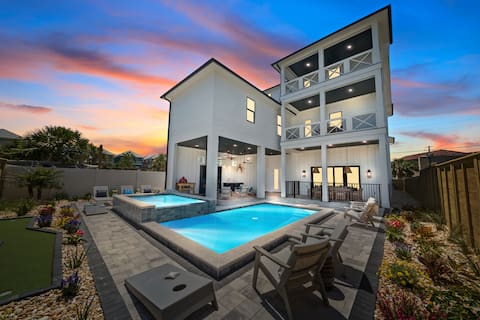
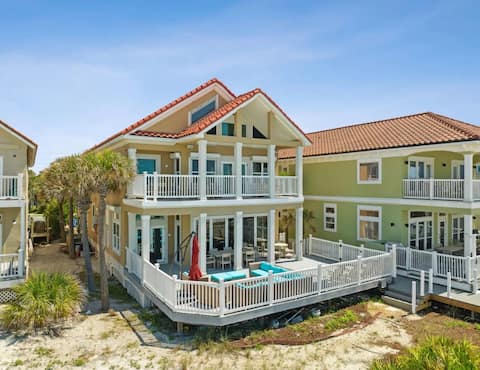
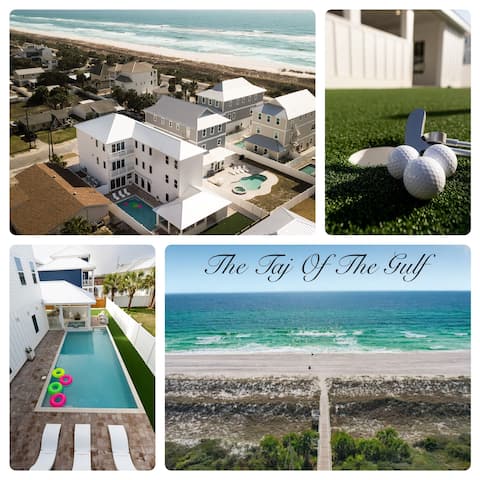
Top Performing Airbnb Properties in Panama City Beach (2026)
Benchmark your potential! Explore examples of top-performing Airbnb properties in Panama City Beachbased on Trailing Twelve Month (TTM) revenue. Analyze their characteristics, revenue, occupancy rate, and ADR to understand what drives success in this market.
Great White - Beachfront+pool, Family Vacation
Entire Place • 9 bedrooms
Surf Shack - Beachfront, Private Pool, + Game Room
Entire Place • 8 bedrooms
Coastal Haven - Perfect Vacation Home in PCB!
Entire Place • 9 bedrooms

Tan Lines - Beachfront, Private Pool w/ Games!
Entire Place • 6 bedrooms
Luxury Oceanfront Beach House, 7 Bd/6.5 Sleeps 20
Entire Place • 7 bedrooms
*NEW* Luxury beach mansion! Sleep 37 | Pool & Golf
Entire Place • 9 bedrooms
Note: Performance varies based on location, size, amenities, seasonality, and management quality. Data reflects the past 12 months.
Top Performing Airbnb Hosts in Panama City Beach (2026)
Learn from the best! This table showcases top-performing Airbnb hosts in Panama City Beach based on the number of properties managed and estimated total revenue over the past year. Analyze their scale and performance metrics.
| Host Name | Properties | Grossing Revenue | Stay Reviews | Avg Rating |
|---|---|---|---|---|
| RealJoy | 535 | $20,491,526 | 8784 | 4.58/5.0 |
| Panhandle Getaways | 582 | $13,276,411 | 2183 | 4.58/5.0 |
| Southern Vacation Rentals | 420 | $12,794,759 | 1370 | 4.37/5.0 |
| David | 155 | $9,040,045 | 9935 | 4.73/5.0 |
| Mitch | 170 | $7,888,642 | 1000 | 4.85/5.0 |
| Holiday Beach Rentals | 38 | $6,559,489 | 442 | 4.83/5.0 |
| Cort Harwood | 74 | $6,289,799 | 2008 | 4.82/5.0 |
| Kelly | 93 | $5,712,414 | 5510 | 4.84/5.0 |
| Evolve | 145 | $5,408,677 | 4798 | 4.66/5.0 |
| Emerald Beach | 134 | $4,403,954 | 1597 | 4.65/5.0 |
Analyzing the strategies of top hosts, such as their property selection, pricing, and guest communication, can offer valuable lessons for optimizing your own Airbnb operations in Panama City Beach.
Dive Deeper: Advanced Panama City Beach STR Market Data (2026)
Ready to unlock more insights? AirROI provides access to advanced metrics and comprehensive Airbnb data for Panama City Beach. Explore detailed analytics beyond this report to refine your investment strategy, optimize pricing, and maximize your vacation rental profits.
Explore Advanced MetricsPanama City Beach Short-Term Rental Market Composition (2026): Property & Room Types
Room Type Distribution
Property Type Distribution
Market Composition Insights for Panama City Beach
- The Panama City Beach Airbnb market composition is heavily skewed towards Entire Home/Apt listings, which make up 99.1% of the 9,974 active rentals. This indicates strong guest preference for privacy and space.
- Looking at the property type distribution in Panama City Beach, Apartment/Condo properties are the most common (72.3%), reflecting the local real estate landscape.
- Houses represent a significant 26.5% portion, catering likely to families or larger groups.
- Smaller segments like hotel/boutique, others, unique stays (combined 1.2%) offer potential for unique stay experiences.
Panama City Beach Airbnb Room Capacity Analysis (2026): Bedroom Distribution
Distribution of Listings by Number of Bedrooms
Room Capacity Insights for Panama City Beach
- The dominant room capacity in Panama City Beach is 2 bedrooms listings, making up 35.8% of the market. This suggests a strong demand for properties suitable for couples or solo travelers.
- Together, 2 bedrooms and 1 bedroom properties represent 63.1% of the active Airbnb listings in Panama City Beach, indicating a high concentration in these sizes.
- A significant 32.9% of listings offer 3+ bedrooms, catering to larger groups and families seeking more space in Panama City Beach.
Panama City Beach Vacation Rental Guest Capacity Trends (2026)
Distribution of Listings by Guest Capacity
Guest Capacity Insights for Panama City Beach
- The most common guest capacity trend in Panama City Beach vacation rentals is listings accommodating 8+ guests (41.5%). This suggests the primary traveler segment is likely larger groups.
- Properties designed for 8+ guests and 6 guests dominate the Panama City Beach STR market, accounting for 72.8% of listings.
- 76.3% of properties accommodate 6+ guests, serving the market segment for larger families or group travel in Panama City Beach.
- On average, properties in Panama City Beach are equipped to host 6.4 guests.
Panama City Beach Airbnb Booking Patterns (2026): Available vs. Booked Days
Available Days Distribution
Booked Days Distribution
Booking Pattern Insights for Panama City Beach
- The most common availability pattern in Panama City Beach falls within the 271-366 days range, representing 48.1% of listings. This suggests many properties have significant open periods on their calendars.
- Approximately 83.4% of listings show high availability (181+ days open annually), indicating potential for increased bookings or specific owner usage patterns.
- For booked days, the 91-180 days range is most frequent in Panama City Beach (36.4%), reflecting common guest stay durations or potential owner blocking patterns.
- A notable 17.7% of properties secure long booking periods (181+ days booked per year), highlighting successful long-term rental strategies or significant owner usage.
Panama City Beach Airbnb Minimum Stay Requirements Analysis
Distribution of Listings by Minimum Night Requirement
1 Night
546 listings
5.5% of total
2 Nights
1411 listings
14.2% of total
3 Nights
1116 listings
11.2% of total
4-6 Nights
579 listings
5.8% of total
7-29 Nights
148 listings
1.5% of total
30+ Nights
6168 listings
61.9% of total
Key Insights
- The most prevalent minimum stay requirement in Panama City Beach is 30+ Nights, adopted by 61.9% of listings. This highlights the market's preference for longer commitments.
- Very short stays (1-2 nights) are less common (19.7%), suggesting hosts prefer slightly longer bookings to optimize turnover.
- A significant segment (61.9%) caters to monthly stays (30+ nights) in Panama City Beach, pointing to opportunities in the extended-stay market.
Recommendations
- Align with the market by considering a 30+ Nights minimum stay, as 61.9% of Panama City Beach hosts use this setting.
- If feasible, allowing 1-night stays, especially midweek or during low season, could capture last-minute bookings, as only 5.5% currently do.
- Explore offering discounts for stays of 30+ nights to attract the 61.9% of the market seeking extended stays.
- Adjust minimum nights based on seasonality – potentially shorter during low season and longer during peak demand periods in Panama City Beach.
Panama City Beach Airbnb Cancellation Policy Trends Analysis (2026)
Limited
246 listings
2.5% of total
Super Strict 60 Days
303 listings
3% of total
Non-refundable
1 listings
0% of total
Super Strict 30 Days
1035 listings
10.4% of total
Refundable
2 listings
0% of total
Flexible
416 listings
4.2% of total
Moderate
1643 listings
16.5% of total
Firm
5250 listings
52.8% of total
Strict
1042 listings
10.5% of total
Cancellation Policy Insights for Panama City Beach
- The prevailing Airbnb cancellation policy trend in Panama City Beach is Firm, used by 52.8% of listings.
- A majority (63.3%) of hosts in Panama City Beach utilize Firm or Strict policies, indicating a market where hosts prioritize booking security.
Recommendations for Hosts
- Consider adopting a Firm policy to align with the 52.8% market standard in Panama City Beach.
- Using a Strict policy might deter some guests, as only 10.5% of listings use it. Evaluate if potential revenue protection outweighs possible lower booking rates.
- Regularly review your cancellation policy against competitors and market demand shifts in Panama City Beach.
Panama City Beach STR Booking Lead Time Analysis (2026)
Average Booking Lead Time by Month
Booking Lead Time Insights for Panama City Beach
- The overall average booking lead time for vacation rentals in Panama City Beach is 57 days.
- Guests book furthest in advance for stays during February (average 73 days), likely coinciding with peak travel demand or local events.
- The shortest booking windows occur for stays in March (average 48 days), indicating more last-minute travel plans during this time.
- Seasonally, Winter (63 days avg.) sees the longest lead times, while Spring (55 days avg.) has the shortest, reflecting typical travel planning cycles.
Recommendations for Hosts
- Use the overall average lead time (57 days) as a baseline for your pricing and availability strategy in Panama City Beach.
- For February stays, consider implementing length-of-stay discounts or slightly higher rates for bookings made less than 73 days out to capitalize on advance planning.
- Target marketing efforts for the Winter season well in advance (at least 63 days) to capture early planners.
- Monitor your own booking lead times against these Panama City Beach averages to identify opportunities for dynamic pricing adjustments.
Popular & Essential Airbnb Amenities in Panama City Beach (2026)
Amenity Prevalence
Amenity Insights for Panama City Beach
- Essential amenities in Panama City Beach that guests expect include: Air conditioning, Wifi, TV, Kitchen, Smoke alarm, Coffee maker. Lacking these (any) could significantly impact bookings.
- Popular amenities like Microwave, Dishes and silverware, Heating are common but not universal. Offering these can provide a competitive edge.
Recommendations for Hosts
- Ensure your listing includes all essential amenities for Panama City Beach: Air conditioning, Wifi, TV, Kitchen, Smoke alarm, Coffee maker.
- Prioritize adding missing essentials: Air conditioning, Wifi, TV, Kitchen, Smoke alarm, Coffee maker.
- Consider adding popular differentiators like Microwave or Dishes and silverware to increase appeal.
- Highlight unique or less common amenities you offer (e.g., hot tub, dedicated workspace, EV charger) in your listing description and photos.
- Regularly check competitor amenities in Panama City Beach to stay competitive.
Panama City Beach Airbnb Guest Demographics & Profile Analysis (2026)
Guest Profile Summary for Panama City Beach
- The typical guest profile for Airbnb in Panama City Beach consists of primarily domestic travelers (98%), often arriving from nearby Atlanta, typically belonging to the Post-2000s (Gen Z/Alpha) group (50%), primarily speaking English or Spanish.
- Domestic travelers account for 98.4% of guests.
- Key international markets include United States (98.4%) and Canada (0.4%).
- Top languages spoken are English (78.6%) followed by Spanish (12.9%).
- A significant demographic segment is the Post-2000s (Gen Z/Alpha) group, representing 50% of guests.
Recommendations for Hosts
- Target domestic marketing efforts towards travelers from Atlanta and Nashville.
- Tailor amenities and listing descriptions to appeal to the dominant Post-2000s (Gen Z/Alpha) demographic (e.g., highlight fast WiFi, smart home features, local guides).
- Highlight unique local experiences or amenities relevant to the primary guest profile.
- Consider seasonal promotions aligned with peak travel times for key origin markets.
Nearby Short-Term Rental Market Comparison
How does the Panama City Beach Airbnb market stack up against its neighbors? Compare key performance metrics like average monthly revenue, ADR, and occupancy rates in surrounding areas to understand the broader regional STR landscape.
| Market | Active Properties | Monthly Revenue | Daily Rate | Avg. Occupancy |
|---|---|---|---|---|
| Alys Beach | 441 | $6,989 | $682.56 | 43% |
| Seaside | 669 | $6,696 | $783.03 | 38% |
| Seacrest Beach | 350 | $6,613 | $593.69 | 44% |
| Rosemary Beach | 533 | $6,251 | $659.86 | 42% |
| Santa Rosa Beach | 3,191 | $5,047 | $539.15 | 41% |
| Seacrest | 28 | $4,993 | $635.35 | 39% |
| Inlet Beach | 98 | $4,870 | $534.43 | 41% |
| Saint George Island | 153 | $4,832 | $490.02 | 43% |
| Walton County | 134 | $4,764 | $592.07 | 38% |
| Watersound | 126 | $4,640 | $495.06 | 40% |