Panacea Airbnb Market Analysis 2026: Short Term Rental Data & Vacation Rental Statistics in Florida, United States
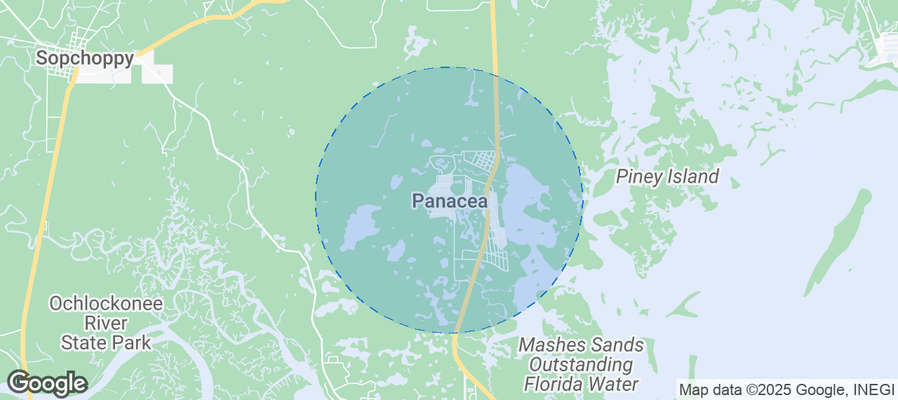
Is Airbnb profitable in Panacea in 2026? Explore comprehensive Airbnb analytics for Panacea, Florida, United States to uncover income potential. This 2026 STR market report for Panacea, based on AirROI data from February 2025 to January 2026, reveals key trends in the niche market of 66 active listings.
Whether you're considering an Airbnb investment in Panacea, optimizing your existing vacation rental, or exploring rental arbitrage opportunities, understanding the Panacea Airbnb data is crucial. Leveraging the low regulation environment is key to maximizing your short term rental income potential. Let's dive into the specifics.
Key Panacea Airbnb Performance Metrics Overview
Monthly Airbnb Revenue Variations & Income Potential in Panacea (2026)
Understanding the monthly revenue variations for Airbnb listings in Panacea is key to maximizing your short term rental income potential. Seasonality significantly impacts earnings. Our analysis, based on data from the past 12 months, shows that the peak revenue month for STRs in Panacea is typically July, while January often presents the lowest earnings, highlighting opportunities for strategic pricing adjustments during shoulder and low seasons. Explore the typical Airbnb income in Panacea across different performance tiers:
- Best-in-class properties (Top 10%) achieve $6,376+ monthly, often utilizing dynamic pricing and superior guest experiences.
- Strong performing properties (Top 25%) earn $4,170 or more, indicating effective management and desirable locations/amenities.
- Typical properties (Median) generate around $2,458 per month, representing the average market performance.
- Entry-level properties (Bottom 25%) see earnings around $1,479, often with potential for optimization.
Average Monthly Airbnb Earnings Trend in Panacea
Panacea Airbnb Occupancy Rate Trends (2026)
Maximize your bookings by understanding the Panacea STR occupancy trends. Seasonal demand shifts significantly influence how often properties are booked. Typically, Julysees the highest demand (peak season occupancy), while January experiences the lowest (low season). Effective strategies, like adjusting minimum stays or offering promotions, can boost occupancy during slower periods. Here's how different property tiers perform in Panacea:
- Best-in-class properties (Top 10%) achieve 80%+ occupancy, indicating high desirability and potentially optimized availability.
- Strong performing properties (Top 25%) maintain 61% or higher occupancy, suggesting good market fit and guest satisfaction.
- Typical properties (Median) have an occupancy rate around 40%.
- Entry-level properties (Bottom 25%) average 23% occupancy, potentially facing higher vacancy.
Average Monthly Occupancy Rate Trend in Panacea
Average Daily Rate (ADR) Airbnb Trends in Panacea (2026)
Effective short term rental pricing strategy in Panacea involves understanding monthly ADR fluctuations. The Average Daily Rate (ADR) for Airbnb in Panacea typically peaks in September and dips lowest during February. Leveraging Airbnb dynamic pricing tools or strategies based on this seasonality can significantly boost revenue. Here's a look at the typical nightly rates achieved:
- Best-in-class properties (Top 10%) command rates of $367+ per night, often due to premium features or locations.
- Strong performing properties (Top 25%) achieve nightly rates of $289 or more.
- Typical properties (Median) charge around $216 per night.
- Entry-level properties (Bottom 25%) earn around $146 per night.
Average Daily Rate (ADR) Trend by Month in Panacea
Get Live Panacea Market Intelligence 👇
Explore Real-time Analytics
Airbnb Seasonality Analysis & Trends in Panacea (2026)
Peak Season (July, June, March)
- Revenue averages $4,295 per month
- Occupancy rates average 56.8%
- Daily rates average $227
Shoulder Season
- Revenue averages $2,964 per month
- Occupancy maintains around 42.1%
- Daily rates hold near $223
Low Season (January, September, December)
- Revenue drops to average $2,283 per month
- Occupancy decreases to average 33.8%
- Daily rates adjust to average $236
Seasonality Insights for Panacea
- The Airbnb seasonality in Panacea shows highly seasonal trends requiring careful strategy. While the sections above show seasonal averages, it's also insightful to look at the extremes:
- During the high season, the absolute peak month showcases Panacea's highest earning potential, with monthly revenues capable of climbing to $4,749, occupancy reaching a high of 57.8%, and ADRs peaking at $243.
- Conversely, the slowest single month of the year, typically falling within the low season, marks the market's lowest point. In this month, revenue might dip to $1,956, occupancy could drop to 30.5%, and ADRs may adjust down to $205.
- Understanding both the seasonal averages and these monthly peaks and troughs in revenue, occupancy, and ADR is crucial for maximizing your Airbnb profit potential in Panacea.
Seasonal Strategies for Maximizing Profit
- Peak Season: Maximize revenue through premium pricing and potentially longer minimum stays. Ensure high availability.
- Low Season: Offer competitive pricing, special promotions (e.g., extended stay discounts), and flexible cancellation policies. Target off-season travelers like remote workers or budget-conscious guests.
- Shoulder Seasons: Implement dynamic pricing that balances peak and low rates. Target weekend travelers or specific events. Offer slightly more flexible terms than peak season.
- Regularly analyze your own performance against these Panacea seasonality benchmarks and adjust your pricing and availability strategy accordingly.
Best Areas for Airbnb Investment in Panacea (2026)
Exploring the top neighborhoods for short-term rentals in Panacea? This section highlights key areas, outlining why they are attractive for hosts and guests, along with notable local attractions. Consider these locations based on your target guest profile and investment strategy.
| Neighborhood / Area | Why Host Here? (Target Guests & Appeal) | Key Attractions & Landmarks |
|---|---|---|
| Panacea Beach | A serene and laid-back coastal area ideal for vacationers seeking relaxation by the Gulf of Mexico. The beach offers beautiful views and opportunities for water activities. | Panacea Beach, Oyster Bay, Sopchoppy River, St. Teresa Beach, Crawfordville River |
| Alligator Point | A quiet, off-the-beaten-path destination perfect for families and nature lovers. Known for its fishing spots and coastal charm, it attracts those wanting a peaceful getaway. | Alligator Point Beach, Fishing Pier, Turtle Beach, Natural Springs, Wildlife Viewing |
| St. Marks National Wildlife Refuge | A nature lover's paradise with stunning wildlife and scenic views. Ideal for ecotourism and attracts visitors interested in hiking, bird watching, and photography. | St. Marks Lighthouse, Bird Watching, Nature Trails, Fishing Opportunities, Scenic Drives |
| Sopchoppy | A charming small town that offers a glimpse into Old Florida. Popular for those seeking local culture and close access to natural attractions such as nearby rivers and forests. | Sopchoppy River, Wakulla Springs, Local Farmers Market, Historic Downtown, Nearby State Parks |
| Crawfordville | The county seat known for its community vibe and access to natural attractions. Great for families and longer stays with proximity to beaches and parks. | Wakulla Springs State Park, Local Shops, Crawfordville Park, Historical Sites, Outdoor Recreation |
| Tallahassee | While a bit further away, it's the capital city with a vibrant cultural scene. Attracts visitors for business and leisure, perfect for a wider range of amenities and attractions. | Florida State Capitol, Tallahassee Museum, Cascade Park, Local Restaurants, Events and Festivals |
| Apalachicola | A historic town known for its seafood and charming downtown. Attracts visitors willing to stay a bit farther for its unique character and waterfront views. | Apalachicola River, Historic District, Local Seafood Dining, St. George Island, Cape San Blas |
| Eastpoint | A small waterfront community known for its outdoor activities and close-knit atmosphere. It appeals to those looking for a quiet getaway with access to beautiful beaches. | Gulf Coast Beaches, Fishing and Boating, Local Seafood Markets, Park Areas, Saltwater Fishing |
Understanding Airbnb License Requirements & STR Laws in Panacea (2026)
While Panacea, Florida, United States currently shows low STR regulations, specific Airbnb license requirements might still exist or change. Always verify the latest short term rental regulations and Airbnb license requirements directly with local government authorities for Panacea to ensure full compliance before hosting.
(Source: AirROI data, 2026, finding no licensed listings among those analyzed)
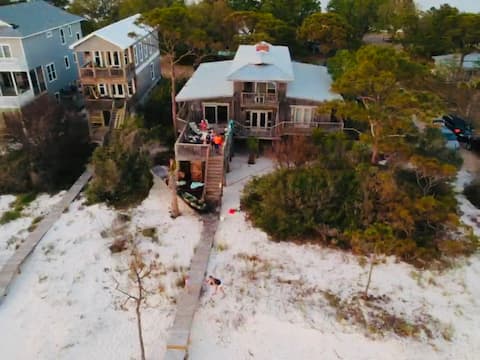
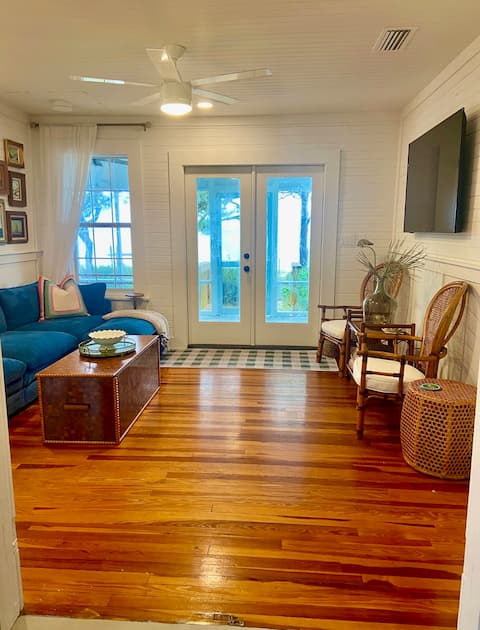
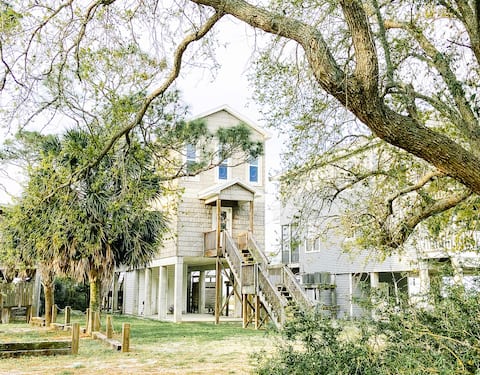
Top Performing Airbnb Properties in Panacea (2026)
Benchmark your potential! Explore examples of top-performing Airbnb properties in Panaceabased on Trailing Twelve Month (TTM) revenue. Analyze their characteristics, revenue, occupancy rate, and ADR to understand what drives success in this market.

Paradise Point! Direct Beachfront Florida Oasis!
Entire Place • 2 bedrooms

Seaglass-on St. Teresa Beach
Entire Place • 2 bedrooms
Beachfront to bay dock, Pool, Pickleball courts
Entire Place • 6 bedrooms
Palmetto Pearl: Hidden Gem of St. Teresa Beach
Entire Place • 3 bedrooms

Bayfront Property/Ocean View/Boat Dock/Pets + More
Entire Place • 3 bedrooms
Beach House, Harbor Dock, Kayaks & Pet Friendly
Entire Place • 2 bedrooms
Note: Performance varies based on location, size, amenities, seasonality, and management quality. Data reflects the past 12 months.
Top Performing Airbnb Hosts in Panacea (2026)
Learn from the best! This table showcases top-performing Airbnb hosts in Panacea based on the number of properties managed and estimated total revenue over the past year. Analyze their scale and performance metrics.
| Host Name | Properties | Grossing Revenue | Stay Reviews | Avg Rating |
|---|---|---|---|---|
| Evolve | 7 | $182,836 | 155 | 4.80/5.0 |
| Krista | 3 | $145,931 | 61 | 5.00/5.0 |
| Robin | 2 | $137,691 | 86 | 4.82/5.0 |
| Ochlockonee Bay Realty | 5 | $133,785 | 72 | 4.97/5.0 |
| Nick | 1 | $132,040 | 130 | 4.96/5.0 |
| Rachel | 1 | $75,000 | 54 | 4.98/5.0 |
| Cameron | 1 | $72,071 | 7 | 5.00/5.0 |
| Molly | 1 | $68,352 | 20 | 4.95/5.0 |
| Agnes | 1 | $61,953 | 94 | 4.97/5.0 |
| David | 1 | $52,019 | 33 | 4.97/5.0 |
Analyzing the strategies of top hosts, such as their property selection, pricing, and guest communication, can offer valuable lessons for optimizing your own Airbnb operations in Panacea.
Dive Deeper: Advanced Panacea STR Market Data (2026)
Ready to unlock more insights? AirROI provides access to advanced metrics and comprehensive Airbnb data for Panacea. Explore detailed analytics beyond this report to refine your investment strategy, optimize pricing, and maximize your vacation rental profits.
Explore Advanced MetricsPanacea Short-Term Rental Market Composition (2026): Property & Room Types
Room Type Distribution
Property Type Distribution
Market Composition Insights for Panacea
- The Panacea Airbnb market composition is heavily skewed towards Entire Home/Apt listings, which make up 100% of the 66 active rentals. This indicates strong guest preference for privacy and space.
- Looking at the property type distribution in Panacea, House properties are the most common (86.4%), reflecting the local real estate landscape.
- Houses represent a significant 86.4% portion, catering likely to families or larger groups.
- Smaller segments like outdoor/unique, unique stays, hotel/boutique (combined 7.5%) offer potential for unique stay experiences.
Panacea Airbnb Room Capacity Analysis (2026): Bedroom Distribution
Distribution of Listings by Number of Bedrooms
Room Capacity Insights for Panacea
- The dominant room capacity in Panacea is 2 bedrooms listings, making up 39.4% of the market. This suggests a strong demand for properties suitable for couples or solo travelers.
- Together, 2 bedrooms and 3 bedrooms properties represent 75.8% of the active Airbnb listings in Panacea, indicating a high concentration in these sizes.
- A significant 51.5% of listings offer 3+ bedrooms, catering to larger groups and families seeking more space in Panacea.
Panacea Vacation Rental Guest Capacity Trends (2026)
Distribution of Listings by Guest Capacity
Guest Capacity Insights for Panacea
- The most common guest capacity trend in Panacea vacation rentals is listings accommodating 6 guests (36.4%). This suggests the primary traveler segment is likely larger groups.
- Properties designed for 6 guests and 8+ guests dominate the Panacea STR market, accounting for 68.2% of listings.
- 72.7% of properties accommodate 6+ guests, serving the market segment for larger families or group travel in Panacea.
- On average, properties in Panacea are equipped to host 6.1 guests.
Panacea Airbnb Booking Patterns (2026): Available vs. Booked Days
Available Days Distribution
Booked Days Distribution
Booking Pattern Insights for Panacea
- The most common availability pattern in Panacea falls within the 181-270 days range, representing 50% of listings. This suggests many properties have significant open periods on their calendars.
- Approximately 77.3% of listings show high availability (181+ days open annually), indicating potential for increased bookings or specific owner usage patterns.
- For booked days, the 91-180 days range is most frequent in Panacea (51.5%), reflecting common guest stay durations or potential owner blocking patterns.
- A notable 24.2% of properties secure long booking periods (181+ days booked per year), highlighting successful long-term rental strategies or significant owner usage.
Panacea Airbnb Minimum Stay Requirements Analysis
Distribution of Listings by Minimum Night Requirement
1 Night
3 listings
4.5% of total
2 Nights
19 listings
28.8% of total
3 Nights
8 listings
12.1% of total
4-6 Nights
10 listings
15.2% of total
7-29 Nights
1 listings
1.5% of total
30+ Nights
25 listings
37.9% of total
Key Insights
- The most prevalent minimum stay requirement in Panacea is 30+ Nights, adopted by 37.9% of listings. This highlights the market's preference for longer commitments.
- A significant segment (37.9%) caters to monthly stays (30+ nights) in Panacea, pointing to opportunities in the extended-stay market.
Recommendations
- Align with the market by considering a 30+ Nights minimum stay, as 37.9% of Panacea hosts use this setting.
- If feasible, allowing 1-night stays, especially midweek or during low season, could capture last-minute bookings, as only 4.5% currently do.
- Explore offering discounts for stays of 30+ nights to attract the 37.9% of the market seeking extended stays.
- Adjust minimum nights based on seasonality – potentially shorter during low season and longer during peak demand periods in Panacea.
Panacea Airbnb Cancellation Policy Trends Analysis (2026)
Limited
2 listings
3% of total
Super Strict 30 Days
1 listings
1.5% of total
Super Strict 60 Days
2 listings
3% of total
Flexible
9 listings
13.6% of total
Moderate
13 listings
19.7% of total
Firm
24 listings
36.4% of total
Strict
15 listings
22.7% of total
Cancellation Policy Insights for Panacea
- The prevailing Airbnb cancellation policy trend in Panacea is Firm, used by 36.4% of listings.
- A majority (59.1%) of hosts in Panacea utilize Firm or Strict policies, indicating a market where hosts prioritize booking security.
Recommendations for Hosts
- Consider adopting a Firm policy to align with the 36.4% market standard in Panacea.
- Regularly review your cancellation policy against competitors and market demand shifts in Panacea.
Panacea STR Booking Lead Time Analysis (2026)
Average Booking Lead Time by Month
Booking Lead Time Insights for Panacea
- The overall average booking lead time for vacation rentals in Panacea is 59 days.
- Guests book furthest in advance for stays during May (average 69 days), likely coinciding with peak travel demand or local events.
- The shortest booking windows occur for stays in December (average 41 days), indicating more last-minute travel plans during this time.
- Seasonally, Spring (64 days avg.) sees the longest lead times, while Winter (52 days avg.) has the shortest, reflecting typical travel planning cycles.
Recommendations for Hosts
- Use the overall average lead time (59 days) as a baseline for your pricing and availability strategy in Panacea.
- Target marketing efforts for the Spring season well in advance (at least 64 days) to capture early planners.
- Monitor your own booking lead times against these Panacea averages to identify opportunities for dynamic pricing adjustments.
Popular & Essential Airbnb Amenities in Panacea (2026)
Amenity Prevalence
Amenity Insights for Panacea
- Essential amenities in Panacea that guests expect include: Air conditioning, Kitchen, TV, Heating, Wifi, Free parking on premises, Smoke alarm, Refrigerator, Bed linens, Dishes and silverware. Lacking these (any) could significantly impact bookings.
Recommendations for Hosts
- Ensure your listing includes all essential amenities for Panacea: Air conditioning, Kitchen, TV, Heating, Wifi, Free parking on premises, Smoke alarm, Refrigerator, Bed linens, Dishes and silverware.
- Prioritize adding missing essentials: Kitchen, TV, Heating, Wifi, Free parking on premises, Smoke alarm, Refrigerator, Bed linens, Dishes and silverware.
- Highlight unique or less common amenities you offer (e.g., hot tub, dedicated workspace, EV charger) in your listing description and photos.
- Regularly check competitor amenities in Panacea to stay competitive.
Panacea Airbnb Guest Demographics & Profile Analysis (2026)
Guest Profile Summary for Panacea
- The typical guest profile for Airbnb in Panacea consists of primarily domestic travelers (98%), often arriving from nearby Tallahassee, typically belonging to the Post-2000s (Gen Z/Alpha) group (50%), primarily speaking English or Spanish.
- Domestic travelers account for 98.1% of guests.
- Key international markets include United States (98.1%) and Switzerland (0.5%).
- Top languages spoken are English (82.2%) followed by Spanish (7%).
- A significant demographic segment is the Post-2000s (Gen Z/Alpha) group, representing 50% of guests.
Recommendations for Hosts
- Target domestic marketing efforts towards travelers from Tallahassee and Jacksonville.
- Tailor amenities and listing descriptions to appeal to the dominant Post-2000s (Gen Z/Alpha) demographic (e.g., highlight fast WiFi, smart home features, local guides).
- Highlight unique local experiences or amenities relevant to the primary guest profile.
- Consider seasonal promotions aligned with peak travel times for key origin markets.
Nearby Short-Term Rental Market Comparison
How does the Panacea Airbnb market stack up against its neighbors? Compare key performance metrics like average monthly revenue, ADR, and occupancy rates in surrounding areas to understand the broader regional STR landscape.
| Market | Active Properties | Monthly Revenue | Daily Rate | Avg. Occupancy |
|---|---|---|---|---|
| Saint George Island | 153 | $4,832 | $490.02 | 43% |
| Gulf County | 13 | $4,070 | $471.61 | 36% |
| Alligator Point | 53 | $4,041 | $309.03 | 47% |
| Port St. Joe | 734 | $3,927 | $473.96 | 38% |
| Cape San Blas | 87 | $3,888 | $543.75 | 35% |
| Indian Pass | 35 | $3,882 | $459.62 | 40% |
| Saint Teresa | 16 | $3,411 | $321.37 | 41% |
| Panama City Beach | 9,974 | $3,029 | $325.93 | 41% |
| Eastpoint | 125 | $3,007 | $373.52 | 37% |
| Port Saint Joe | 321 | $2,785 | $329.87 | 38% |