Palm Beach Gardens Airbnb Market Analysis 2026: Short Term Rental Data & Vacation Rental Statistics in Florida, United States
Is Airbnb profitable in Palm Beach Gardens in 2026? Explore comprehensive Airbnb analytics for Palm Beach Gardens, Florida, United States to uncover income potential. This 2026 STR market report for Palm Beach Gardens, based on AirROI data from February 2025 to January 2026, reveals key trends in the market of 281 active listings.
Whether you're considering an Airbnb investment in Palm Beach Gardens, optimizing your existing vacation rental, or exploring rental arbitrage opportunities, understanding the Palm Beach Gardens Airbnb data is crucial. Navigating the high regulation landscape is key to maximizing your short term rental income potential. Let's dive into the specifics.
Key Palm Beach Gardens Airbnb Performance Metrics Overview
Monthly Airbnb Revenue Variations & Income Potential in Palm Beach Gardens (2026)
Understanding the monthly revenue variations for Airbnb listings in Palm Beach Gardens is key to maximizing your short term rental income potential. Seasonality significantly impacts earnings. Our analysis, based on data from the past 12 months, shows that the peak revenue month for STRs in Palm Beach Gardens is typically March, while September often presents the lowest earnings, highlighting opportunities for strategic pricing adjustments during shoulder and low seasons. Explore the typical Airbnb income in Palm Beach Gardens across different performance tiers:
- Best-in-class properties (Top 10%) achieve $9,329+ monthly, often utilizing dynamic pricing and superior guest experiences.
- Strong performing properties (Top 25%) earn $6,866 or more, indicating effective management and desirable locations/amenities.
- Typical properties (Median) generate around $4,498 per month, representing the average market performance.
- Entry-level properties (Bottom 25%) see earnings around $2,323, often with potential for optimization.
Average Monthly Airbnb Earnings Trend in Palm Beach Gardens
Palm Beach Gardens Airbnb Occupancy Rate Trends (2026)
Maximize your bookings by understanding the Palm Beach Gardens STR occupancy trends. Seasonal demand shifts significantly influence how often properties are booked. Typically, Marchsees the highest demand (peak season occupancy), while September experiences the lowest (low season). Effective strategies, like adjusting minimum stays or offering promotions, can boost occupancy during slower periods. Here's how different property tiers perform in Palm Beach Gardens:
- Best-in-class properties (Top 10%) achieve 87%+ occupancy, indicating high desirability and potentially optimized availability.
- Strong performing properties (Top 25%) maintain 73% or higher occupancy, suggesting good market fit and guest satisfaction.
- Typical properties (Median) have an occupancy rate around 54%.
- Entry-level properties (Bottom 25%) average 31% occupancy, potentially facing higher vacancy.
Average Monthly Occupancy Rate Trend in Palm Beach Gardens
Average Daily Rate (ADR) Airbnb Trends in Palm Beach Gardens (2026)
Effective short term rental pricing strategy in Palm Beach Gardens involves understanding monthly ADR fluctuations. The Average Daily Rate (ADR) for Airbnb in Palm Beach Gardens typically peaks in January and dips lowest during August. Leveraging Airbnb dynamic pricing tools or strategies based on this seasonality can significantly boost revenue. Here's a look at the typical nightly rates achieved:
- Best-in-class properties (Top 10%) command rates of $507+ per night, often due to premium features or locations.
- Strong performing properties (Top 25%) achieve nightly rates of $381 or more.
- Typical properties (Median) charge around $278 per night.
- Entry-level properties (Bottom 25%) earn around $202 per night.
Average Daily Rate (ADR) Trend by Month in Palm Beach Gardens
Get Live Palm Beach Gardens Market Intelligence 👇

Explore Real-time Analytics
Airbnb Seasonality Analysis & Trends in Palm Beach Gardens (2026)
Peak Season (March, February, December)
- Revenue averages $7,590 per month
- Occupancy rates average 64.4%
- Daily rates average $360
Shoulder Season
- Revenue averages $4,510 per month
- Occupancy maintains around 49.4%
- Daily rates hold near $306
Low Season (May, August, September)
- Revenue drops to average $3,447 per month
- Occupancy decreases to average 44.0%
- Daily rates adjust to average $269
Seasonality Insights for Palm Beach Gardens
- The Airbnb seasonality in Palm Beach Gardens shows highly seasonal trends requiring careful strategy. While the sections above show seasonal averages, it's also insightful to look at the extremes:
- During the high season, the absolute peak month showcases Palm Beach Gardens's highest earning potential, with monthly revenues capable of climbing to $8,630, occupancy reaching a high of 74.8%, and ADRs peaking at $384.
- Conversely, the slowest single month of the year, typically falling within the low season, marks the market's lowest point. In this month, revenue might dip to $3,140, occupancy could drop to 39.7%, and ADRs may adjust down to $266.
- Understanding both the seasonal averages and these monthly peaks and troughs in revenue, occupancy, and ADR is crucial for maximizing your Airbnb profit potential in Palm Beach Gardens.
Seasonal Strategies for Maximizing Profit
- Peak Season: Maximize revenue through premium pricing and potentially longer minimum stays. Ensure high availability.
- Low Season: Offer competitive pricing, special promotions (e.g., extended stay discounts), and flexible cancellation policies. Target off-season travelers like remote workers or budget-conscious guests.
- Shoulder Seasons: Implement dynamic pricing that balances peak and low rates. Target weekend travelers or specific events. Offer slightly more flexible terms than peak season.
- Regularly analyze your own performance against these Palm Beach Gardens seasonality benchmarks and adjust your pricing and availability strategy accordingly.
Best Areas for Airbnb Investment in Palm Beach Gardens (2026)
Exploring the top neighborhoods for short-term rentals in Palm Beach Gardens? This section highlights key areas, outlining why they are attractive for hosts and guests, along with notable local attractions. Consider these locations based on your target guest profile and investment strategy.
| Neighborhood / Area | Why Host Here? (Target Guests & Appeal) | Key Attractions & Landmarks |
|---|---|---|
| Marlwood Estates | A serene, family-friendly community with beautiful homes and easy access to top-rated schools and amenities. Ideal for families seeking a peaceful stay close to nature. | Marlwood Park, Palm Beach Gardens Golf Course, The Gardens Mall, Pine Glades Natural Area |
| BallenIsles | An exclusive luxury community known for its stunning golf courses and high-end residences. Attracts affluent travelers looking for upscale accommodations and leisure activities. | BallenIsles Country Club, Palm Beach Gardens Tennis Center, Four Seasons Golf Club |
| Downtown Palm Beach Gardens | A bustling area filled with shopping, dining, and entertainment options, perfect for travelers who enjoy a vibrant lifestyle and modern conveniences. | The Gardens Mall, Downtown at the Gardens, Kravis Center for the Performing Arts, Cinemark, The Cheesecake Factory |
| Eastpointe Country Club | A gated community known for its golf courses and club amenities. Great for those looking to enjoy active leisure and a resort-style atmosphere. | Eastpointe Country Club, Palm Beach Gardens Marina, Riverbend Park |
| Evergrene | A master-planned community with a tropical feel. Known for its lakes and amenities, it's perfect for family vacations and relaxed stays. | Evergrene Nature Center, Crystal Lake, resort-style pool |
| PGA National | Famous for its world-class golf courses and luxury resorts, PGA National is ideal for golf enthusiasts and luxury seekers. | PGA National Resort & Spa, Champions Tour, PGA National Golf Club |
| Lakeridge Falls | An attractive community known for its tranquil environment and active lifestyle. Appeals to those who want a peaceful yet social atmosphere. | Lakeridge Falls Clubhouse, Hiking trails, Community events |
| Floratam | A vibrant residential area known for its family-friendly vibe and accessibility to schools and parks. Great for families visiting the area for vacations or events. | Floratam Park, Palm Beach Gardens Parks, Local eateries |
Understanding Airbnb License Requirements & STR Laws in Palm Beach Gardens (2026)
Yes, Palm Beach Gardens, Florida, United States enforces high STR regulations. Obtaining a license and ensuring compliance is almost certainly required according to current 2026 STR laws. Always verify the latest short term rental regulations and Airbnb license requirements directly with local government authorities for Palm Beach Gardens to ensure full compliance before hosting.
(Source: AirROI data, 2026, based on 95% licensed listings)
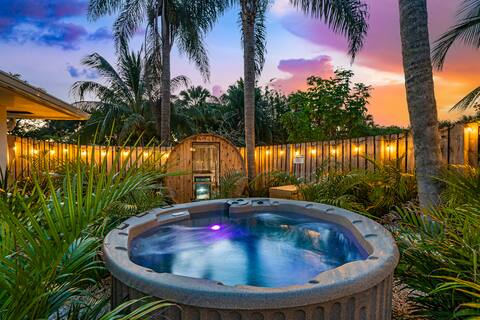
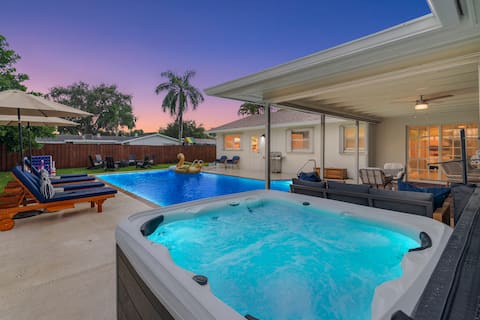
Top Performing Airbnb Properties in Palm Beach Gardens (2026)
Benchmark your potential! Explore examples of top-performing Airbnb properties in Palm Beach Gardensbased on Trailing Twelve Month (TTM) revenue. Analyze their characteristics, revenue, occupancy rate, and ADR to understand what drives success in this market.

Waterfront Villa | BBQ, Htd Pool, Cinema and Tiki
Entire Place • 6 bedrooms

Poolside Paradise w/ Tropical Hut in Palm Beach
Entire Place • 4 bedrooms
Tropical Retreat~Heated Pool ~Game Room~ Sleeps 11
Entire Place • 4 bedrooms

Waterfront Heated Pool & Boat Dock! 5 min to beach
Entire Place • 4 bedrooms
Palm Beach Luxury | 5BR, Pool, Arcade | Sleeps 18
Entire Place • 5 bedrooms

Luxury 4BR Home w/ Pool Near Beach & Golf Courses!
Entire Place • 4 bedrooms
Note: Performance varies based on location, size, amenities, seasonality, and management quality. Data reflects the past 12 months.
Top Performing Airbnb Hosts in Palm Beach Gardens (2026)
Learn from the best! This table showcases top-performing Airbnb hosts in Palm Beach Gardens based on the number of properties managed and estimated total revenue over the past year. Analyze their scale and performance metrics.
| Host Name | Properties | Grossing Revenue | Stay Reviews | Avg Rating |
|---|---|---|---|---|
| Guaranteed Rental | 19 | $1,181,967 | 690 | 4.93/5.0 |
| Panagiotis | 15 | $703,759 | 1382 | 4.88/5.0 |
| Cezar | 7 | $424,287 | 558 | 4.91/5.0 |
| Noah | 6 | $397,209 | 859 | 4.90/5.0 |
| Evolve | 9 | $373,665 | 247 | 4.74/5.0 |
| Laura | 4 | $343,989 | 307 | 4.91/5.0 |
| Taylor | 4 | $333,768 | 195 | 4.79/5.0 |
| Katie & Lance | 4 | $322,892 | 208 | 4.86/5.0 |
| Solara | 1 | $279,336 | 126 | 4.77/5.0 |
| Ang Anthony | 10 | $270,243 | 1349 | 4.86/5.0 |
Analyzing the strategies of top hosts, such as their property selection, pricing, and guest communication, can offer valuable lessons for optimizing your own Airbnb operations in Palm Beach Gardens.
Dive Deeper: Advanced Palm Beach Gardens STR Market Data (2026)
Ready to unlock more insights? AirROI provides access to advanced metrics and comprehensive Airbnb data for Palm Beach Gardens. Explore detailed analytics beyond this report to refine your investment strategy, optimize pricing, and maximize your vacation rental profits.
Explore Advanced MetricsPalm Beach Gardens Short-Term Rental Market Composition (2026): Property & Room Types
Room Type Distribution
Property Type Distribution
Market Composition Insights for Palm Beach Gardens
- The Palm Beach Gardens Airbnb market composition is heavily skewed towards Entire Home/Apt listings, which make up 95.7% of the 281 active rentals. This indicates strong guest preference for privacy and space.
- Looking at the property type distribution in Palm Beach Gardens, House properties are the most common (71.5%), reflecting the local real estate landscape.
- Houses represent a significant 71.5% portion, catering likely to families or larger groups.
- Smaller segments like hotel/boutique (combined 4.3%) offer potential for unique stay experiences.
Palm Beach Gardens Airbnb Room Capacity Analysis (2026): Bedroom Distribution
Distribution of Listings by Number of Bedrooms
Room Capacity Insights for Palm Beach Gardens
- The dominant room capacity in Palm Beach Gardens is 2 bedrooms listings, making up 34.2% of the market. This suggests a strong demand for properties suitable for couples or solo travelers.
- Together, 2 bedrooms and 3 bedrooms properties represent 61.6% of the active Airbnb listings in Palm Beach Gardens, indicating a high concentration in these sizes.
- A significant 49.8% of listings offer 3+ bedrooms, catering to larger groups and families seeking more space in Palm Beach Gardens.
Palm Beach Gardens Vacation Rental Guest Capacity Trends (2026)
Distribution of Listings by Guest Capacity
Guest Capacity Insights for Palm Beach Gardens
- The most common guest capacity trend in Palm Beach Gardens vacation rentals is listings accommodating 8+ guests (33.5%). This suggests the primary traveler segment is likely larger groups.
- Properties designed for 8+ guests and 6 guests dominate the Palm Beach Gardens STR market, accounting for 64.1% of listings.
- 65.9% of properties accommodate 6+ guests, serving the market segment for larger families or group travel in Palm Beach Gardens.
- On average, properties in Palm Beach Gardens are equipped to host 5.7 guests.
Palm Beach Gardens Airbnb Booking Patterns (2026): Available vs. Booked Days
Available Days Distribution
Booked Days Distribution
Booking Pattern Insights for Palm Beach Gardens
- The most common availability pattern in Palm Beach Gardens falls within the 91-180 days range, representing 32.7% of listings. This suggests many properties have significant open periods on their calendars.
- Approximately 59.8% of listings show high availability (181+ days open annually), indicating potential for increased bookings or specific owner usage patterns.
- For booked days, the 181-270 days range is most frequent in Palm Beach Gardens (33.1%), reflecting common guest stay durations or potential owner blocking patterns.
- A notable 41.6% of properties secure long booking periods (181+ days booked per year), highlighting successful long-term rental strategies or significant owner usage.
Palm Beach Gardens Airbnb Minimum Stay Requirements Analysis
Distribution of Listings by Minimum Night Requirement
1 Night
32 listings
11.4% of total
2 Nights
45 listings
16% of total
3 Nights
23 listings
8.2% of total
4-6 Nights
29 listings
10.3% of total
7-29 Nights
38 listings
13.5% of total
30+ Nights
114 listings
40.6% of total
Key Insights
- The most prevalent minimum stay requirement in Palm Beach Gardens is 30+ Nights, adopted by 40.6% of listings. This highlights the market's preference for longer commitments.
- A significant segment (40.6%) caters to monthly stays (30+ nights) in Palm Beach Gardens, pointing to opportunities in the extended-stay market.
Recommendations
- Align with the market by considering a 30+ Nights minimum stay, as 40.6% of Palm Beach Gardens hosts use this setting.
- If feasible, allowing 1-night stays, especially midweek or during low season, could capture last-minute bookings, as only 11.4% currently do.
- Explore offering discounts for stays of 30+ nights to attract the 40.6% of the market seeking extended stays.
- Adjust minimum nights based on seasonality – potentially shorter during low season and longer during peak demand periods in Palm Beach Gardens.
Palm Beach Gardens Airbnb Cancellation Policy Trends Analysis (2026)
Super Strict 30 Days
3 listings
1.1% of total
Limited
3 listings
1.1% of total
Flexible
28 listings
10% of total
Moderate
46 listings
16.4% of total
Firm
141 listings
50.4% of total
Strict
59 listings
21.1% of total
Cancellation Policy Insights for Palm Beach Gardens
- The prevailing Airbnb cancellation policy trend in Palm Beach Gardens is Firm, used by 50.4% of listings.
- A majority (71.5%) of hosts in Palm Beach Gardens utilize Firm or Strict policies, indicating a market where hosts prioritize booking security.
Recommendations for Hosts
- Consider adopting a Firm policy to align with the 50.4% market standard in Palm Beach Gardens.
- Regularly review your cancellation policy against competitors and market demand shifts in Palm Beach Gardens.
Palm Beach Gardens STR Booking Lead Time Analysis (2026)
Average Booking Lead Time by Month
Booking Lead Time Insights for Palm Beach Gardens
- The overall average booking lead time for vacation rentals in Palm Beach Gardens is 50 days.
- Guests book furthest in advance for stays during February (average 81 days), likely coinciding with peak travel demand or local events.
- The shortest booking windows occur for stays in September (average 26 days), indicating more last-minute travel plans during this time.
- Seasonally, Winter (67 days avg.) sees the longest lead times, while Summer (31 days avg.) has the shortest, reflecting typical travel planning cycles.
Recommendations for Hosts
- Use the overall average lead time (50 days) as a baseline for your pricing and availability strategy in Palm Beach Gardens.
- For February stays, consider implementing length-of-stay discounts or slightly higher rates for bookings made less than 81 days out to capitalize on advance planning.
- Target marketing efforts for the Winter season well in advance (at least 67 days) to capture early planners.
- Monitor your own booking lead times against these Palm Beach Gardens averages to identify opportunities for dynamic pricing adjustments.
Popular & Essential Airbnb Amenities in Palm Beach Gardens (2026)
Amenity Prevalence
Amenity Insights for Palm Beach Gardens
- Essential amenities in Palm Beach Gardens that guests expect include: Wifi, Air conditioning, TV, Free parking on premises, Smoke alarm. Lacking these (any) could significantly impact bookings.
- Popular amenities like Hot water, Dishes and silverware, Coffee maker are common but not universal. Offering these can provide a competitive edge.
Recommendations for Hosts
- Ensure your listing includes all essential amenities for Palm Beach Gardens: Wifi, Air conditioning, TV, Free parking on premises, Smoke alarm.
- Prioritize adding missing essentials: TV, Free parking on premises, Smoke alarm.
- Consider adding popular differentiators like Hot water or Dishes and silverware to increase appeal.
- Highlight unique or less common amenities you offer (e.g., hot tub, dedicated workspace, EV charger) in your listing description and photos.
- Regularly check competitor amenities in Palm Beach Gardens to stay competitive.
Palm Beach Gardens Airbnb Guest Demographics & Profile Analysis (2026)
Guest Profile Summary for Palm Beach Gardens
- The typical guest profile for Airbnb in Palm Beach Gardens consists of primarily domestic travelers (91%), often arriving from nearby New York, typically belonging to the Post-2000s (Gen Z/Alpha) group (50%), primarily speaking English or Spanish.
- Domestic travelers account for 90.8% of guests.
- Key international markets include United States (90.8%) and Canada (2.4%).
- Top languages spoken are English (66.2%) followed by Spanish (16.3%).
- A significant demographic segment is the Post-2000s (Gen Z/Alpha) group, representing 50% of guests.
Recommendations for Hosts
- Target domestic marketing efforts towards travelers from New York and Miami.
- Tailor amenities and listing descriptions to appeal to the dominant Post-2000s (Gen Z/Alpha) demographic (e.g., highlight fast WiFi, smart home features, local guides).
- Highlight unique local experiences or amenities relevant to the primary guest profile.
- Consider seasonal promotions aligned with peak travel times for key origin markets.
Nearby Short-Term Rental Market Comparison
How does the Palm Beach Gardens Airbnb market stack up against its neighbors? Compare key performance metrics like average monthly revenue, ADR, and occupancy rates in surrounding areas to understand the broader regional STR landscape.
| Market | Active Properties | Monthly Revenue | Daily Rate | Avg. Occupancy |
|---|---|---|---|---|
| Sailfish Point | 19 | $16,709 | $1587.63 | 48% |
| Bal Harbour Village | 37 | $8,846 | $850.63 | 34% |
| Lake Clarke Shores | 26 | $6,710 | $516.52 | 46% |
| Lighthouse Point | 75 | $6,205 | $472.94 | 51% |
| Pinecrest | 11 | $6,117 | $861.24 | 43% |
| North Bay Village | 120 | $6,032 | $561.12 | 44% |
| Tequesta | 43 | $4,920 | $376.96 | 50% |
| Juno Beach | 39 | $4,807 | $377.00 | 47% |
| Parkland | 17 | $4,637 | $369.21 | 47% |
| Ocean Ridge | 14 | $4,588 | $602.78 | 48% |