Palatka Airbnb Market Analysis 2026: Short Term Rental Data & Vacation Rental Statistics in Florida, United States
Is Airbnb profitable in Palatka in 2026? Explore comprehensive Airbnb analytics for Palatka, Florida, United States to uncover income potential. This 2026 STR market report for Palatka, based on AirROI data from February 2025 to January 2026, reveals key trends in the niche market of 55 active listings.
Whether you're considering an Airbnb investment in Palatka, optimizing your existing vacation rental, or exploring rental arbitrage opportunities, understanding the Palatka Airbnb data is crucial. Leveraging the low regulation environment is key to maximizing your short term rental income potential. Let's dive into the specifics.
Key Palatka Airbnb Performance Metrics Overview
Monthly Airbnb Revenue Variations & Income Potential in Palatka (2026)
Understanding the monthly revenue variations for Airbnb listings in Palatka is key to maximizing your short term rental income potential. Seasonality significantly impacts earnings. Our analysis, based on data from the past 12 months, shows that the peak revenue month for STRs in Palatka is typically March, while June often presents the lowest earnings, highlighting opportunities for strategic pricing adjustments during shoulder and low seasons. Explore the typical Airbnb income in Palatka across different performance tiers:
- Best-in-class properties (Top 10%) achieve $4,412+ monthly, often utilizing dynamic pricing and superior guest experiences.
- Strong performing properties (Top 25%) earn $3,078 or more, indicating effective management and desirable locations/amenities.
- Typical properties (Median) generate around $1,651 per month, representing the average market performance.
- Entry-level properties (Bottom 25%) see earnings around $747, often with potential for optimization.
Average Monthly Airbnb Earnings Trend in Palatka
Palatka Airbnb Occupancy Rate Trends (2026)
Maximize your bookings by understanding the Palatka STR occupancy trends. Seasonal demand shifts significantly influence how often properties are booked. Typically, Februarysees the highest demand (peak season occupancy), while August experiences the lowest (low season). Effective strategies, like adjusting minimum stays or offering promotions, can boost occupancy during slower periods. Here's how different property tiers perform in Palatka:
- Best-in-class properties (Top 10%) achieve 79%+ occupancy, indicating high desirability and potentially optimized availability.
- Strong performing properties (Top 25%) maintain 61% or higher occupancy, suggesting good market fit and guest satisfaction.
- Typical properties (Median) have an occupancy rate around 36%.
- Entry-level properties (Bottom 25%) average 18% occupancy, potentially facing higher vacancy.
Average Monthly Occupancy Rate Trend in Palatka
Average Daily Rate (ADR) Airbnb Trends in Palatka (2026)
Effective short term rental pricing strategy in Palatka involves understanding monthly ADR fluctuations. The Average Daily Rate (ADR) for Airbnb in Palatka typically peaks in December and dips lowest during April. Leveraging Airbnb dynamic pricing tools or strategies based on this seasonality can significantly boost revenue. Here's a look at the typical nightly rates achieved:
- Best-in-class properties (Top 10%) command rates of $305+ per night, often due to premium features or locations.
- Strong performing properties (Top 25%) achieve nightly rates of $183 or more.
- Typical properties (Median) charge around $129 per night.
- Entry-level properties (Bottom 25%) earn around $83 per night.
Average Daily Rate (ADR) Trend by Month in Palatka
Get Live Palatka Market Intelligence 👇

Explore Real-time Analytics
Airbnb Seasonality Analysis & Trends in Palatka (2026)
Peak Season (March, February, July)
- Revenue averages $2,537 per month
- Occupancy rates average 49.9%
- Daily rates average $159
Shoulder Season
- Revenue averages $2,153 per month
- Occupancy maintains around 38.7%
- Daily rates hold near $163
Low Season (May, June, August)
- Revenue drops to average $1,870 per month
- Occupancy decreases to average 33.4%
- Daily rates adjust to average $164
Seasonality Insights for Palatka
- The Airbnb seasonality in Palatka shows moderate seasonality with distinct peak and low periods. While the sections above show seasonal averages, it's also insightful to look at the extremes:
- During the high season, the absolute peak month showcases Palatka's highest earning potential, with monthly revenues capable of climbing to $2,752, occupancy reaching a high of 55.5%, and ADRs peaking at $169.
- Conversely, the slowest single month of the year, typically falling within the low season, marks the market's lowest point. In this month, revenue might dip to $1,810, occupancy could drop to 33.0%, and ADRs may adjust down to $152.
- Understanding both the seasonal averages and these monthly peaks and troughs in revenue, occupancy, and ADR is crucial for maximizing your Airbnb profit potential in Palatka.
Seasonal Strategies for Maximizing Profit
- Peak Season: Maximize revenue through premium pricing and potentially longer minimum stays. Ensure high availability.
- Low Season: Offer competitive pricing, special promotions (e.g., extended stay discounts), and flexible cancellation policies. Target off-season travelers like remote workers or budget-conscious guests.
- Shoulder Seasons: Implement dynamic pricing that balances peak and low rates. Target weekend travelers or specific events. Offer slightly more flexible terms than peak season.
- Regularly analyze your own performance against these Palatka seasonality benchmarks and adjust your pricing and availability strategy accordingly.
Best Areas for Airbnb Investment in Palatka (2026)
Exploring the top neighborhoods for short-term rentals in Palatka? This section highlights key areas, outlining why they are attractive for hosts and guests, along with notable local attractions. Consider these locations based on your target guest profile and investment strategy.
| Neighborhood / Area | Why Host Here? (Target Guests & Appeal) | Key Attractions & Landmarks |
|---|---|---|
| Downtown Palatka | The heart of Palatka, characterized by quaint shops, local eateries, and the historic nature of the city. This area attracts visitors looking for a convenient base with access to amenities and local culture. | Bronson-Mulholland House, Palatka Welcome Center, Palatka Riverfront Park, Putnam County Historical Museum, St. Johns River |
| Putnam County Fairgrounds | A popular location during fair season and events, this area is great for travelers looking to attend local events and enjoy community gatherings throughout the year. | Putnam County Fair, Local events and festivals, Nearby parks for recreation |
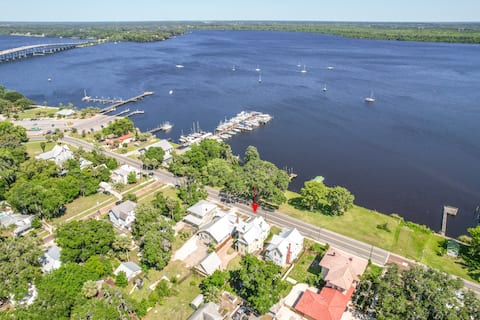
| St. Johns River | Scenic waterfront location ideal for those who enjoy fishing, boating, and outdoor activities. The river attracts visitors seeking nature and relaxation. | Fishing spots, Boating access, St. Johns River State Park, Scenic trails |
| Palatka Historic District | Rich in history and characterized by beautiful historic homes, this district attracts visitors interested in heritage and architecture, making it a prime spot for charming rentals. | Historic architecture, Walking tours, Local boutiques, Gardens and parks |
| Rodman Dam | A unique natural area that draws visitors for fishing and wildlife viewing. Ideal for nature enthusiasts and those looking to escape to quieter surroundings. | Fishing, Wildlife watching, Scenic picnic areas, Nature trails |
| Lake Btochtaw | A serene locale perfect for those seeking tranquility and outdoor activities like kayaking and wildlife observations, appealing to nature lovers. | Kayaking, Bird watching, Picnicking, Scenic views |
| Etoniah Creek State Forest | A beautiful natural forest area, ideal for hiking and outdoor adventures. It attracts eco-tourists and visitors wanting to explore Florida's nature. | Hiking trails, Camping, Wildlife observation |
| Downtown Crescent City | A neighboring town with charming waterfront views and local events. This area offers a slower pace and is perfect for guests looking for a peaceful getaway. | Crescent City harbor, Local farmers market, Historic sites, Nature parks |
Understanding Airbnb License Requirements & STR Laws in Palatka (2026)
While Palatka, Florida, United States currently shows low STR regulations, specific Airbnb license requirements might still exist or change. Always verify the latest short term rental regulations and Airbnb license requirements directly with local government authorities for Palatka to ensure full compliance before hosting.
(Source: AirROI data, 2026, finding no licensed listings among those analyzed)
Top Performing Airbnb Properties in Palatka (2026)
Benchmark your potential! Explore examples of top-performing Airbnb properties in Palatkabased on Trailing Twelve Month (TTM) revenue. Analyze their characteristics, revenue, occupancy rate, and ADR to understand what drives success in this market.

St Johns River House with Amazing Views!
Entire Place • 3 bedrooms

St.Johns Waterfront- POOL;2 Docks;Boat Ramp;10%Off
Entire Place • 6 bedrooms
Waterfront Gem with Private Dock | Walkable Histor
Entire Place • 4 bedrooms
Charming, cozy and quiet river home
Entire Place • 2 bedrooms
River & Ravine Retreat: Relax, Explore, Golf, Fish
Entire Place • 3 bedrooms

Newly built, charming cozy and quiet river home
Entire Place • 2 bedrooms
Note: Performance varies based on location, size, amenities, seasonality, and management quality. Data reflects the past 12 months.
Top Performing Airbnb Hosts in Palatka (2026)
Learn from the best! This table showcases top-performing Airbnb hosts in Palatka based on the number of properties managed and estimated total revenue over the past year. Analyze their scale and performance metrics.
| Host Name | Properties | Grossing Revenue | Stay Reviews | Avg Rating |
|---|---|---|---|---|
| Deborah & Steve | 10 | $151,163 | 313 | 4.84/5.0 |
| Kelly | 3 | $110,555 | 154 | 5.00/5.0 |
| Vicky | 1 | $66,511 | 44 | 4.93/5.0 |
| William | 1 | $66,147 | 18 | 4.67/5.0 |
| Evolve | 2 | $57,938 | 44 | 4.81/5.0 |
| Rent & Relax Vacation Rentals | 1 | $56,840 | 22 | 4.77/5.0 |
| Kristina | 1 | $45,259 | 63 | 4.89/5.0 |
| Dorothy | 1 | $33,829 | 135 | 4.97/5.0 |
| Faith | 1 | $33,209 | 295 | 4.97/5.0 |
| John | 1 | $32,557 | 52 | 4.98/5.0 |
Analyzing the strategies of top hosts, such as their property selection, pricing, and guest communication, can offer valuable lessons for optimizing your own Airbnb operations in Palatka.
Dive Deeper: Advanced Palatka STR Market Data (2026)
Ready to unlock more insights? AirROI provides access to advanced metrics and comprehensive Airbnb data for Palatka. Explore detailed analytics beyond this report to refine your investment strategy, optimize pricing, and maximize your vacation rental profits.
Explore Advanced MetricsPalatka Short-Term Rental Market Composition (2026): Property & Room Types
Room Type Distribution
Property Type Distribution
Market Composition Insights for Palatka
- The Palatka Airbnb market composition is heavily skewed towards Entire Home/Apt listings, which make up 78.2% of the 55 active rentals. This indicates strong guest preference for privacy and space.
- Looking at the property type distribution in Palatka, House properties are the most common (81.8%), reflecting the local real estate landscape.
- Houses represent a significant 81.8% portion, catering likely to families or larger groups.
- Smaller segments like hotel/boutique, others (combined 3.6%) offer potential for unique stay experiences.
Palatka Airbnb Room Capacity Analysis (2026): Bedroom Distribution
Distribution of Listings by Number of Bedrooms
Room Capacity Insights for Palatka
- The dominant room capacity in Palatka is 2 bedrooms listings, making up 32.7% of the market. This suggests a strong demand for properties suitable for couples or solo travelers.
- Together, 2 bedrooms and 3 bedrooms properties represent 52.7% of the active Airbnb listings in Palatka, indicating a high concentration in these sizes.
- A significant 32.7% of listings offer 3+ bedrooms, catering to larger groups and families seeking more space in Palatka.
Palatka Vacation Rental Guest Capacity Trends (2026)
Distribution of Listings by Guest Capacity
Guest Capacity Insights for Palatka
- The most common guest capacity trend in Palatka vacation rentals is listings accommodating 4 guests (21.8%). This suggests the primary traveler segment is likely small families or groups.
- Properties designed for 4 guests and 6 guests dominate the Palatka STR market, accounting for 40.0% of listings.
- 38.2% of properties accommodate 6+ guests, serving the market segment for larger families or group travel in Palatka.
- On average, properties in Palatka are equipped to host 4.2 guests.
Palatka Airbnb Booking Patterns (2026): Available vs. Booked Days
Available Days Distribution
Booked Days Distribution
Booking Pattern Insights for Palatka
- The most common availability pattern in Palatka falls within the 271-366 days range, representing 61.8% of listings. This suggests many properties have significant open periods on their calendars.
- Approximately 83.6% of listings show high availability (181+ days open annually), indicating potential for increased bookings or specific owner usage patterns.
- For booked days, the 31-90 days range is most frequent in Palatka (38.2%), reflecting common guest stay durations or potential owner blocking patterns.
- A notable 16.3% of properties secure long booking periods (181+ days booked per year), highlighting successful long-term rental strategies or significant owner usage.
Palatka Airbnb Minimum Stay Requirements Analysis
Distribution of Listings by Minimum Night Requirement
1 Night
17 listings
30.9% of total
2 Nights
15 listings
27.3% of total
3 Nights
8 listings
14.5% of total
30+ Nights
15 listings
27.3% of total
Key Insights
- The most prevalent minimum stay requirement in Palatka is 1 Night, adopted by 30.9% of listings. This highlights the market's preference for shorter, flexible bookings.
- A significant segment (27.3%) caters to monthly stays (30+ nights) in Palatka, pointing to opportunities in the extended-stay market.
Recommendations
- Align with the market by considering a 1 Night minimum stay, as 30.9% of Palatka hosts use this setting.
- Explore offering discounts for stays of 30+ nights to attract the 27.3% of the market seeking extended stays.
- Adjust minimum nights based on seasonality – potentially shorter during low season and longer during peak demand periods in Palatka.
Palatka Airbnb Cancellation Policy Trends Analysis (2026)
Limited
1 listings
1.8% of total
Flexible
16 listings
29.1% of total
Moderate
12 listings
21.8% of total
Firm
11 listings
20% of total
Strict
15 listings
27.3% of total
Cancellation Policy Insights for Palatka
- The prevailing Airbnb cancellation policy trend in Palatka is Flexible, used by 29.1% of listings.
- There's a relatively balanced mix between guest-friendly (50.9%) and stricter (47.3%) policies, offering choices for different guest needs.
Recommendations for Hosts
- Consider adopting a Flexible policy to align with the 29.1% market standard in Palatka.
- Regularly review your cancellation policy against competitors and market demand shifts in Palatka.
Palatka STR Booking Lead Time Analysis (2026)
Average Booking Lead Time by Month
Booking Lead Time Insights for Palatka
- The overall average booking lead time for vacation rentals in Palatka is 27 days.
- Guests book furthest in advance for stays during February (average 59 days), likely coinciding with peak travel demand or local events.
- The shortest booking windows occur for stays in August (average 16 days), indicating more last-minute travel plans during this time.
- Seasonally, Winter (48 days avg.) sees the longest lead times, while Summer (21 days avg.) has the shortest, reflecting typical travel planning cycles.
Recommendations for Hosts
- Use the overall average lead time (27 days) as a baseline for your pricing and availability strategy in Palatka.
- For February stays, consider implementing length-of-stay discounts or slightly higher rates for bookings made less than 59 days out to capitalize on advance planning.
- Target marketing efforts for the Winter season well in advance (at least 48 days) to capture early planners.
- Monitor your own booking lead times against these Palatka averages to identify opportunities for dynamic pricing adjustments.
Popular & Essential Airbnb Amenities in Palatka (2026)
Amenity Prevalence
Amenity Insights for Palatka
- Essential amenities in Palatka that guests expect include: Air conditioning, Free parking on premises, Refrigerator, Kitchen. Lacking these (any) could significantly impact bookings.
- Popular amenities like TV, Heating, Dishes and silverware are common but not universal. Offering these can provide a competitive edge.
Recommendations for Hosts
- Ensure your listing includes all essential amenities for Palatka: Air conditioning, Free parking on premises, Refrigerator, Kitchen.
- Prioritize adding missing essentials: Refrigerator, Kitchen.
- Consider adding popular differentiators like TV or Heating to increase appeal.
- Highlight unique or less common amenities you offer (e.g., hot tub, dedicated workspace, EV charger) in your listing description and photos.
- Regularly check competitor amenities in Palatka to stay competitive.
Palatka Airbnb Guest Demographics & Profile Analysis (2026)
Guest Profile Summary for Palatka
- The typical guest profile for Airbnb in Palatka consists of primarily domestic travelers (97%), often arriving from nearby Orlando, typically belonging to the Post-2000s (Gen Z/Alpha) group (50%), primarily speaking English or Spanish.
- Domestic travelers account for 97.4% of guests.
- Key international markets include United States (97.4%) and Canada (1.3%).
- Top languages spoken are English (73.8%) followed by Spanish (18.1%).
- A significant demographic segment is the Post-2000s (Gen Z/Alpha) group, representing 50% of guests.
Recommendations for Hosts
- Target domestic marketing efforts towards travelers from Orlando and Miami.
- Tailor amenities and listing descriptions to appeal to the dominant Post-2000s (Gen Z/Alpha) demographic (e.g., highlight fast WiFi, smart home features, local guides).
- Highlight unique local experiences or amenities relevant to the primary guest profile.
- Consider seasonal promotions aligned with peak travel times for key origin markets.
Nearby Short-Term Rental Market Comparison
How does the Palatka Airbnb market stack up against its neighbors? Compare key performance metrics like average monthly revenue, ADR, and occupancy rates in surrounding areas to understand the broader regional STR landscape.
| Market | Active Properties | Monthly Revenue | Daily Rate | Avg. Occupancy |
|---|---|---|---|---|
| St. Johns County | 12 | $6,964 | $592.43 | 47% |
| Reunion | 12 | $6,321 | $580.45 | 44% |
| Ponte Vedra Beach | 224 | $5,720 | $574.75 | 43% |
| Vilano Beach | 173 | $5,571 | $442.95 | 45% |
| Melbourne Beach | 275 | $5,384 | $488.83 | 43% |
| Thonotosassa | 17 | $4,309 | $347.75 | 50% |
| Jacksonville Beach | 763 | $4,123 | $328.32 | 49% |
| Campbell | 22 | $4,011 | $343.05 | 51% |
| Indian Harbour Beach | 131 | $3,895 | $289.71 | 50% |
| Cocoa Beach | 983 | $3,883 | $307.17 | 48% |