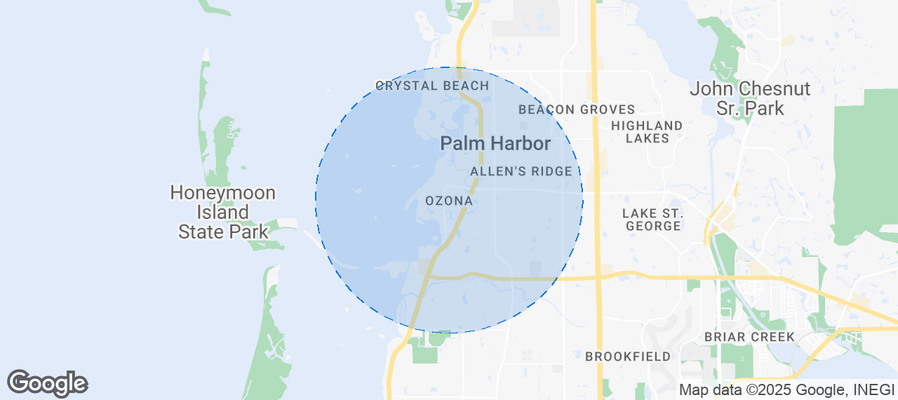
Ozona Airbnb Market Analysis 2026: Short Term Rental Data & Vacation Rental Statistics in Florida, United States
Is Airbnb profitable in Ozona in 2026? Explore comprehensive Airbnb analytics for Ozona, Florida, United States to uncover income potential. This 2026 STR market report for Ozona, based on AirROI data from February 2025 to January 2026, reveals key trends in the niche market of 23 active listings.
Whether you're considering an Airbnb investment in Ozona, optimizing your existing vacation rental, or exploring rental arbitrage opportunities, understanding the Ozona Airbnb data is crucial. Leveraging the low regulation environment is key to maximizing your short term rental income potential. Let's dive into the specifics.
Key Ozona Airbnb Performance Metrics Overview
Monthly Airbnb Revenue Variations & Income Potential in Ozona (2026)
Understanding the monthly revenue variations for Airbnb listings in Ozona is key to maximizing your short term rental income potential. Seasonality significantly impacts earnings. Our analysis, based on data from the past 12 months, shows that the peak revenue month for STRs in Ozona is typically March, while September often presents the lowest earnings, highlighting opportunities for strategic pricing adjustments during shoulder and low seasons. Explore the typical Airbnb income in Ozona across different performance tiers:
- Best-in-class properties (Top 10%) achieve $7,372+ monthly, often utilizing dynamic pricing and superior guest experiences.
- Strong performing properties (Top 25%) earn $3,887 or more, indicating effective management and desirable locations/amenities.
- Typical properties (Median) generate around $2,667 per month, representing the average market performance.
- Entry-level properties (Bottom 25%) see earnings around $1,763, often with potential for optimization.
Average Monthly Airbnb Earnings Trend in Ozona
Ozona Airbnb Occupancy Rate Trends (2026)
Maximize your bookings by understanding the Ozona STR occupancy trends. Seasonal demand shifts significantly influence how often properties are booked. Typically, Marchsees the highest demand (peak season occupancy), while September experiences the lowest (low season). Effective strategies, like adjusting minimum stays or offering promotions, can boost occupancy during slower periods. Here's how different property tiers perform in Ozona:
- Best-in-class properties (Top 10%) achieve 71%+ occupancy, indicating high desirability and potentially optimized availability.
- Strong performing properties (Top 25%) maintain 57% or higher occupancy, suggesting good market fit and guest satisfaction.
- Typical properties (Median) have an occupancy rate around 39%.
- Entry-level properties (Bottom 25%) average 24% occupancy, potentially facing higher vacancy.
Average Monthly Occupancy Rate Trend in Ozona
Average Daily Rate (ADR) Airbnb Trends in Ozona (2026)
Effective short term rental pricing strategy in Ozona involves understanding monthly ADR fluctuations. The Average Daily Rate (ADR) for Airbnb in Ozona typically peaks in March and dips lowest during October. Leveraging Airbnb dynamic pricing tools or strategies based on this seasonality can significantly boost revenue. Here's a look at the typical nightly rates achieved:
- Best-in-class properties (Top 10%) command rates of $474+ per night, often due to premium features or locations.
- Strong performing properties (Top 25%) achieve nightly rates of $265 or more.
- Typical properties (Median) charge around $200 per night.
- Entry-level properties (Bottom 25%) earn around $163 per night.
Average Daily Rate (ADR) Trend by Month in Ozona
Get Live Ozona Market Intelligence 👇
Explore Real-time Analytics
Airbnb Seasonality Analysis & Trends in Ozona (2026)
Peak Season (March, February, April)
- Revenue averages $5,448 per month
- Occupancy rates average 64.6%
- Daily rates average $256
Shoulder Season
- Revenue averages $3,192 per month
- Occupancy maintains around 37.1%
- Daily rates hold near $236
Low Season (January, August, September)
- Revenue drops to average $2,220 per month
- Occupancy decreases to average 29.6%
- Daily rates adjust to average $237
Seasonality Insights for Ozona
- The Airbnb seasonality in Ozona shows highly seasonal trends requiring careful strategy. While the sections above show seasonal averages, it's also insightful to look at the extremes:
- During the high season, the absolute peak month showcases Ozona's highest earning potential, with monthly revenues capable of climbing to $6,680, occupancy reaching a high of 73.8%, and ADRs peaking at $266.
- Conversely, the slowest single month of the year, typically falling within the low season, marks the market's lowest point. In this month, revenue might dip to $1,789, occupancy could drop to 22.6%, and ADRs may adjust down to $227.
- Understanding both the seasonal averages and these monthly peaks and troughs in revenue, occupancy, and ADR is crucial for maximizing your Airbnb profit potential in Ozona.
Seasonal Strategies for Maximizing Profit
- Peak Season: Maximize revenue through premium pricing and potentially longer minimum stays. Ensure high availability.
- Low Season: Offer competitive pricing, special promotions (e.g., extended stay discounts), and flexible cancellation policies. Target off-season travelers like remote workers or budget-conscious guests.
- Shoulder Seasons: Implement dynamic pricing that balances peak and low rates. Target weekend travelers or specific events. Offer slightly more flexible terms than peak season.
- Regularly analyze your own performance against these Ozona seasonality benchmarks and adjust your pricing and availability strategy accordingly.
Best Areas for Airbnb Investment in Ozona (2026)
Exploring the top neighborhoods for short-term rentals in Ozona? This section highlights key areas, outlining why they are attractive for hosts and guests, along with notable local attractions. Consider these locations based on your target guest profile and investment strategy.
| Neighborhood / Area | Why Host Here? (Target Guests & Appeal) | Key Attractions & Landmarks |
|---|---|---|
| Ozona Historic District | Charming old town area with preserved buildings, local shops, and a quaint atmosphere. Ideal for tourists looking for a relaxing retreat close to nature and warm hospitality. | Ozona Village, Bayshore Boulevard, Wall Springs Park, Ozona Blue Grilling Co., Honeymoon Island State Park, Dunedin Causeway |
| Honeymoon Island | Beautiful state park known for its stunning beaches and nature trails. A favorite among families and nature lovers, perfect for guests looking to enjoy outdoor activities and peaceful surroundings. | Honeymoon Island's Beaches, Nature Trails, Wildlife Viewing, Kayaking & Canoeing, Fishing Areas |
| Caladesi Island | Beautiful island accessible by ferry or kayak, known for its pristine beaches. Great for travelers seeking a remote and natural experience away from the crowded tourist spots. | Caladesi Island State Park, Beautiful Beaches, Nature Trails, Bird Watching, Shell Collecting |
| Dunedin | A vibrant town known for its Scottish heritage, art scene, and local breweries. Attracts visitors looking for a friendly atmosphere with plenty of recreational activities and events. | Dunedin Marina, Pinellas Trail, Honeymoon Island Ferry, Local Breweries, Dunedin Historical Museum |
| Tarpon Springs | Known for its rich Greek heritage and sponge diving industry. Offers unique cultural experiences and is popular among tourists interested in history and cuisine. | Tarpon Springs Sponge Docks, Historic District, Greek Cuisine Restaurants, Sunset Beach, Anclote Key |
| Palm Harbor | Family-friendly community with great parks and a lively downtown. Attractive to families and travelers looking for a suburban experience near beaches. | John Chesnut Sr. Park, Crystal Beach, Palm Harbor Village, Local Shops and Restaurants |
| Crystal Beach | A picturesque area with a small-town vibe, great views, and access to beaches. Ideal for visitors wanting a laid-back getaway close to nature. | Crystal Beach Pier, Sunset Beach, Local Parks, Beachfront Restaurants |
| West Pasco | A diverse area with a mix of suburban life and outdoor activities. Appeals to a wide range of travelers looking for a convenient base to explore the region. | Jay B. Starkey Wilderness Park, Port Richey, Local Arts and Crafts, Waterfront Activities |
Understanding Airbnb License Requirements & STR Laws in Ozona (2026)
While Ozona, Florida, United States currently shows low STR regulations, specific Airbnb license requirements might still exist or change. Always verify the latest short term rental regulations and Airbnb license requirements directly with local government authorities for Ozona to ensure full compliance before hosting.
(Source: AirROI data, 2026, finding no licensed listings among those analyzed)
Top Performing Airbnb Properties in Ozona (2026)
Benchmark your potential! Explore examples of top-performing Airbnb properties in Ozonabased on Trailing Twelve Month (TTM) revenue. Analyze their characteristics, revenue, occupancy rate, and ADR to understand what drives success in this market.
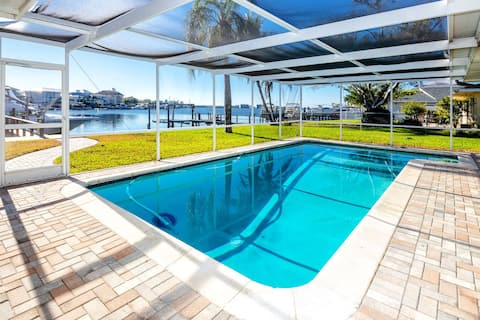
Luxe Private Waterfront Getaway with Pool in Ozona
Entire Place • 3 bedrooms
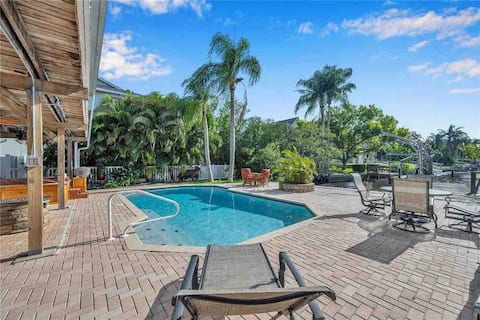
Pinecrest Paradise
Entire Place • 4 bedrooms

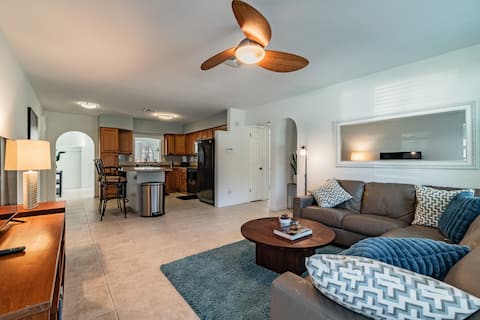
HotTub+Movie+GameRoom+Arcade+GolfCart | Near Beach
Entire Place • 4 bedrooms
3 bed/2 bath Home W/ Gulf Water Access
Entire Place • 3 bedrooms
Waterfront 2/1 Apt in heart of Palm Harbor/Ozona
Entire Place • 2 bedrooms

Ozona Guesths-3blks to Pinellas Trl, Brewery/Eats
Entire Place • N/A
Note: Performance varies based on location, size, amenities, seasonality, and management quality. Data reflects the past 12 months.
Top Performing Airbnb Hosts in Ozona (2026)
Learn from the best! This table showcases top-performing Airbnb hosts in Ozona based on the number of properties managed and estimated total revenue over the past year. Analyze their scale and performance metrics.
| Host Name | Properties | Grossing Revenue | Stay Reviews | Avg Rating |
|---|---|---|---|---|
| Anthony | 5 | $158,890 | 282 | 4.82/5.0 |
| Patrick | 1 | $126,376 | 88 | 4.93/5.0 |
| Pam | 5 | $115,621 | 189 | 4.99/5.0 |
| Geoffrey | 1 | $91,088 | 30 | 4.90/5.0 |
| Leslie | 1 | $88,006 | 25 | 5.00/5.0 |
| Eric | 3 | $43,444 | 266 | 4.92/5.0 |
| Kyle And Nicole | 1 | $30,836 | 30 | 4.87/5.0 |
| Greg | 1 | $27,243 | 40 | 4.93/5.0 |
| Susan | 1 | $26,927 | 84 | 4.99/5.0 |
| Pete | 1 | $23,128 | 9 | 4.78/5.0 |
Analyzing the strategies of top hosts, such as their property selection, pricing, and guest communication, can offer valuable lessons for optimizing your own Airbnb operations in Ozona.
Dive Deeper: Advanced Ozona STR Market Data (2026)
Ready to unlock more insights? AirROI provides access to advanced metrics and comprehensive Airbnb data for Ozona. Explore detailed analytics beyond this report to refine your investment strategy, optimize pricing, and maximize your vacation rental profits.
Explore Advanced MetricsOzona Short-Term Rental Market Composition (2026): Property & Room Types
Room Type Distribution
Property Type Distribution
Market Composition Insights for Ozona
- The Ozona Airbnb market composition is heavily skewed towards Entire Home/Apt listings, which make up 82.6% of the 23 active rentals. This indicates strong guest preference for privacy and space.
- Looking at the property type distribution in Ozona, House properties are the most common (39.1%), reflecting the local real estate landscape.
- Houses represent a significant 39.1% portion, catering likely to families or larger groups.
- The presence of 21.7% Hotel/Boutique listings indicates integration with traditional hospitality.
- Smaller segments like others (combined 4.3%) offer potential for unique stay experiences.
Ozona Airbnb Room Capacity Analysis (2026): Bedroom Distribution
Distribution of Listings by Number of Bedrooms
Room Capacity Insights for Ozona
- The dominant room capacity in Ozona is 1 bedroom listings, making up 30.4% of the market. This suggests a strong demand for properties suitable for couples or solo travelers.
- Together, 1 bedroom and 2 bedrooms properties represent 56.5% of the active Airbnb listings in Ozona, indicating a high concentration in these sizes.
- A significant 34.8% of listings offer 3+ bedrooms, catering to larger groups and families seeking more space in Ozona.
Ozona Vacation Rental Guest Capacity Trends (2026)
Distribution of Listings by Guest Capacity
Guest Capacity Insights for Ozona
- The most common guest capacity trend in Ozona vacation rentals is listings accommodating 4 guests (26.1%). This suggests the primary traveler segment is likely small families or groups.
- Properties designed for 4 guests and 2 guests dominate the Ozona STR market, accounting for 52.2% of listings.
- 34.7% of properties accommodate 6+ guests, serving the market segment for larger families or group travel in Ozona.
- On average, properties in Ozona are equipped to host 4.3 guests.
Ozona Airbnb Booking Patterns (2026): Available vs. Booked Days
Available Days Distribution
Booked Days Distribution
Booking Pattern Insights for Ozona
- The most common availability pattern in Ozona falls within the 181-270 days range, representing 52.2% of listings. This suggests many properties have significant open periods on their calendars.
- Approximately 78.3% of listings show high availability (181+ days open annually), indicating potential for increased bookings or specific owner usage patterns.
- For booked days, the 91-180 days range is most frequent in Ozona (52.2%), reflecting common guest stay durations or potential owner blocking patterns.
- A notable 21.7% of properties secure long booking periods (181+ days booked per year), highlighting successful long-term rental strategies or significant owner usage.
Ozona Airbnb Minimum Stay Requirements Analysis
Distribution of Listings by Minimum Night Requirement
1 Night
1 listings
4.3% of total
2 Nights
6 listings
26.1% of total
3 Nights
2 listings
8.7% of total
4-6 Nights
5 listings
21.7% of total
7-29 Nights
1 listings
4.3% of total
30+ Nights
8 listings
34.8% of total
Key Insights
- The most prevalent minimum stay requirement in Ozona is 30+ Nights, adopted by 34.8% of listings. This highlights the market's preference for longer commitments.
- A significant segment (34.8%) caters to monthly stays (30+ nights) in Ozona, pointing to opportunities in the extended-stay market.
Recommendations
- Align with the market by considering a 30+ Nights minimum stay, as 34.8% of Ozona hosts use this setting.
- If feasible, allowing 1-night stays, especially midweek or during low season, could capture last-minute bookings, as only 4.3% currently do.
- Explore offering discounts for stays of 30+ nights to attract the 34.8% of the market seeking extended stays.
- Adjust minimum nights based on seasonality – potentially shorter during low season and longer during peak demand periods in Ozona.
Ozona Airbnb Cancellation Policy Trends Analysis (2026)
Flexible
1 listings
4.3% of total
Moderate
8 listings
34.8% of total
Firm
10 listings
43.5% of total
Strict
4 listings
17.4% of total
Cancellation Policy Insights for Ozona
- The prevailing Airbnb cancellation policy trend in Ozona is Firm, used by 43.5% of listings.
- A majority (60.9%) of hosts in Ozona utilize Firm or Strict policies, indicating a market where hosts prioritize booking security.
Recommendations for Hosts
- Consider adopting a Firm policy to align with the 43.5% market standard in Ozona.
- Regularly review your cancellation policy against competitors and market demand shifts in Ozona.
Ozona STR Booking Lead Time Analysis (2026)
Average Booking Lead Time by Month
Booking Lead Time Insights for Ozona
- The overall average booking lead time for vacation rentals in Ozona is 50 days.
- Guests book furthest in advance for stays during March (average 138 days), likely coinciding with peak travel demand or local events.
- The shortest booking windows occur for stays in August (average 18 days), indicating more last-minute travel plans during this time.
- Seasonally, Spring (84 days avg.) sees the longest lead times, while Summer (23 days avg.) has the shortest, reflecting typical travel planning cycles.
Recommendations for Hosts
- Use the overall average lead time (50 days) as a baseline for your pricing and availability strategy in Ozona.
- For March stays, consider implementing length-of-stay discounts or slightly higher rates for bookings made less than 138 days out to capitalize on advance planning.
- Target marketing efforts for the Spring season well in advance (at least 84 days) to capture early planners.
- Monitor your own booking lead times against these Ozona averages to identify opportunities for dynamic pricing adjustments.
Popular & Essential Airbnb Amenities in Ozona (2026)
Amenity Prevalence
Amenity Insights for Ozona
- Essential amenities in Ozona that guests expect include: Smoke alarm, Wifi, TV, Free parking on premises, Cooking basics, Hair dryer, Kitchen, Air conditioning, Heating, Dishes and silverware. Lacking these (any) could significantly impact bookings.
Recommendations for Hosts
- Ensure your listing includes all essential amenities for Ozona: Smoke alarm, Wifi, TV, Free parking on premises, Cooking basics, Hair dryer, Kitchen, Air conditioning, Heating, Dishes and silverware.
- Prioritize adding missing essentials: Cooking basics, Hair dryer, Kitchen, Air conditioning, Heating, Dishes and silverware.
- Highlight unique or less common amenities you offer (e.g., hot tub, dedicated workspace, EV charger) in your listing description and photos.
- Regularly check competitor amenities in Ozona to stay competitive.
Ozona Airbnb Guest Demographics & Profile Analysis (2026)
Guest Profile Summary for Ozona
- The typical guest profile for Airbnb in Ozona consists of primarily domestic travelers (95%), often arriving from nearby Clearwater, typically belonging to the Post-2000s (Gen Z/Alpha) group (50%), primarily speaking English or Spanish.
- Domestic travelers account for 95.3% of guests.
- Key international markets include United States (95.3%) and Mexico (1.9%).
- Top languages spoken are English (65.5%) followed by Spanish (22.4%).
- A significant demographic segment is the Post-2000s (Gen Z/Alpha) group, representing 50% of guests.
Recommendations for Hosts
- Target domestic marketing efforts towards travelers from Clearwater and Orlando.
- Tailor amenities and listing descriptions to appeal to the dominant Post-2000s (Gen Z/Alpha) demographic (e.g., highlight fast WiFi, smart home features, local guides).
- Highlight unique local experiences or amenities relevant to the primary guest profile.
- Consider seasonal promotions aligned with peak travel times for key origin markets.
Nearby Short-Term Rental Market Comparison
How does the Ozona Airbnb market stack up against its neighbors? Compare key performance metrics like average monthly revenue, ADR, and occupancy rates in surrounding areas to understand the broader regional STR landscape.
| Market | Active Properties | Monthly Revenue | Daily Rate | Avg. Occupancy |
|---|---|---|---|---|
| Anna Maria island | 587 | $7,996 | $823.96 | 41% |
| Anna Maria | 56 | $6,434 | $692.96 | 52% |
| Reunion | 12 | $6,321 | $580.45 | 44% |
| Vilano Beach | 173 | $5,571 | $442.95 | 45% |
| Indian Rocks Beach | 842 | $5,560 | $419.63 | 49% |
| Siesta Key | 1,175 | $5,206 | $518.91 | 42% |
| Belleair Beach | 94 | $5,086 | $339.65 | 53% |
| Bradenton Beach | 122 | $4,977 | $507.12 | 42% |
| Thonotosassa | 17 | $4,309 | $347.75 | 50% |
| Seminole | 519 | $4,223 | $316.69 | 52% |