Osprey Airbnb Market Analysis 2026: Short Term Rental Data & Vacation Rental Statistics in Florida, United States
Is Airbnb profitable in Osprey in 2026? Explore comprehensive Airbnb analytics for Osprey, Florida, United States to uncover income potential. This 2026 STR market report for Osprey, based on AirROI data from February 2025 to January 2026, reveals key trends in the niche market of 31 active listings.
Whether you're considering an Airbnb investment in Osprey, optimizing your existing vacation rental, or exploring rental arbitrage opportunities, understanding the Osprey Airbnb data is crucial. Leveraging the low regulation environment is key to maximizing your short term rental income potential. Let's dive into the specifics.
Key Osprey Airbnb Performance Metrics Overview
Monthly Airbnb Revenue Variations & Income Potential in Osprey (2026)
Understanding the monthly revenue variations for Airbnb listings in Osprey is key to maximizing your short term rental income potential. Seasonality significantly impacts earnings. Our analysis, based on data from the past 12 months, shows that the peak revenue month for STRs in Osprey is typically March, while September often presents the lowest earnings, highlighting opportunities for strategic pricing adjustments during shoulder and low seasons. Explore the typical Airbnb income in Osprey across different performance tiers:
- Best-in-class properties (Top 10%) achieve $6,083+ monthly, often utilizing dynamic pricing and superior guest experiences.
- Strong performing properties (Top 25%) earn $3,547 or more, indicating effective management and desirable locations/amenities.
- Typical properties (Median) generate around $2,231 per month, representing the average market performance.
- Entry-level properties (Bottom 25%) see earnings around $1,394, often with potential for optimization.
Average Monthly Airbnb Earnings Trend in Osprey
Osprey Airbnb Occupancy Rate Trends (2026)
Maximize your bookings by understanding the Osprey STR occupancy trends. Seasonal demand shifts significantly influence how often properties are booked. Typically, Marchsees the highest demand (peak season occupancy), while September experiences the lowest (low season). Effective strategies, like adjusting minimum stays or offering promotions, can boost occupancy during slower periods. Here's how different property tiers perform in Osprey:
- Best-in-class properties (Top 10%) achieve 86%+ occupancy, indicating high desirability and potentially optimized availability.
- Strong performing properties (Top 25%) maintain 66% or higher occupancy, suggesting good market fit and guest satisfaction.
- Typical properties (Median) have an occupancy rate around 44%.
- Entry-level properties (Bottom 25%) average 28% occupancy, potentially facing higher vacancy.
Average Monthly Occupancy Rate Trend in Osprey
Average Daily Rate (ADR) Airbnb Trends in Osprey (2026)
Effective short term rental pricing strategy in Osprey involves understanding monthly ADR fluctuations. The Average Daily Rate (ADR) for Airbnb in Osprey typically peaks in January and dips lowest during May. Leveraging Airbnb dynamic pricing tools or strategies based on this seasonality can significantly boost revenue. Here's a look at the typical nightly rates achieved:
- Best-in-class properties (Top 10%) command rates of $317+ per night, often due to premium features or locations.
- Strong performing properties (Top 25%) achieve nightly rates of $249 or more.
- Typical properties (Median) charge around $171 per night.
- Entry-level properties (Bottom 25%) earn around $122 per night.
Average Daily Rate (ADR) Trend by Month in Osprey
Get Live Osprey Market Intelligence 👇

Explore Real-time Analytics
Airbnb Seasonality Analysis & Trends in Osprey (2026)
Peak Season (March, February, June)
- Revenue averages $4,375 per month
- Occupancy rates average 65.9%
- Daily rates average $201
Shoulder Season
- Revenue averages $2,561 per month
- Occupancy maintains around 44.1%
- Daily rates hold near $198
Low Season (August, September, October)
- Revenue drops to average $1,906 per month
- Occupancy decreases to average 37.0%
- Daily rates adjust to average $187
Seasonality Insights for Osprey
- The Airbnb seasonality in Osprey shows highly seasonal trends requiring careful strategy. While the sections above show seasonal averages, it's also insightful to look at the extremes:
- During the high season, the absolute peak month showcases Osprey's highest earning potential, with monthly revenues capable of climbing to $5,608, occupancy reaching a high of 83.7%, and ADRs peaking at $218.
- Conversely, the slowest single month of the year, typically falling within the low season, marks the market's lowest point. In this month, revenue might dip to $1,721, occupancy could drop to 33.3%, and ADRs may adjust down to $181.
- Understanding both the seasonal averages and these monthly peaks and troughs in revenue, occupancy, and ADR is crucial for maximizing your Airbnb profit potential in Osprey.
Seasonal Strategies for Maximizing Profit
- Peak Season: Maximize revenue through premium pricing and potentially longer minimum stays. Ensure high availability.
- Low Season: Offer competitive pricing, special promotions (e.g., extended stay discounts), and flexible cancellation policies. Target off-season travelers like remote workers or budget-conscious guests.
- Shoulder Seasons: Implement dynamic pricing that balances peak and low rates. Target weekend travelers or specific events. Offer slightly more flexible terms than peak season.
- Regularly analyze your own performance against these Osprey seasonality benchmarks and adjust your pricing and availability strategy accordingly.
Best Areas for Airbnb Investment in Osprey (2026)
Exploring the top neighborhoods for short-term rentals in Osprey? This section highlights key areas, outlining why they are attractive for hosts and guests, along with notable local attractions. Consider these locations based on your target guest profile and investment strategy.
| Neighborhood / Area | Why Host Here? (Target Guests & Appeal) | Key Attractions & Landmarks |
|---|---|---|
| Nokomis Beach | Beautiful beach community known for its serene environment and stunning Gulf views. Ideal for those seeking a quieter retreat close to nature. | Nokomis Beach, Casey Key, Oscar Scherer State Park, Venice Beach, Nokomis Groves |
| Venice | Charming city with a historic downtown, beautiful beaches, and a strong sense of community. Great for vacationers looking for local restaurants and shops. | Venice Beach, Venice Fishing Pier, Sharky's on the Pier, Downtown Venice, The Venetian Waterway Park |
| Casey Key | An exclusive barrier island known for its luxurious homes and beautiful sandy beaches. Attracts high-end travelers seeking privacy and natural beauty. | Casey Key Beach, The Nokomis Beach Park, Drew Bridge, Wild Life Loop, Manasota Key Beach |
| Osprey | A peaceful suburban town with proximity to Sarasota and beautiful nature preserves. Offers a mix of local charm and easy access to bigger city attractions. | Historic Spanish Point, South Creek, Osprey Natural Area, Bay Street Park, Oscar Scherer State Park |
| Sarasota | A cultural hub known for its art, theaters, and beautiful beaches. Attracts those looking for rich cultural experiences and outdoor activities. | Ringling Museum of Art, Siesta Key Beach, St. Armands Circle, The Italian Market, Marie Selby Botanical Gardens |
| Englewood | Laid-back beach town offering access to beautiful Gulf beaches and a friendly atmosphere. Great for families and those seeking a relaxing getaway. | Englewood Beach, Stump Pass Beach State Park, Manasota Key, Blind Pass Beach, Dearborn Street |
| Port Charlotte | Growing suburban area with affordable housing and close proximity to both beaches and nature reserves. Ideal for families and budget-conscious travelers. | Port Charlotte Beach Park, Charlotte Harbor Preserve State Park, Fishermen's Village, The Cultural Center of Charlotte County, Bayshore Live Oak Park |
| Longboat Key | A luxurious community known for its stunning beaches and upscale amenities. Perfect for high-end vacation rentals and those seeking luxury treatments. | Longboat Key Beach, The Longboat Key Club, Beer Can Island, Coquina Beach, The Mote Marine Laboratory |
Understanding Airbnb License Requirements & STR Laws in Osprey (2026)
While Osprey, Florida, United States currently shows low STR regulations, specific Airbnb license requirements might still exist or change. Always verify the latest short term rental regulations and Airbnb license requirements directly with local government authorities for Osprey to ensure full compliance before hosting.
(Source: AirROI data, 2026, finding no licensed listings among those analyzed)
Top Performing Airbnb Properties in Osprey (2026)
Benchmark your potential! Explore examples of top-performing Airbnb properties in Ospreybased on Trailing Twelve Month (TTM) revenue. Analyze their characteristics, revenue, occupancy rate, and ADR to understand what drives success in this market.
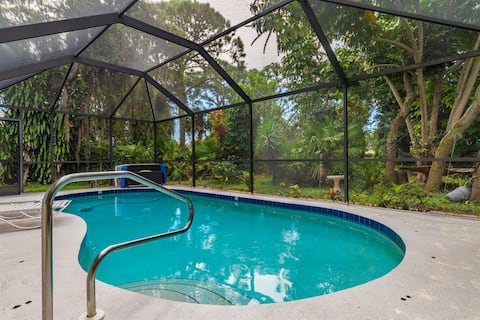
Secluded 3R Pool Home Retreat Near Sarasota
Entire Place • 3 bedrooms

Charming Florida Cottage - Kayaks Included
Entire Place • 2 bedrooms
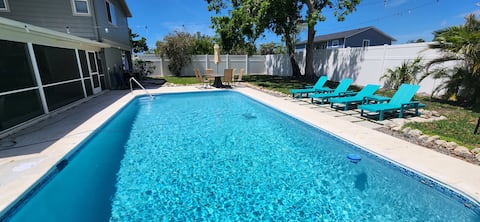
The Pool house retreat
Entire Place • 4 bedrooms

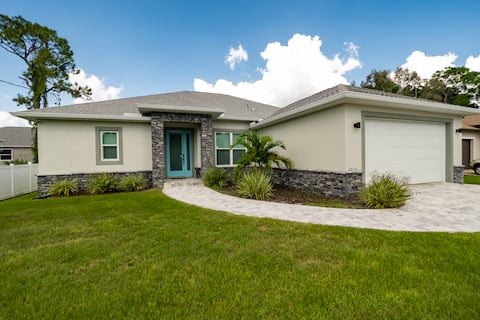
Pet-Friendly Modern Retreat Near Siesta Key
Entire Place • 3 bedrooms
Sarasota vacation Home!
Entire Place • 3 bedrooms
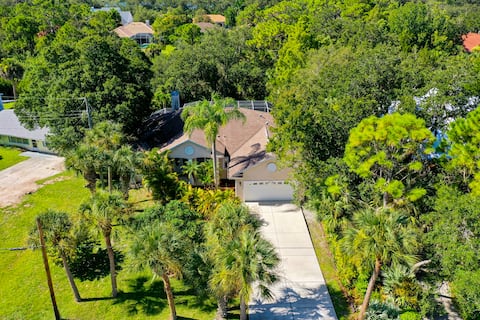
Creekside Paradise I
Entire Place • 3 bedrooms
Note: Performance varies based on location, size, amenities, seasonality, and management quality. Data reflects the past 12 months.
Top Performing Airbnb Hosts in Osprey (2026)
Learn from the best! This table showcases top-performing Airbnb hosts in Osprey based on the number of properties managed and estimated total revenue over the past year. Analyze their scale and performance metrics.
| Host Name | Properties | Grossing Revenue | Stay Reviews | Avg Rating |
|---|---|---|---|---|
| Courtney | 1 | $76,846 | 45 | 5.00/5.0 |
| Todd & Marie | 5 | $74,607 | 485 | 5.00/5.0 |
| Deanna | 2 | $69,294 | 10 | 4.63/5.0 |
| Marina | 1 | $53,036 | 53 | 4.98/5.0 |
| Stay Awhile | 1 | $51,468 | 21 | 4.90/5.0 |
| Andrey | 1 | $45,568 | 50 | 4.98/5.0 |
| Sabine | 1 | $42,410 | 49 | 4.96/5.0 |
| Amanda Cole | 1 | $38,540 | 91 | 4.89/5.0 |
| Kim | 1 | $34,564 | 82 | 4.96/5.0 |
| Laura | 2 | $30,236 | 7 | 2.50/5.0 |
Analyzing the strategies of top hosts, such as their property selection, pricing, and guest communication, can offer valuable lessons for optimizing your own Airbnb operations in Osprey.
Dive Deeper: Advanced Osprey STR Market Data (2026)
Ready to unlock more insights? AirROI provides access to advanced metrics and comprehensive Airbnb data for Osprey. Explore detailed analytics beyond this report to refine your investment strategy, optimize pricing, and maximize your vacation rental profits.
Explore Advanced MetricsOsprey Short-Term Rental Market Composition (2026): Property & Room Types
Room Type Distribution
Property Type Distribution
Market Composition Insights for Osprey
- The Osprey Airbnb market composition is heavily skewed towards Entire Home/Apt listings, which make up 100% of the 31 active rentals. This indicates strong guest preference for privacy and space.
- Looking at the property type distribution in Osprey, House properties are the most common (64.5%), reflecting the local real estate landscape.
- Houses represent a significant 64.5% portion, catering likely to families or larger groups.
- The presence of 19.4% Hotel/Boutique listings indicates integration with traditional hospitality.
Osprey Airbnb Room Capacity Analysis (2026): Bedroom Distribution
Distribution of Listings by Number of Bedrooms
Room Capacity Insights for Osprey
- The dominant room capacity in Osprey is 1 bedroom listings, making up 32.3% of the market. This suggests a strong demand for properties suitable for couples or solo travelers.
- Together, 1 bedroom and 2 bedrooms properties represent 61.3% of the active Airbnb listings in Osprey, indicating a high concentration in these sizes.
- A significant 38.8% of listings offer 3+ bedrooms, catering to larger groups and families seeking more space in Osprey.
Osprey Vacation Rental Guest Capacity Trends (2026)
Distribution of Listings by Guest Capacity
Guest Capacity Insights for Osprey
- The most common guest capacity trend in Osprey vacation rentals is listings accommodating 2 guests (29%). This suggests the primary traveler segment is likely couples or solo travelers.
- Properties designed for 2 guests and 6 guests dominate the Osprey STR market, accounting for 54.8% of listings.
- 51.6% of properties accommodate 6+ guests, serving the market segment for larger families or group travel in Osprey.
- On average, properties in Osprey are equipped to host 5.0 guests.
Osprey Airbnb Booking Patterns (2026): Available vs. Booked Days
Available Days Distribution
Booked Days Distribution
Booking Pattern Insights for Osprey
- The most common availability pattern in Osprey falls within the 271-366 days range, representing 51.6% of listings. This suggests many properties have significant open periods on their calendars.
- Approximately 80.6% of listings show high availability (181+ days open annually), indicating potential for increased bookings or specific owner usage patterns.
- For booked days, the 31-90 days range is most frequent in Osprey (38.7%), reflecting common guest stay durations or potential owner blocking patterns.
- A notable 22.6% of properties secure long booking periods (181+ days booked per year), highlighting successful long-term rental strategies or significant owner usage.
Osprey Airbnb Minimum Stay Requirements Analysis
Distribution of Listings by Minimum Night Requirement
1 Night
1 listings
3.2% of total
2 Nights
6 listings
19.4% of total
3 Nights
1 listings
3.2% of total
7-29 Nights
13 listings
41.9% of total
30+ Nights
10 listings
32.3% of total
Key Insights
- The most prevalent minimum stay requirement in Osprey is 7-29 Nights, adopted by 41.9% of listings. This highlights the market's preference for shorter, flexible bookings.
- A significant segment (32.3%) caters to monthly stays (30+ nights) in Osprey, pointing to opportunities in the extended-stay market.
Recommendations
- Align with the market by considering a 7-29 Nights minimum stay, as 41.9% of Osprey hosts use this setting.
- If feasible, allowing 1-night stays, especially midweek or during low season, could capture last-minute bookings, as only 3.2% currently do.
- Explore offering discounts for stays of 30+ nights to attract the 32.3% of the market seeking extended stays.
- Adjust minimum nights based on seasonality – potentially shorter during low season and longer during peak demand periods in Osprey.
Osprey Airbnb Cancellation Policy Trends Analysis (2026)
Flexible
11 listings
35.5% of total
Moderate
6 listings
19.4% of total
Firm
12 listings
38.7% of total
Strict
2 listings
6.5% of total
Cancellation Policy Insights for Osprey
- The prevailing Airbnb cancellation policy trend in Osprey is Firm, used by 38.7% of listings.
- There's a relatively balanced mix between guest-friendly (54.9%) and stricter (45.2%) policies, offering choices for different guest needs.
- Strict cancellation policies are quite rare (6.5%), potentially making listings with this policy less competitive unless justified by high demand or property type.
Recommendations for Hosts
- Consider adopting a Firm policy to align with the 38.7% market standard in Osprey.
- Using a Strict policy might deter some guests, as only 6.5% of listings use it. Evaluate if potential revenue protection outweighs possible lower booking rates.
- Regularly review your cancellation policy against competitors and market demand shifts in Osprey.
Osprey STR Booking Lead Time Analysis (2026)
Average Booking Lead Time by Month
Booking Lead Time Insights for Osprey
- The overall average booking lead time for vacation rentals in Osprey is 63 days.
- Guests book furthest in advance for stays during February (average 142 days), likely coinciding with peak travel demand or local events.
- The shortest booking windows occur for stays in September (average 17 days), indicating more last-minute travel plans during this time.
- Seasonally, Winter (93 days avg.) sees the longest lead times, while Fall (29 days avg.) has the shortest, reflecting typical travel planning cycles.
Recommendations for Hosts
- Use the overall average lead time (63 days) as a baseline for your pricing and availability strategy in Osprey.
- For February stays, consider implementing length-of-stay discounts or slightly higher rates for bookings made less than 142 days out to capitalize on advance planning.
- Target marketing efforts for the Winter season well in advance (at least 93 days) to capture early planners.
- Monitor your own booking lead times against these Osprey averages to identify opportunities for dynamic pricing adjustments.
Popular & Essential Airbnb Amenities in Osprey (2026)
Amenity Prevalence
Amenity Insights for Osprey
- Essential amenities in Osprey that guests expect include: Free parking on premises, Wifi, Air conditioning, Smoke alarm, TV. Lacking these (any) could significantly impact bookings.
- Popular amenities like Hair dryer, Washer, Hangers are common but not universal. Offering these can provide a competitive edge.
Recommendations for Hosts
- Ensure your listing includes all essential amenities for Osprey: Free parking on premises, Wifi, Air conditioning, Smoke alarm, TV.
- Prioritize adding missing essentials: Smoke alarm, TV.
- Consider adding popular differentiators like Hair dryer or Washer to increase appeal.
- Highlight unique or less common amenities you offer (e.g., hot tub, dedicated workspace, EV charger) in your listing description and photos.
- Regularly check competitor amenities in Osprey to stay competitive.
Osprey Airbnb Guest Demographics & Profile Analysis (2026)
Guest Profile Summary for Osprey
- The typical guest profile for Airbnb in Osprey consists of primarily domestic travelers (95%), often arriving from nearby Cape Coral, typically belonging to the Post-2000s (Gen Z/Alpha) group (50%), primarily speaking English or Spanish.
- Domestic travelers account for 95.3% of guests.
- Key international markets include United States (95.3%) and United Kingdom (1.6%).
- Top languages spoken are English (75.8%) followed by Spanish (7.6%).
- A significant demographic segment is the Post-2000s (Gen Z/Alpha) group, representing 50% of guests.
Recommendations for Hosts
- Target domestic marketing efforts towards travelers from Cape Coral and West Palm Beach.
- Tailor amenities and listing descriptions to appeal to the dominant Post-2000s (Gen Z/Alpha) demographic (e.g., highlight fast WiFi, smart home features, local guides).
- Highlight unique local experiences or amenities relevant to the primary guest profile.
- Consider seasonal promotions aligned with peak travel times for key origin markets.
Nearby Short-Term Rental Market Comparison
How does the Osprey Airbnb market stack up against its neighbors? Compare key performance metrics like average monthly revenue, ADR, and occupancy rates in surrounding areas to understand the broader regional STR landscape.
| Market | Active Properties | Monthly Revenue | Daily Rate | Avg. Occupancy |
|---|---|---|---|---|
| Anna Maria island | 587 | $7,996 | $823.96 | 41% |
| Anna Maria | 56 | $6,434 | $692.96 | 52% |
| Reunion | 12 | $6,321 | $580.45 | 44% |
| Boca Grande | 31 | $6,128 | $787.07 | 37% |
| Indian Rocks Beach | 842 | $5,560 | $419.63 | 49% |
| Captiva | 291 | $5,443 | $667.40 | 36% |
| Siesta Key | 1,175 | $5,206 | $518.91 | 42% |
| Belleair Beach | 94 | $5,086 | $339.65 | 53% |
| Bradenton Beach | 122 | $4,977 | $507.12 | 42% |
| Thonotosassa | 17 | $4,309 | $347.75 | 50% |