Odessa Airbnb Market Analysis 2026: Short Term Rental Data & Vacation Rental Statistics in Florida, United States
Is Airbnb profitable in Odessa in 2026? Explore comprehensive Airbnb analytics for Odessa, Florida, United States to uncover income potential. This 2026 STR market report for Odessa, based on AirROI data from February 2025 to January 2026, reveals key trends in the niche market of 44 active listings.
Whether you're considering an Airbnb investment in Odessa, optimizing your existing vacation rental, or exploring rental arbitrage opportunities, understanding the Odessa Airbnb data is crucial. Leveraging the low regulation environment is key to maximizing your short term rental income potential. Let's dive into the specifics.
Key Odessa Airbnb Performance Metrics Overview
Monthly Airbnb Revenue Variations & Income Potential in Odessa (2026)
Understanding the monthly revenue variations for Airbnb listings in Odessa is key to maximizing your short term rental income potential. Seasonality significantly impacts earnings. Our analysis, based on data from the past 12 months, shows that the peak revenue month for STRs in Odessa is typically March, while August often presents the lowest earnings, highlighting opportunities for strategic pricing adjustments during shoulder and low seasons. Explore the typical Airbnb income in Odessa across different performance tiers:
- Best-in-class properties (Top 10%) achieve $5,140+ monthly, often utilizing dynamic pricing and superior guest experiences.
- Strong performing properties (Top 25%) earn $3,215 or more, indicating effective management and desirable locations/amenities.
- Typical properties (Median) generate around $2,003 per month, representing the average market performance.
- Entry-level properties (Bottom 25%) see earnings around $1,123, often with potential for optimization.
Average Monthly Airbnb Earnings Trend in Odessa
Odessa Airbnb Occupancy Rate Trends (2026)
Maximize your bookings by understanding the Odessa STR occupancy trends. Seasonal demand shifts significantly influence how often properties are booked. Typically, Marchsees the highest demand (peak season occupancy), while August experiences the lowest (low season). Effective strategies, like adjusting minimum stays or offering promotions, can boost occupancy during slower periods. Here's how different property tiers perform in Odessa:
- Best-in-class properties (Top 10%) achieve 78%+ occupancy, indicating high desirability and potentially optimized availability.
- Strong performing properties (Top 25%) maintain 61% or higher occupancy, suggesting good market fit and guest satisfaction.
- Typical properties (Median) have an occupancy rate around 44%.
- Entry-level properties (Bottom 25%) average 23% occupancy, potentially facing higher vacancy.
Average Monthly Occupancy Rate Trend in Odessa
Average Daily Rate (ADR) Airbnb Trends in Odessa (2026)
Effective short term rental pricing strategy in Odessa involves understanding monthly ADR fluctuations. The Average Daily Rate (ADR) for Airbnb in Odessa typically peaks in June and dips lowest during September. Leveraging Airbnb dynamic pricing tools or strategies based on this seasonality can significantly boost revenue. Here's a look at the typical nightly rates achieved:
- Best-in-class properties (Top 10%) command rates of $386+ per night, often due to premium features or locations.
- Strong performing properties (Top 25%) achieve nightly rates of $245 or more.
- Typical properties (Median) charge around $145 per night.
- Entry-level properties (Bottom 25%) earn around $117 per night.
Average Daily Rate (ADR) Trend by Month in Odessa
Get Live Odessa Market Intelligence 👇

Explore Real-time Analytics
Airbnb Seasonality Analysis & Trends in Odessa (2026)
Peak Season (March, January, February)
- Revenue averages $3,137 per month
- Occupancy rates average 57.5%
- Daily rates average $212
Shoulder Season
- Revenue averages $2,577 per month
- Occupancy maintains around 43.4%
- Daily rates hold near $212
Low Season (August, October, November)
- Revenue drops to average $1,781 per month
- Occupancy decreases to average 30.3%
- Daily rates adjust to average $214
Seasonality Insights for Odessa
- The Airbnb seasonality in Odessa shows moderate seasonality with distinct peak and low periods. While the sections above show seasonal averages, it's also insightful to look at the extremes:
- During the high season, the absolute peak month showcases Odessa's highest earning potential, with monthly revenues capable of climbing to $3,297, occupancy reaching a high of 66.4%, and ADRs peaking at $222.
- Conversely, the slowest single month of the year, typically falling within the low season, marks the market's lowest point. In this month, revenue might dip to $1,639, occupancy could drop to 28.4%, and ADRs may adjust down to $192.
- Understanding both the seasonal averages and these monthly peaks and troughs in revenue, occupancy, and ADR is crucial for maximizing your Airbnb profit potential in Odessa.
Seasonal Strategies for Maximizing Profit
- Peak Season: Maximize revenue through premium pricing and potentially longer minimum stays. Ensure high availability.
- Low Season: Offer competitive pricing, special promotions (e.g., extended stay discounts), and flexible cancellation policies. Target off-season travelers like remote workers or budget-conscious guests.
- Shoulder Seasons: Implement dynamic pricing that balances peak and low rates. Target weekend travelers or specific events. Offer slightly more flexible terms than peak season.
- Regularly analyze your own performance against these Odessa seasonality benchmarks and adjust your pricing and availability strategy accordingly.
Best Areas for Airbnb Investment in Odessa (2026)
Exploring the top neighborhoods for short-term rentals in Odessa? This section highlights key areas, outlining why they are attractive for hosts and guests, along with notable local attractions. Consider these locations based on your target guest profile and investment strategy.
| Neighborhood / Area | Why Host Here? (Target Guests & Appeal) | Key Attractions & Landmarks |
|---|---|---|
| Indian Shores | A beautiful beach town known for its powdery white sand beaches and a relaxed atmosphere. It attracts beach lovers and those seeking a peaceful getaway. | Indian Shores Beach, Tiki Gardens, Splash Harbour Water Park, John's Pass Village and Boardwalk, Suncoast Seabird Sanctuary |
| Treasure Island | Popular with families and vacationers for its stunning sunsets and water activities. Great for hosting families and beachgoers. | Treasure Island Beach, John's Pass, Sunset Beach, Treasure Island Marina, Gulf Beaches Historical Museum |
| Clearwater Beach | Famous for its stunning beach and vibrant tourist scene. Ideal for hosting tourists looking for nightlife and dining options. | Clearwater Beach, Pier 60, Marine Aquarium, Caladesi Island State Park, Sand Key Park |
| St. Pete Beach | A vibrant beach community known for its friendly vibe and beautiful shoreline. Attracts visitors looking for relaxation and entertainment. | St. Pete Beach, Pass-a-Grille Beach, Fort De Soto Park, The Don CeSar, Beachfront restaurants |
| Dunedin | Charming town with beautiful parks and a coastal waterfront. Known for its quaint downtown and craft beer scene. | Dunedin Marina, Honeymoon Island State Park, Caladesi Island State Park, Dunedin Fine Art Center, Craft breweries |
| Palm Harbor | Residential area with access to beautiful parks and beaches. Appeals to families and those looking for a quieter vacation. | Wall Springs Park, Dunedin Causeway, Lake Tarpon, Florida Botanical Gardens, Pinellas Trail |
| Safety Harbor | Known for its historic downtown and spa. Attracts visitors seeking relaxation and wellness experiences. | Safety Harbor Spa, Phillippe Park, Safety Harbor Museum, Old Tampa Bay, The Dog Park |
| Tarpon Springs | Famous for its sponge diving industry and vibrant Greek heritage. Attracts tourists interested in unique cultural experiences. | Tarpon Springs Sponge Docks, Greek Town, Anclote River Park, Lighthouse Island Park, St. Nicholas Greek Orthodox Cathedral |
Understanding Airbnb License Requirements & STR Laws in Odessa (2026)
While Odessa, Florida, United States currently shows low STR regulations, specific Airbnb license requirements might still exist or change. Always verify the latest short term rental regulations and Airbnb license requirements directly with local government authorities for Odessa to ensure full compliance before hosting.
(Source: AirROI data, 2026, based on 2% licensed listings)
Top Performing Airbnb Properties in Odessa (2026)
Benchmark your potential! Explore examples of top-performing Airbnb properties in Odessabased on Trailing Twelve Month (TTM) revenue. Analyze their characteristics, revenue, occupancy rate, and ADR to understand what drives success in this market.
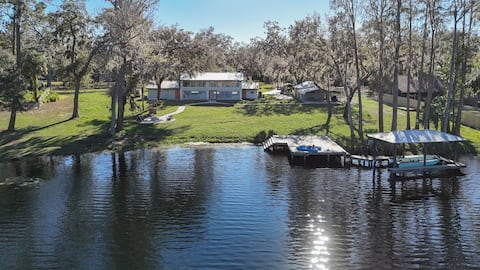
Awesome Family Lake House!
Entire Place • 4 bedrooms

The Robins Nest|Lakefront Home w/ Pool & Theater
Entire Place • 4 bedrooms

A perfect Lake House get away
Entire Place • 2 bedrooms

Lakefront Cabin Retreat: Hot Tub, Kayak & PingPong
Entire Place • 3 bedrooms
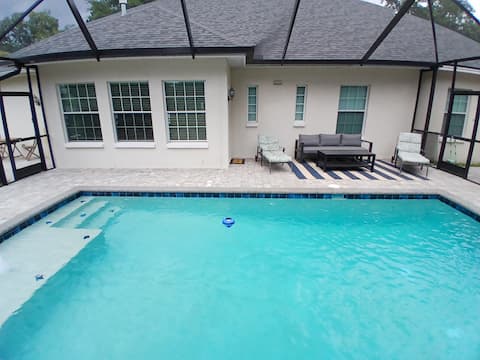
Charming 3 BR/2 BA House w/ Pool
Entire Place • 3 bedrooms
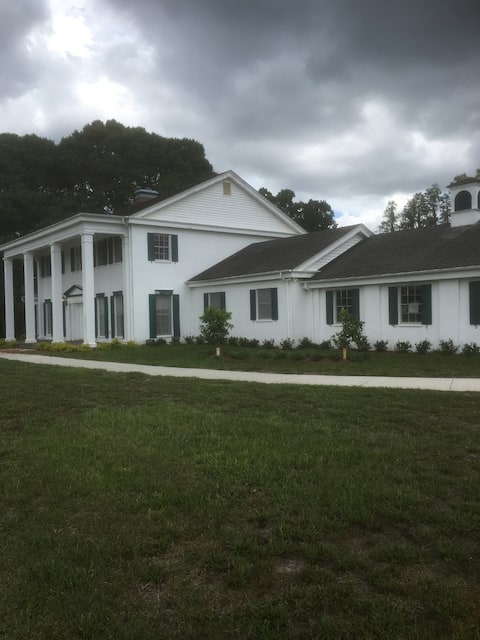
The Manor at Stark Farms
Entire Place • 4 bedrooms
Note: Performance varies based on location, size, amenities, seasonality, and management quality. Data reflects the past 12 months.
Top Performing Airbnb Hosts in Odessa (2026)
Learn from the best! This table showcases top-performing Airbnb hosts in Odessa based on the number of properties managed and estimated total revenue over the past year. Analyze their scale and performance metrics.
| Host Name | Properties | Grossing Revenue | Stay Reviews | Avg Rating |
|---|---|---|---|---|
| David And Kathryn | 1 | $91,225 | 16 | 5.00/5.0 |
| John And Martha | 8 | $77,809 | 466 | 4.95/5.0 |
| Marvin | 4 | $66,119 | 316 | 4.92/5.0 |
| Joyful Moments Vacation Rental | 3 | $63,411 | 223 | 4.84/5.0 |
| Stay Teal Door | 1 | $59,251 | 4 | 4.75/5.0 |
| Richard | 1 | $57,812 | 118 | 4.96/5.0 |
| Dan | 2 | $57,211 | 55 | 4.97/5.0 |
| Laurel | 2 | $51,086 | 530 | 4.98/5.0 |
| Kalie | 1 | $42,783 | 20 | 4.90/5.0 |
| Robert | 1 | $40,594 | 67 | 4.81/5.0 |
Analyzing the strategies of top hosts, such as their property selection, pricing, and guest communication, can offer valuable lessons for optimizing your own Airbnb operations in Odessa.
Dive Deeper: Advanced Odessa STR Market Data (2026)
Ready to unlock more insights? AirROI provides access to advanced metrics and comprehensive Airbnb data for Odessa. Explore detailed analytics beyond this report to refine your investment strategy, optimize pricing, and maximize your vacation rental profits.
Explore Advanced MetricsOdessa Short-Term Rental Market Composition (2026): Property & Room Types
Room Type Distribution
Property Type Distribution
Market Composition Insights for Odessa
- The Odessa Airbnb market composition is heavily skewed towards Entire Home/Apt listings, which make up 86.4% of the 44 active rentals. This indicates strong guest preference for privacy and space.
- Looking at the property type distribution in Odessa, House properties are the most common (45.5%), reflecting the local real estate landscape.
- Houses represent a significant 45.5% portion, catering likely to families or larger groups.
- The presence of 9.1% Hotel/Boutique listings indicates integration with traditional hospitality.
- Smaller segments like apartment/condo (combined 2.3%) offer potential for unique stay experiences.
Odessa Airbnb Room Capacity Analysis (2026): Bedroom Distribution
Distribution of Listings by Number of Bedrooms
Room Capacity Insights for Odessa
- The dominant room capacity in Odessa is 1 bedroom listings, making up 38.6% of the market. This suggests a strong demand for properties suitable for couples or solo travelers.
- Together, 1 bedroom and 2 bedrooms properties represent 63.6% of the active Airbnb listings in Odessa, indicating a high concentration in these sizes.
- A significant 25.0% of listings offer 3+ bedrooms, catering to larger groups and families seeking more space in Odessa.
Odessa Vacation Rental Guest Capacity Trends (2026)
Distribution of Listings by Guest Capacity
Guest Capacity Insights for Odessa
- The most common guest capacity trend in Odessa vacation rentals is listings accommodating 4 guests (25%). This suggests the primary traveler segment is likely small families or groups.
- Properties designed for 4 guests and 8+ guests dominate the Odessa STR market, accounting for 45.5% of listings.
- 36.4% of properties accommodate 6+ guests, serving the market segment for larger families or group travel in Odessa.
- On average, properties in Odessa are equipped to host 4.5 guests.
Odessa Airbnb Booking Patterns (2026): Available vs. Booked Days
Available Days Distribution
Booked Days Distribution
Booking Pattern Insights for Odessa
- The most common availability pattern in Odessa falls within the 271-366 days range, representing 45.5% of listings. This suggests many properties have significant open periods on their calendars.
- Approximately 79.6% of listings show high availability (181+ days open annually), indicating potential for increased bookings or specific owner usage patterns.
- For booked days, the 91-180 days range is most frequent in Odessa (34.1%), reflecting common guest stay durations or potential owner blocking patterns.
- A notable 22.7% of properties secure long booking periods (181+ days booked per year), highlighting successful long-term rental strategies or significant owner usage.
Odessa Airbnb Minimum Stay Requirements Analysis
Distribution of Listings by Minimum Night Requirement
1 Night
10 listings
22.7% of total
2 Nights
18 listings
40.9% of total
3 Nights
2 listings
4.5% of total
4-6 Nights
4 listings
9.1% of total
7-29 Nights
1 listings
2.3% of total
30+ Nights
9 listings
20.5% of total
Key Insights
- The most prevalent minimum stay requirement in Odessa is 2 Nights, adopted by 40.9% of listings. This highlights the market's preference for shorter, flexible bookings.
- A strong majority (63.6%) of the Odessa Airbnb data shows acceptance of very short stays (1-2 nights), indicating a dynamic, high-turnover market.
- A significant segment (20.5%) caters to monthly stays (30+ nights) in Odessa, pointing to opportunities in the extended-stay market.
Recommendations
- Align with the market by considering a 2 Nights minimum stay, as 40.9% of Odessa hosts use this setting.
- If feasible, allowing 1-night stays, especially midweek or during low season, could capture last-minute bookings, as only 22.7% currently do.
- Explore offering discounts for stays of 30+ nights to attract the 20.5% of the market seeking extended stays.
- Adjust minimum nights based on seasonality – potentially shorter during low season and longer during peak demand periods in Odessa.
Odessa Airbnb Cancellation Policy Trends Analysis (2026)
Flexible
16 listings
36.4% of total
Moderate
11 listings
25% of total
Firm
14 listings
31.8% of total
Strict
3 listings
6.8% of total
Cancellation Policy Insights for Odessa
- The prevailing Airbnb cancellation policy trend in Odessa is Flexible, used by 36.4% of listings.
- There's a relatively balanced mix between guest-friendly (61.4%) and stricter (38.6%) policies, offering choices for different guest needs.
- Strict cancellation policies are quite rare (6.8%), potentially making listings with this policy less competitive unless justified by high demand or property type.
Recommendations for Hosts
- Consider adopting a Flexible policy to align with the 36.4% market standard in Odessa.
- Using a Strict policy might deter some guests, as only 6.8% of listings use it. Evaluate if potential revenue protection outweighs possible lower booking rates.
- Regularly review your cancellation policy against competitors and market demand shifts in Odessa.
Odessa STR Booking Lead Time Analysis (2026)
Average Booking Lead Time by Month
Booking Lead Time Insights for Odessa
- The overall average booking lead time for vacation rentals in Odessa is 46 days.
- Guests book furthest in advance for stays during October (average 74 days), likely coinciding with peak travel demand or local events.
- The shortest booking windows occur for stays in September (average 19 days), indicating more last-minute travel plans during this time.
- Seasonally, Winter (54 days avg.) sees the longest lead times, while Summer (28 days avg.) has the shortest, reflecting typical travel planning cycles.
Recommendations for Hosts
- Use the overall average lead time (46 days) as a baseline for your pricing and availability strategy in Odessa.
- For October stays, consider implementing length-of-stay discounts or slightly higher rates for bookings made less than 74 days out to capitalize on advance planning.
- Target marketing efforts for the Winter season well in advance (at least 54 days) to capture early planners.
- Monitor your own booking lead times against these Odessa averages to identify opportunities for dynamic pricing adjustments.
Popular & Essential Airbnb Amenities in Odessa (2026)
Amenity Prevalence
Amenity Insights for Odessa
- Essential amenities in Odessa that guests expect include: Free parking on premises, Dishes and silverware, Wifi, TV, Smoke alarm, Coffee maker, Hot water, Shampoo, Air conditioning, Heating. Lacking these (any) could significantly impact bookings.
Recommendations for Hosts
- Ensure your listing includes all essential amenities for Odessa: Free parking on premises, Dishes and silverware, Wifi, TV, Smoke alarm, Coffee maker, Hot water, Shampoo, Air conditioning, Heating.
- Prioritize adding missing essentials: TV, Smoke alarm, Coffee maker, Hot water, Shampoo, Air conditioning, Heating.
- Highlight unique or less common amenities you offer (e.g., hot tub, dedicated workspace, EV charger) in your listing description and photos.
- Regularly check competitor amenities in Odessa to stay competitive.
Odessa Airbnb Guest Demographics & Profile Analysis (2026)
Guest Profile Summary for Odessa
- The typical guest profile for Airbnb in Odessa consists of primarily domestic travelers (94%), often arriving from nearby Tampa, typically belonging to the Post-2000s (Gen Z/Alpha) group (50%), primarily speaking English or Spanish.
- Domestic travelers account for 93.9% of guests.
- Key international markets include United States (93.9%) and Canada (3.1%).
- Top languages spoken are English (77.1%) followed by Spanish (14.4%).
- A significant demographic segment is the Post-2000s (Gen Z/Alpha) group, representing 50% of guests.
Recommendations for Hosts
- Target domestic marketing efforts towards travelers from Tampa and Orlando.
- Tailor amenities and listing descriptions to appeal to the dominant Post-2000s (Gen Z/Alpha) demographic (e.g., highlight fast WiFi, smart home features, local guides).
- Highlight unique local experiences or amenities relevant to the primary guest profile.
- Consider seasonal promotions aligned with peak travel times for key origin markets.
Nearby Short-Term Rental Market Comparison
How does the Odessa Airbnb market stack up against its neighbors? Compare key performance metrics like average monthly revenue, ADR, and occupancy rates in surrounding areas to understand the broader regional STR landscape.
| Market | Active Properties | Monthly Revenue | Daily Rate | Avg. Occupancy |
|---|---|---|---|---|
| Anna Maria island | 587 | $7,996 | $823.96 | 41% |
| Anna Maria | 56 | $6,434 | $692.96 | 52% |
| Reunion | 12 | $6,321 | $580.45 | 44% |
| Vilano Beach | 173 | $5,571 | $442.95 | 45% |
| Indian Rocks Beach | 842 | $5,560 | $419.63 | 49% |
| Siesta Key | 1,175 | $5,206 | $518.91 | 42% |
| Belleair Beach | 94 | $5,086 | $339.65 | 53% |
| Bradenton Beach | 122 | $4,977 | $507.12 | 42% |
| Thonotosassa | 17 | $4,309 | $347.75 | 50% |
| Seminole | 519 | $4,223 | $316.69 | 52% |