North Port Airbnb Market Analysis 2026: Short Term Rental Data & Vacation Rental Statistics in Florida, United States
Is Airbnb profitable in North Port in 2026? Explore comprehensive Airbnb analytics for North Port, Florida, United States to uncover income potential. This 2026 STR market report for North Port, based on AirROI data from February 2025 to January 2026, reveals key trends in the market of 424 active listings.
Whether you're considering an Airbnb investment in North Port, optimizing your existing vacation rental, or exploring rental arbitrage opportunities, understanding the North Port Airbnb data is crucial. Leveraging the low regulation environment is key to maximizing your short term rental income potential. Let's dive into the specifics.
Key North Port Airbnb Performance Metrics Overview
Monthly Airbnb Revenue Variations & Income Potential in North Port (2026)
Understanding the monthly revenue variations for Airbnb listings in North Port is key to maximizing your short term rental income potential. Seasonality significantly impacts earnings. Our analysis, based on data from the past 12 months, shows that the peak revenue month for STRs in North Port is typically March, while September often presents the lowest earnings, highlighting opportunities for strategic pricing adjustments during shoulder and low seasons. Explore the typical Airbnb income in North Port across different performance tiers:
- Best-in-class properties (Top 10%) achieve $4,940+ monthly, often utilizing dynamic pricing and superior guest experiences.
- Strong performing properties (Top 25%) earn $3,393 or more, indicating effective management and desirable locations/amenities.
- Typical properties (Median) generate around $1,938 per month, representing the average market performance.
- Entry-level properties (Bottom 25%) see earnings around $969, often with potential for optimization.
Average Monthly Airbnb Earnings Trend in North Port
North Port Airbnb Occupancy Rate Trends (2026)
Maximize your bookings by understanding the North Port STR occupancy trends. Seasonal demand shifts significantly influence how often properties are booked. Typically, Marchsees the highest demand (peak season occupancy), while September experiences the lowest (low season). Effective strategies, like adjusting minimum stays or offering promotions, can boost occupancy during slower periods. Here's how different property tiers perform in North Port:
- Best-in-class properties (Top 10%) achieve 81%+ occupancy, indicating high desirability and potentially optimized availability.
- Strong performing properties (Top 25%) maintain 63% or higher occupancy, suggesting good market fit and guest satisfaction.
- Typical properties (Median) have an occupancy rate around 42%.
- Entry-level properties (Bottom 25%) average 24% occupancy, potentially facing higher vacancy.
Average Monthly Occupancy Rate Trend in North Port
Average Daily Rate (ADR) Airbnb Trends in North Port (2026)
Effective short term rental pricing strategy in North Port involves understanding monthly ADR fluctuations. The Average Daily Rate (ADR) for Airbnb in North Port typically peaks in January and dips lowest during April. Leveraging Airbnb dynamic pricing tools or strategies based on this seasonality can significantly boost revenue. Here's a look at the typical nightly rates achieved:
- Best-in-class properties (Top 10%) command rates of $259+ per night, often due to premium features or locations.
- Strong performing properties (Top 25%) achieve nightly rates of $210 or more.
- Typical properties (Median) charge around $160 per night.
- Entry-level properties (Bottom 25%) earn around $106 per night.
Average Daily Rate (ADR) Trend by Month in North Port
Get Live North Port Market Intelligence 👇

Explore Real-time Analytics
Airbnb Seasonality Analysis & Trends in North Port (2026)
Peak Season (March, February, April)
- Revenue averages $3,315 per month
- Occupancy rates average 63.5%
- Daily rates average $154
Shoulder Season
- Revenue averages $2,172 per month
- Occupancy maintains around 37.5%
- Daily rates hold near $174
Low Season (May, August, September)
- Revenue drops to average $1,895 per month
- Occupancy decreases to average 37.3%
- Daily rates adjust to average $159
Seasonality Insights for North Port
- The Airbnb seasonality in North Port shows highly seasonal trends requiring careful strategy. While the sections above show seasonal averages, it's also insightful to look at the extremes:
- During the high season, the absolute peak month showcases North Port's highest earning potential, with monthly revenues capable of climbing to $3,911, occupancy reaching a high of 70.7%, and ADRs peaking at $187.
- Conversely, the slowest single month of the year, typically falling within the low season, marks the market's lowest point. In this month, revenue might dip to $1,702, occupancy could drop to 33.3%, and ADRs may adjust down to $149.
- Understanding both the seasonal averages and these monthly peaks and troughs in revenue, occupancy, and ADR is crucial for maximizing your Airbnb profit potential in North Port.
Seasonal Strategies for Maximizing Profit
- Peak Season: Maximize revenue through premium pricing and potentially longer minimum stays. Ensure high availability.
- Low Season: Offer competitive pricing, special promotions (e.g., extended stay discounts), and flexible cancellation policies. Target off-season travelers like remote workers or budget-conscious guests.
- Shoulder Seasons: Implement dynamic pricing that balances peak and low rates. Target weekend travelers or specific events. Offer slightly more flexible terms than peak season.
- Regularly analyze your own performance against these North Port seasonality benchmarks and adjust your pricing and availability strategy accordingly.
Best Areas for Airbnb Investment in North Port (2026)
Exploring the top neighborhoods for short-term rentals in North Port? This section highlights key areas, outlining why they are attractive for hosts and guests, along with notable local attractions. Consider these locations based on your target guest profile and investment strategy.
| Neighborhood / Area | Why Host Here? (Target Guests & Appeal) | Key Attractions & Landmarks |
|---|---|---|
| Coconut Point | A shopping and dining destination with popular attractions, perfect for tourists looking to enjoy upscale retail and local cuisine. | Coconut Point Mall, Germain Arena, The Promenade at Coconut Point, Coconut Point Park, The Liquid Beach |
| Englewood Beach | A beautiful seaside community known for its stunning beaches, making it a favorite for families and beach lovers. | Englewood Beach, Blind Pass Beach, Stump Pass Beach State Park, Manasota Key, Englewood Farmers Market |
| Port Charlotte Town Center | A retail hub with plenty of shopping options, ideal for tourists needing amenities and entertainment nearby. | Port Charlotte Town Center, Cultural Center of Charlotte County, Sunset Beach, Charlotte Harbor, Military Heritage Museum |
| Myakka River State Park | An expansive natural park offering incredible outdoor activities, great for eco-tourists and those who enjoy nature. | Myakka River State Park, Wildlife Viewing, Kayaking, Biking Trails, Campground |
| Punta Gorda Historic District | Charming historic area with waterfront views, attracting visitors interested in history and scenic views. | Punta Gorda Waterfront, Fishermen's Village, Punta Gorda History Park, Gilchrist Park, Ponce de Leon Park |
| Manasota Key | A laid-back barrier island with pristine beaches, ideal for those looking to relax and unwind by the Gulf. | Manasota Key Beach, Turtle Beach, Englewood Beach, Lemon Bay, Stump Pass Beach State Park |
| Charlotte Harbor | A vast harbor area with various recreation options, appealing to nature lovers and water sports enthusiasts. | Charlotte Harbor Preserve State Park, Paddleboarding, Fishing, Birdwatching, Harbor Walk |
| North Port | A growing city with a family-friendly atmosphere, offering parks and recreational areas for a variety of travelers. | Warm Mineral Springs, Heron Creek Golf Course, Cranberry Farms, North Port Aquatic Center, Nokomis Groves |
Understanding Airbnb License Requirements & STR Laws in North Port (2026)
While North Port, Florida, United States currently shows low STR regulations, specific Airbnb license requirements might still exist or change. Always verify the latest short term rental regulations and Airbnb license requirements directly with local government authorities for North Port to ensure full compliance before hosting.
(Source: AirROI data, 2026, based on 1% licensed listings)
Top Performing Airbnb Properties in North Port (2026)
Benchmark your potential! Explore examples of top-performing Airbnb properties in North Portbased on Trailing Twelve Month (TTM) revenue. Analyze their characteristics, revenue, occupancy rate, and ADR to understand what drives success in this market.
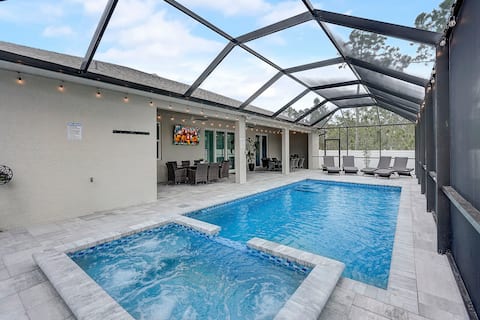
Luxe Gem Heated Saltwater Pool/Spa & Privacy Fence
Entire Place • 3 bedrooms

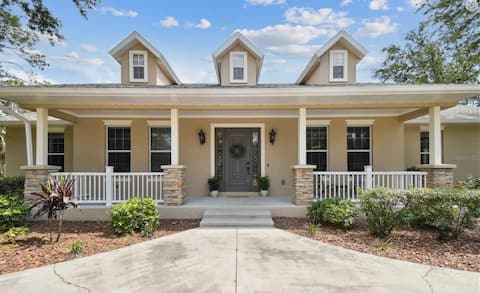
Stylish New Build with Pool, Spa, and Design
Entire Place • 4 bedrooms

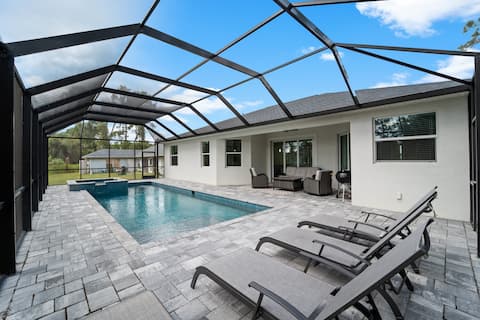
Gone Coastal! Heated Pool Home 30 Min From Beaches
Entire Place • 4 bedrooms
Doblins Oasis - Privacy in the heart of the city!
Entire Place • 5 bedrooms

Family Paradise | Spacious 5BR w/ Heated Pool
Entire Place • 5 bedrooms
Modern Heated Pool Home Close To Downtown Shopping
Entire Place • 3 bedrooms
Note: Performance varies based on location, size, amenities, seasonality, and management quality. Data reflects the past 12 months.
Top Performing Airbnb Hosts in North Port (2026)
Learn from the best! This table showcases top-performing Airbnb hosts in North Port based on the number of properties managed and estimated total revenue over the past year. Analyze their scale and performance metrics.
| Host Name | Properties | Grossing Revenue | Stay Reviews | Avg Rating |
|---|---|---|---|---|
| Marina | 21 | $211,553 | 279 | 4.57/5.0 |
| Evolve | 12 | $153,816 | 55 | 4.70/5.0 |
| Luxury Host | 4 | $141,097 | 54 | 4.62/5.0 |
| Chris W/ GuestGeeks | 2 | $112,456 | 65 | 4.88/5.0 |
| Andrii | 2 | $96,435 | 42 | 4.96/5.0 |
| Vera | 2 | $93,716 | 266 | 4.95/5.0 |
| Yekaterina | 4 | $89,553 | 305 | 4.91/5.0 |
| Boris | 5 | $84,080 | 311 | 4.69/5.0 |
| Vasiliy | 2 | $83,404 | 67 | 4.99/5.0 |
| Yelena | 1 | $81,607 | 59 | 4.97/5.0 |
Analyzing the strategies of top hosts, such as their property selection, pricing, and guest communication, can offer valuable lessons for optimizing your own Airbnb operations in North Port.
Dive Deeper: Advanced North Port STR Market Data (2026)
Ready to unlock more insights? AirROI provides access to advanced metrics and comprehensive Airbnb data for North Port. Explore detailed analytics beyond this report to refine your investment strategy, optimize pricing, and maximize your vacation rental profits.
Explore Advanced MetricsNorth Port Short-Term Rental Market Composition (2026): Property & Room Types
Room Type Distribution
Property Type Distribution
Market Composition Insights for North Port
- The North Port Airbnb market composition is heavily skewed towards Entire Home/Apt listings, which make up 89.2% of the 424 active rentals. This indicates strong guest preference for privacy and space.
- Looking at the property type distribution in North Port, House properties are the most common (89.4%), reflecting the local real estate landscape.
- Houses represent a significant 89.4% portion, catering likely to families or larger groups.
- Smaller segments like apartment/condo, others, outdoor/unique, hotel/boutique (combined 10.6%) offer potential for unique stay experiences.
North Port Airbnb Room Capacity Analysis (2026): Bedroom Distribution
Distribution of Listings by Number of Bedrooms
Room Capacity Insights for North Port
- The dominant room capacity in North Port is 3 bedrooms listings, making up 50.2% of the market. This suggests a strong demand for properties suitable for families or small groups.
- Together, 3 bedrooms and 2 bedrooms properties represent 66.7% of the active Airbnb listings in North Port, indicating a high concentration in these sizes.
- A significant 63.2% of listings offer 3+ bedrooms, catering to larger groups and families seeking more space in North Port.
North Port Vacation Rental Guest Capacity Trends (2026)
Distribution of Listings by Guest Capacity
Guest Capacity Insights for North Port
- The most common guest capacity trend in North Port vacation rentals is listings accommodating 8+ guests (31.1%). This suggests the primary traveler segment is likely larger groups.
- Properties designed for 8+ guests and 6 guests dominate the North Port STR market, accounting for 57.5% of listings.
- 66.2% of properties accommodate 6+ guests, serving the market segment for larger families or group travel in North Port.
- On average, properties in North Port are equipped to host 5.5 guests.
North Port Airbnb Booking Patterns (2026): Available vs. Booked Days
Available Days Distribution
Booked Days Distribution
Booking Pattern Insights for North Port
- The most common availability pattern in North Port falls within the 271-366 days range, representing 49.5% of listings. This suggests many properties have significant open periods on their calendars.
- Approximately 82.3% of listings show high availability (181+ days open annually), indicating potential for increased bookings or specific owner usage patterns.
- For booked days, the 91-180 days range is most frequent in North Port (32.8%), reflecting common guest stay durations or potential owner blocking patterns.
- A notable 19.1% of properties secure long booking periods (181+ days booked per year), highlighting successful long-term rental strategies or significant owner usage.
North Port Airbnb Minimum Stay Requirements Analysis
Distribution of Listings by Minimum Night Requirement
1 Night
73 listings
17.2% of total
2 Nights
103 listings
24.3% of total
3 Nights
51 listings
12% of total
4-6 Nights
40 listings
9.4% of total
7-29 Nights
38 listings
9% of total
30+ Nights
119 listings
28.1% of total
Key Insights
- The most prevalent minimum stay requirement in North Port is 30+ Nights, adopted by 28.1% of listings. This highlights the market's preference for longer commitments.
- A significant segment (28.1%) caters to monthly stays (30+ nights) in North Port, pointing to opportunities in the extended-stay market.
Recommendations
- Align with the market by considering a 30+ Nights minimum stay, as 28.1% of North Port hosts use this setting.
- If feasible, allowing 1-night stays, especially midweek or during low season, could capture last-minute bookings, as only 17.2% currently do.
- Explore offering discounts for stays of 30+ nights to attract the 28.1% of the market seeking extended stays.
- Adjust minimum nights based on seasonality – potentially shorter during low season and longer during peak demand periods in North Port.
North Port Airbnb Cancellation Policy Trends Analysis (2026)
Super Strict 60 Days
3 listings
0.7% of total
Limited
8 listings
1.9% of total
Super Strict 30 Days
1 listings
0.2% of total
Flexible
92 listings
21.8% of total
Moderate
90 listings
21.3% of total
Firm
168 listings
39.8% of total
Strict
60 listings
14.2% of total
Cancellation Policy Insights for North Port
- The prevailing Airbnb cancellation policy trend in North Port is Firm, used by 39.8% of listings.
- A majority (54.0%) of hosts in North Port utilize Firm or Strict policies, indicating a market where hosts prioritize booking security.
Recommendations for Hosts
- Consider adopting a Firm policy to align with the 39.8% market standard in North Port.
- Using a Strict policy might deter some guests, as only 14.2% of listings use it. Evaluate if potential revenue protection outweighs possible lower booking rates.
- Regularly review your cancellation policy against competitors and market demand shifts in North Port.
North Port STR Booking Lead Time Analysis (2026)
Average Booking Lead Time by Month
Booking Lead Time Insights for North Port
- The overall average booking lead time for vacation rentals in North Port is 47 days.
- Guests book furthest in advance for stays during February (average 83 days), likely coinciding with peak travel demand or local events.
- The shortest booking windows occur for stays in September (average 21 days), indicating more last-minute travel plans during this time.
- Seasonally, Winter (65 days avg.) sees the longest lead times, while Summer (29 days avg.) has the shortest, reflecting typical travel planning cycles.
Recommendations for Hosts
- Use the overall average lead time (47 days) as a baseline for your pricing and availability strategy in North Port.
- For February stays, consider implementing length-of-stay discounts or slightly higher rates for bookings made less than 83 days out to capitalize on advance planning.
- Target marketing efforts for the Winter season well in advance (at least 65 days) to capture early planners.
- Monitor your own booking lead times against these North Port averages to identify opportunities for dynamic pricing adjustments.
Popular & Essential Airbnb Amenities in North Port (2026)
Amenity Prevalence
Amenity Insights for North Port
- Essential amenities in North Port that guests expect include: Wifi, Air conditioning, Free parking on premises, Smoke alarm, TV, Kitchen. Lacking these (any) could significantly impact bookings.
- Popular amenities like Washer, Heating, Hot water are common but not universal. Offering these can provide a competitive edge.
Recommendations for Hosts
- Ensure your listing includes all essential amenities for North Port: Wifi, Air conditioning, Free parking on premises, Smoke alarm, TV, Kitchen.
- Prioritize adding missing essentials: Wifi, Air conditioning, Free parking on premises, Smoke alarm, TV, Kitchen.
- Consider adding popular differentiators like Washer or Heating to increase appeal.
- Highlight unique or less common amenities you offer (e.g., hot tub, dedicated workspace, EV charger) in your listing description and photos.
- Regularly check competitor amenities in North Port to stay competitive.
North Port Airbnb Guest Demographics & Profile Analysis (2026)
Guest Profile Summary for North Port
- The typical guest profile for Airbnb in North Port consists of primarily domestic travelers (95%), often arriving from nearby Miami, typically belonging to the Post-2000s (Gen Z/Alpha) group (50%), primarily speaking English or Spanish.
- Domestic travelers account for 94.5% of guests.
- Key international markets include United States (94.5%) and Canada (2%).
- Top languages spoken are English (68.5%) followed by Spanish (17.7%).
- A significant demographic segment is the Post-2000s (Gen Z/Alpha) group, representing 50% of guests.
Recommendations for Hosts
- Target domestic marketing efforts towards travelers from Miami and Orlando.
- Tailor amenities and listing descriptions to appeal to the dominant Post-2000s (Gen Z/Alpha) demographic (e.g., highlight fast WiFi, smart home features, local guides).
- Highlight unique local experiences or amenities relevant to the primary guest profile.
- Consider seasonal promotions aligned with peak travel times for key origin markets.
Nearby Short-Term Rental Market Comparison
How does the North Port Airbnb market stack up against its neighbors? Compare key performance metrics like average monthly revenue, ADR, and occupancy rates in surrounding areas to understand the broader regional STR landscape.
| Market | Active Properties | Monthly Revenue | Daily Rate | Avg. Occupancy |
|---|---|---|---|---|
| Anna Maria island | 587 | $7,996 | $823.96 | 41% |
| Anna Maria | 56 | $6,434 | $692.96 | 52% |
| Reunion | 12 | $6,321 | $580.45 | 44% |
| Boca Grande | 31 | $6,128 | $787.07 | 37% |
| Indian Rocks Beach | 842 | $5,560 | $419.63 | 49% |
| Captiva | 291 | $5,443 | $667.40 | 36% |
| Siesta Key | 1,175 | $5,206 | $518.91 | 42% |
| Belleair Beach | 94 | $5,086 | $339.65 | 53% |
| Bradenton Beach | 122 | $4,977 | $507.12 | 42% |
| Thonotosassa | 17 | $4,309 | $347.75 | 50% |