North Lauderdale Airbnb Market Analysis 2026: Short Term Rental Data & Vacation Rental Statistics in Florida, United States
Is Airbnb profitable in North Lauderdale in 2026? Explore comprehensive Airbnb analytics for North Lauderdale, Florida, United States to uncover income potential. This 2026 STR market report for North Lauderdale, based on AirROI data from February 2025 to January 2026, reveals key trends in the niche market of 48 active listings.
Whether you're considering an Airbnb investment in North Lauderdale, optimizing your existing vacation rental, or exploring rental arbitrage opportunities, understanding the North Lauderdale Airbnb data is crucial. Leveraging the low regulation environment is key to maximizing your short term rental income potential. Let's dive into the specifics.
Key North Lauderdale Airbnb Performance Metrics Overview
Monthly Airbnb Revenue Variations & Income Potential in North Lauderdale (2026)
Understanding the monthly revenue variations for Airbnb listings in North Lauderdale is key to maximizing your short term rental income potential. Seasonality significantly impacts earnings. Our analysis, based on data from the past 12 months, shows that the peak revenue month for STRs in North Lauderdale is typically March, while August often presents the lowest earnings, highlighting opportunities for strategic pricing adjustments during shoulder and low seasons. Explore the typical Airbnb income in North Lauderdale across different performance tiers:
- Best-in-class properties (Top 10%) achieve $3,946+ monthly, often utilizing dynamic pricing and superior guest experiences.
- Strong performing properties (Top 25%) earn $2,607 or more, indicating effective management and desirable locations/amenities.
- Typical properties (Median) generate around $1,562 per month, representing the average market performance.
- Entry-level properties (Bottom 25%) see earnings around $569, often with potential for optimization.
Average Monthly Airbnb Earnings Trend in North Lauderdale
North Lauderdale Airbnb Occupancy Rate Trends (2026)
Maximize your bookings by understanding the North Lauderdale STR occupancy trends. Seasonal demand shifts significantly influence how often properties are booked. Typically, Februarysees the highest demand (peak season occupancy), while July experiences the lowest (low season). Effective strategies, like adjusting minimum stays or offering promotions, can boost occupancy during slower periods. Here's how different property tiers perform in North Lauderdale:
- Best-in-class properties (Top 10%) achieve 87%+ occupancy, indicating high desirability and potentially optimized availability.
- Strong performing properties (Top 25%) maintain 70% or higher occupancy, suggesting good market fit and guest satisfaction.
- Typical properties (Median) have an occupancy rate around 39%.
- Entry-level properties (Bottom 25%) average 17% occupancy, potentially facing higher vacancy.
Average Monthly Occupancy Rate Trend in North Lauderdale
Average Daily Rate (ADR) Airbnb Trends in North Lauderdale (2026)
Effective short term rental pricing strategy in North Lauderdale involves understanding monthly ADR fluctuations. The Average Daily Rate (ADR) for Airbnb in North Lauderdale typically peaks in December and dips lowest during April. Leveraging Airbnb dynamic pricing tools or strategies based on this seasonality can significantly boost revenue. Here's a look at the typical nightly rates achieved:
- Best-in-class properties (Top 10%) command rates of $230+ per night, often due to premium features or locations.
- Strong performing properties (Top 25%) achieve nightly rates of $169 or more.
- Typical properties (Median) charge around $109 per night.
- Entry-level properties (Bottom 25%) earn around $66 per night.
Average Daily Rate (ADR) Trend by Month in North Lauderdale
Get Live North Lauderdale Market Intelligence 👇

Explore Real-time Analytics
Airbnb Seasonality Analysis & Trends in North Lauderdale (2026)
Peak Season (March, February, December)
- Revenue averages $2,441 per month
- Occupancy rates average 55.0%
- Daily rates average $129
Shoulder Season
- Revenue averages $1,756 per month
- Occupancy maintains around 42.0%
- Daily rates hold near $126
Low Season (August, September, November)
- Revenue drops to average $1,506 per month
- Occupancy decreases to average 38.6%
- Daily rates adjust to average $126
Seasonality Insights for North Lauderdale
- The Airbnb seasonality in North Lauderdale shows moderate seasonality with distinct peak and low periods. While the sections above show seasonal averages, it's also insightful to look at the extremes:
- During the high season, the absolute peak month showcases North Lauderdale's highest earning potential, with monthly revenues capable of climbing to $2,557, occupancy reaching a high of 59.0%, and ADRs peaking at $138.
- Conversely, the slowest single month of the year, typically falling within the low season, marks the market's lowest point. In this month, revenue might dip to $1,454, occupancy could drop to 38.0%, and ADRs may adjust down to $118.
- Understanding both the seasonal averages and these monthly peaks and troughs in revenue, occupancy, and ADR is crucial for maximizing your Airbnb profit potential in North Lauderdale.
Seasonal Strategies for Maximizing Profit
- Peak Season: Maximize revenue through premium pricing and potentially longer minimum stays. Ensure high availability.
- Low Season: Offer competitive pricing, special promotions (e.g., extended stay discounts), and flexible cancellation policies. Target off-season travelers like remote workers or budget-conscious guests.
- Shoulder Seasons: Implement dynamic pricing that balances peak and low rates. Target weekend travelers or specific events. Offer slightly more flexible terms than peak season.
- Regularly analyze your own performance against these North Lauderdale seasonality benchmarks and adjust your pricing and availability strategy accordingly.
Best Areas for Airbnb Investment in North Lauderdale (2026)
Exploring the top neighborhoods for short-term rentals in North Lauderdale? This section highlights key areas, outlining why they are attractive for hosts and guests, along with notable local attractions. Consider these locations based on your target guest profile and investment strategy.
| Neighborhood / Area | Why Host Here? (Target Guests & Appeal) | Key Attractions & Landmarks |
|---|---|---|
| Lauderdale Lakes | A diverse and growing community with affordable housing options and proximity to shopping and dining. Ideal for families and long-term stays. | Lauderdale Lakes Mall, Cypress Park, Central Broward Regional Park, Lauderdale Lakes Library |
| Pine Island Ridge | A gated community known for its tranquil environment, golf courses, and proximity to major highways. Great for guests looking for a peaceful retreat close to the city. | Pine Island Ridge Country Club, Pine Island Park, golf courses, local restaurants |
| Oakland Park | A vibrant city with a mix of modern and historic developments. Close to the beach and offers a lively dining scene, making it attractive to tourists. | Oakland Park Farmers Market, Esplanade, Colohatchee Park, local breweries and eateries |
| Fort Lauderdale Beach | Famous for its stunning beaches and nightlife. A prime vacation destination that attracts tourists year-round with various water activities. | Fort Lauderdale Beach, Las Olas Boulevard, Water Taxi, Bonnet House Museum & Gardens |
| Wilton Manors | Known for its welcoming vibe and vibrant nightlife. Attracts a diverse crowd and is close to Fort Lauderdale's beaches and attractions. | Wilton Drive, local bars and restaurants, Richardson Historic Park, Nature Center |
| Downtown Fort Lauderdale | The urban center of Broward County, featuring office buildings, condos, and a vibrant nightlife scene. Popular with young professionals and tourists. | Las Olas Riverfront, Broward Center for the Performing Arts, Riverwalk Park, local shopping and dining options |
| Lauderdale by the Sea | A charming beach town with a small-town feel, great diving opportunities, and beautiful beaches. Perfect for guests seeking a relaxed beach vacation. | Lauderdale by the Sea Beach, Anglin's Fishing Pier, local shops and cafes, Diving sites |
| Coral Ridge | A residential area known for its beautiful homes and proximity to the beach. A popular area for families and those looking for luxury accommodations. | Coral Ridge Country Club, local parks, Shoppes of Coral Ridge, beach access |
Understanding Airbnb License Requirements & STR Laws in North Lauderdale (2026)
While North Lauderdale, Florida, United States currently shows low STR regulations, specific Airbnb license requirements might still exist or change. Always verify the latest short term rental regulations and Airbnb license requirements directly with local government authorities for North Lauderdale to ensure full compliance before hosting.
(Source: AirROI data, 2026, finding no licensed listings among those analyzed)
Top Performing Airbnb Properties in North Lauderdale (2026)
Benchmark your potential! Explore examples of top-performing Airbnb properties in North Lauderdalebased on Trailing Twelve Month (TTM) revenue. Analyze their characteristics, revenue, occupancy rate, and ADR to understand what drives success in this market.
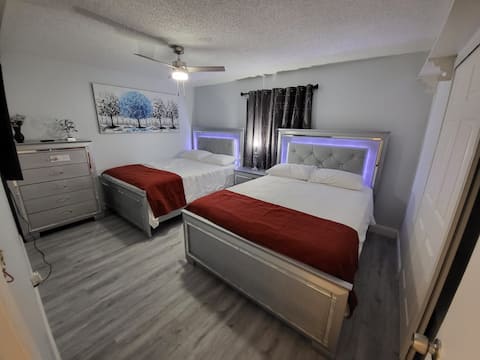
3 Bedroom House with King Bed
Entire Place • 3 bedrooms
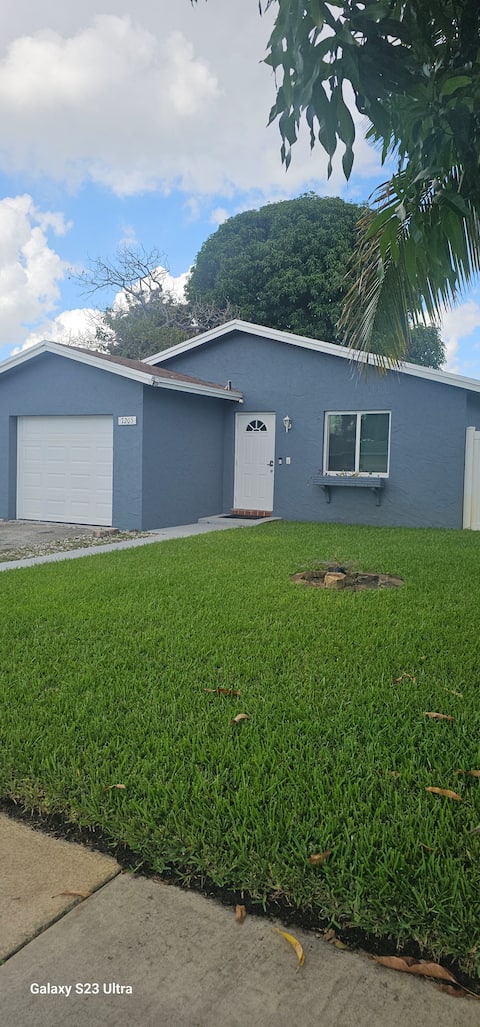
Dal's Delight
Entire Place • 3 bedrooms
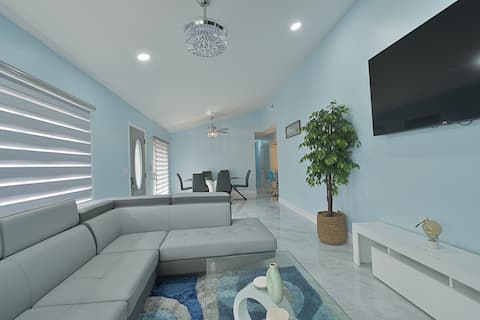
Modern Florida Retreat Close to Beaches
Entire Place • 2 bedrooms
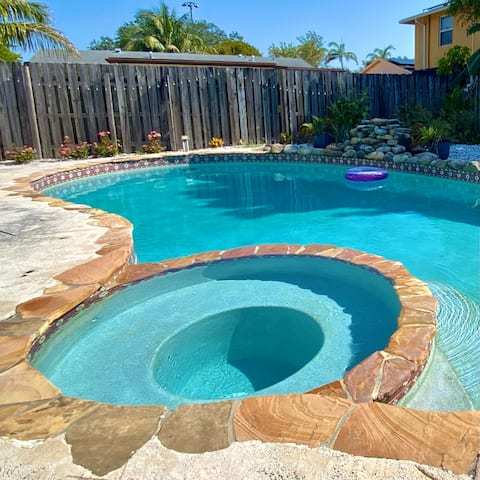
North Lauderdale pool home
Entire Place • 2 bedrooms
Spacious 3BR Family-Friendly Home Near Attractions
Entire Place • 3 bedrooms

Comfortable & Affordable, Close to Everything!
Entire Place • 2 bedrooms
Note: Performance varies based on location, size, amenities, seasonality, and management quality. Data reflects the past 12 months.
Top Performing Airbnb Hosts in North Lauderdale (2026)
Learn from the best! This table showcases top-performing Airbnb hosts in North Lauderdale based on the number of properties managed and estimated total revenue over the past year. Analyze their scale and performance metrics.
| Host Name | Properties | Grossing Revenue | Stay Reviews | Avg Rating |
|---|---|---|---|---|
| Flex Housing | 2 | $57,924 | 49 | 4.72/5.0 |
| Vacation In Luxury | 2 | $54,957 | 65 | 4.55/5.0 |
| Millicent | 1 | $44,301 | 26 | 4.85/5.0 |
| Darrell | 1 | $39,515 | 33 | 4.58/5.0 |
| Jason | 1 | $34,280 | 41 | 4.78/5.0 |
| Mike | 1 | $33,237 | 25 | 4.40/5.0 |
| Jodyann | 2 | $33,200 | 33 | 4.89/5.0 |
| Pedro | 1 | $33,120 | 50 | 4.66/5.0 |
| Yanique | 1 | $30,613 | 12 | 5.00/5.0 |
| Marina | 1 | $27,767 | 71 | 4.89/5.0 |
Analyzing the strategies of top hosts, such as their property selection, pricing, and guest communication, can offer valuable lessons for optimizing your own Airbnb operations in North Lauderdale.
Dive Deeper: Advanced North Lauderdale STR Market Data (2026)
Ready to unlock more insights? AirROI provides access to advanced metrics and comprehensive Airbnb data for North Lauderdale. Explore detailed analytics beyond this report to refine your investment strategy, optimize pricing, and maximize your vacation rental profits.
Explore Advanced MetricsNorth Lauderdale Short-Term Rental Market Composition (2026): Property & Room Types
Room Type Distribution
Property Type Distribution
Market Composition Insights for North Lauderdale
- The North Lauderdale Airbnb market composition is heavily skewed towards Entire Home/Apt listings, which make up 60.4% of the 48 active rentals. This indicates strong guest preference for privacy and space.
- However, a notable 39.6% share for Private Rooms suggests opportunities for budget-conscious travelers or hosts renting out spare rooms.
- Looking at the property type distribution in North Lauderdale, House properties are the most common (75%), reflecting the local real estate landscape.
- Houses represent a significant 75% portion, catering likely to families or larger groups.
- Smaller segments like hotel/boutique (combined 4.2%) offer potential for unique stay experiences.
North Lauderdale Airbnb Room Capacity Analysis (2026): Bedroom Distribution
Distribution of Listings by Number of Bedrooms
Room Capacity Insights for North Lauderdale
- The dominant room capacity in North Lauderdale is 1 bedroom listings, making up 25% of the market. This suggests a strong demand for properties suitable for couples or solo travelers.
- Together, 1 bedroom and 2 bedrooms properties represent 47.9% of the active Airbnb listings in North Lauderdale, indicating a high concentration in these sizes.
- A significant 20.8% of listings offer 3+ bedrooms, catering to larger groups and families seeking more space in North Lauderdale.
North Lauderdale Vacation Rental Guest Capacity Trends (2026)
Distribution of Listings by Guest Capacity
Guest Capacity Insights for North Lauderdale
- The most common guest capacity trend in North Lauderdale vacation rentals is listings accommodating 4 guests (18.8%). This suggests the primary traveler segment is likely small families or groups.
- Properties designed for 4 guests and 2 guests dominate the North Lauderdale STR market, accounting for 35.5% of listings.
- 20.8% of properties accommodate 6+ guests, serving the market segment for larger families or group travel in North Lauderdale.
- On average, properties in North Lauderdale are equipped to host 3.0 guests.
North Lauderdale Airbnb Booking Patterns (2026): Available vs. Booked Days
Available Days Distribution
Booked Days Distribution
Booking Pattern Insights for North Lauderdale
- The most common availability pattern in North Lauderdale falls within the 271-366 days range, representing 60.4% of listings. This suggests many properties have significant open periods on their calendars.
- Approximately 81.2% of listings show high availability (181+ days open annually), indicating potential for increased bookings or specific owner usage patterns.
- For booked days, the 31-90 days range is most frequent in North Lauderdale (33.3%), reflecting common guest stay durations or potential owner blocking patterns.
- A notable 18.7% of properties secure long booking periods (181+ days booked per year), highlighting successful long-term rental strategies or significant owner usage.
North Lauderdale Airbnb Minimum Stay Requirements Analysis
Distribution of Listings by Minimum Night Requirement
1 Night
13 listings
27.1% of total
2 Nights
5 listings
10.4% of total
3 Nights
5 listings
10.4% of total
4-6 Nights
4 listings
8.3% of total
7-29 Nights
1 listings
2.1% of total
30+ Nights
20 listings
41.7% of total
Key Insights
- The most prevalent minimum stay requirement in North Lauderdale is 30+ Nights, adopted by 41.7% of listings. This highlights the market's preference for longer commitments.
- A significant segment (41.7%) caters to monthly stays (30+ nights) in North Lauderdale, pointing to opportunities in the extended-stay market.
Recommendations
- Align with the market by considering a 30+ Nights minimum stay, as 41.7% of North Lauderdale hosts use this setting.
- If feasible, allowing 1-night stays, especially midweek or during low season, could capture last-minute bookings, as only 27.1% currently do.
- Explore offering discounts for stays of 30+ nights to attract the 41.7% of the market seeking extended stays.
- Adjust minimum nights based on seasonality – potentially shorter during low season and longer during peak demand periods in North Lauderdale.
North Lauderdale Airbnb Cancellation Policy Trends Analysis (2026)
Limited
1 listings
2.1% of total
Flexible
18 listings
37.5% of total
Moderate
11 listings
22.9% of total
Firm
8 listings
16.7% of total
Strict
10 listings
20.8% of total
Cancellation Policy Insights for North Lauderdale
- The prevailing Airbnb cancellation policy trend in North Lauderdale is Flexible, used by 37.5% of listings.
- There's a relatively balanced mix between guest-friendly (60.4%) and stricter (37.5%) policies, offering choices for different guest needs.
Recommendations for Hosts
- Consider adopting a Flexible policy to align with the 37.5% market standard in North Lauderdale.
- Regularly review your cancellation policy against competitors and market demand shifts in North Lauderdale.
North Lauderdale STR Booking Lead Time Analysis (2026)
Average Booking Lead Time by Month
Booking Lead Time Insights for North Lauderdale
- The overall average booking lead time for vacation rentals in North Lauderdale is 22 days.
- Guests book furthest in advance for stays during December (average 44 days), likely coinciding with peak travel demand or local events.
- The shortest booking windows occur for stays in September (average 8 days), indicating more last-minute travel plans during this time.
- Seasonally, Winter (34 days avg.) sees the longest lead times, while Fall (15 days avg.) has the shortest, reflecting typical travel planning cycles.
Recommendations for Hosts
- Use the overall average lead time (22 days) as a baseline for your pricing and availability strategy in North Lauderdale.
- For December stays, consider implementing length-of-stay discounts or slightly higher rates for bookings made less than 44 days out to capitalize on advance planning.
- During September, focus on last-minute booking availability and promotions, as guests book with very short notice (8 days avg.).
- Target marketing efforts for the Winter season well in advance (at least 34 days) to capture early planners.
- Monitor your own booking lead times against these North Lauderdale averages to identify opportunities for dynamic pricing adjustments.
Popular & Essential Airbnb Amenities in North Lauderdale (2026)
Amenity Prevalence
Amenity Insights for North Lauderdale
- Essential amenities in North Lauderdale that guests expect include: Wifi, Air conditioning, Free parking on premises, TV. Lacking these (any) could significantly impact bookings.
- Popular amenities like Smoke alarm, Hot water, Iron are common but not universal. Offering these can provide a competitive edge.
Recommendations for Hosts
- Ensure your listing includes all essential amenities for North Lauderdale: Wifi, Air conditioning, Free parking on premises, TV.
- Consider adding popular differentiators like Smoke alarm or Hot water to increase appeal.
- Highlight unique or less common amenities you offer (e.g., hot tub, dedicated workspace, EV charger) in your listing description and photos.
- Regularly check competitor amenities in North Lauderdale to stay competitive.
North Lauderdale Airbnb Guest Demographics & Profile Analysis (2026)
Guest Profile Summary for North Lauderdale
- The typical guest profile for Airbnb in North Lauderdale consists of primarily domestic travelers (74%), often arriving from nearby Miami, typically belonging to the Post-2000s (Gen Z/Alpha) group (50%), primarily speaking English or Spanish.
- Domestic travelers account for 73.6% of guests.
- Key international markets include United States (73.6%) and Canada (4.5%).
- Top languages spoken are English (55.2%) followed by Spanish (26.6%).
- A significant demographic segment is the Post-2000s (Gen Z/Alpha) group, representing 50% of guests.
Recommendations for Hosts
- Target domestic marketing efforts towards travelers from Miami and Fort Lauderdale.
- Tailor amenities and listing descriptions to appeal to the dominant Post-2000s (Gen Z/Alpha) demographic (e.g., highlight fast WiFi, smart home features, local guides).
- Highlight unique local experiences or amenities relevant to the primary guest profile.
- Consider seasonal promotions aligned with peak travel times for key origin markets.
Nearby Short-Term Rental Market Comparison
How does the North Lauderdale Airbnb market stack up against its neighbors? Compare key performance metrics like average monthly revenue, ADR, and occupancy rates in surrounding areas to understand the broader regional STR landscape.
| Market | Active Properties | Monthly Revenue | Daily Rate | Avg. Occupancy |
|---|---|---|---|---|
| Sailfish Point | 19 | $16,709 | $1587.63 | 48% |
| Bal Harbour Village | 37 | $8,846 | $850.63 | 34% |
| Lake Clarke Shores | 26 | $6,710 | $516.52 | 46% |
| Lighthouse Point | 75 | $6,205 | $472.94 | 51% |
| Pinecrest | 11 | $6,117 | $861.24 | 43% |
| North Bay Village | 120 | $6,032 | $561.12 | 44% |
| Tequesta | 43 | $4,920 | $376.96 | 50% |
| Juno Beach | 39 | $4,807 | $377.00 | 47% |
| Parkland | 17 | $4,637 | $369.21 | 47% |
| Ocean Ridge | 14 | $4,588 | $602.78 | 48% |