North Fort Myers Airbnb Market Analysis 2026: Short Term Rental Data & Vacation Rental Statistics in Florida, United States
Is Airbnb profitable in North Fort Myers in 2026? Explore comprehensive Airbnb analytics for North Fort Myers, Florida, United States to uncover income potential. This 2026 STR market report for North Fort Myers, based on AirROI data from February 2025 to January 2026, reveals key trends in the niche market of 116 active listings.
Whether you're considering an Airbnb investment in North Fort Myers, optimizing your existing vacation rental, or exploring rental arbitrage opportunities, understanding the North Fort Myers Airbnb data is crucial. Leveraging the low regulation environment is key to maximizing your short term rental income potential. Let's dive into the specifics.
Key North Fort Myers Airbnb Performance Metrics Overview
Monthly Airbnb Revenue Variations & Income Potential in North Fort Myers (2026)
Understanding the monthly revenue variations for Airbnb listings in North Fort Myers is key to maximizing your short term rental income potential. Seasonality significantly impacts earnings. Our analysis, based on data from the past 12 months, shows that the peak revenue month for STRs in North Fort Myers is typically March, while October often presents the lowest earnings, highlighting opportunities for strategic pricing adjustments during shoulder and low seasons. Explore the typical Airbnb income in North Fort Myers across different performance tiers:
- Best-in-class properties (Top 10%) achieve $4,523+ monthly, often utilizing dynamic pricing and superior guest experiences.
- Strong performing properties (Top 25%) earn $2,888 or more, indicating effective management and desirable locations/amenities.
- Typical properties (Median) generate around $1,470 per month, representing the average market performance.
- Entry-level properties (Bottom 25%) see earnings around $719, often with potential for optimization.
Average Monthly Airbnb Earnings Trend in North Fort Myers
North Fort Myers Airbnb Occupancy Rate Trends (2026)
Maximize your bookings by understanding the North Fort Myers STR occupancy trends. Seasonal demand shifts significantly influence how often properties are booked. Typically, Februarysees the highest demand (peak season occupancy), while October experiences the lowest (low season). Effective strategies, like adjusting minimum stays or offering promotions, can boost occupancy during slower periods. Here's how different property tiers perform in North Fort Myers:
- Best-in-class properties (Top 10%) achieve 73%+ occupancy, indicating high desirability and potentially optimized availability.
- Strong performing properties (Top 25%) maintain 51% or higher occupancy, suggesting good market fit and guest satisfaction.
- Typical properties (Median) have an occupancy rate around 34%.
- Entry-level properties (Bottom 25%) average 18% occupancy, potentially facing higher vacancy.
Average Monthly Occupancy Rate Trend in North Fort Myers
Average Daily Rate (ADR) Airbnb Trends in North Fort Myers (2026)
Effective short term rental pricing strategy in North Fort Myers involves understanding monthly ADR fluctuations. The Average Daily Rate (ADR) for Airbnb in North Fort Myers typically peaks in December and dips lowest during May. Leveraging Airbnb dynamic pricing tools or strategies based on this seasonality can significantly boost revenue. Here's a look at the typical nightly rates achieved:
- Best-in-class properties (Top 10%) command rates of $288+ per night, often due to premium features or locations.
- Strong performing properties (Top 25%) achieve nightly rates of $220 or more.
- Typical properties (Median) charge around $162 per night.
- Entry-level properties (Bottom 25%) earn around $102 per night.
Average Daily Rate (ADR) Trend by Month in North Fort Myers
Get Live North Fort Myers Market Intelligence 👇

Explore Real-time Analytics
Airbnb Seasonality Analysis & Trends in North Fort Myers (2026)
Peak Season (March, February, December)
- Revenue averages $3,091 per month
- Occupancy rates average 54.0%
- Daily rates average $179
Shoulder Season
- Revenue averages $1,776 per month
- Occupancy maintains around 33.4%
- Daily rates hold near $172
Low Season (May, September, October)
- Revenue drops to average $1,367 per month
- Occupancy decreases to average 28.8%
- Daily rates adjust to average $171
Seasonality Insights for North Fort Myers
- The Airbnb seasonality in North Fort Myers shows highly seasonal trends requiring careful strategy. While the sections above show seasonal averages, it's also insightful to look at the extremes:
- During the high season, the absolute peak month showcases North Fort Myers's highest earning potential, with monthly revenues capable of climbing to $3,536, occupancy reaching a high of 64.5%, and ADRs peaking at $193.
- Conversely, the slowest single month of the year, typically falling within the low season, marks the market's lowest point. In this month, revenue might dip to $1,183, occupancy could drop to 25.8%, and ADRs may adjust down to $159.
- Understanding both the seasonal averages and these monthly peaks and troughs in revenue, occupancy, and ADR is crucial for maximizing your Airbnb profit potential in North Fort Myers.
Seasonal Strategies for Maximizing Profit
- Peak Season: Maximize revenue through premium pricing and potentially longer minimum stays. Ensure high availability.
- Low Season: Offer competitive pricing, special promotions (e.g., extended stay discounts), and flexible cancellation policies. Target off-season travelers like remote workers or budget-conscious guests.
- Shoulder Seasons: Implement dynamic pricing that balances peak and low rates. Target weekend travelers or specific events. Offer slightly more flexible terms than peak season.
- Regularly analyze your own performance against these North Fort Myers seasonality benchmarks and adjust your pricing and availability strategy accordingly.
Best Areas for Airbnb Investment in North Fort Myers (2026)
Exploring the top neighborhoods for short-term rentals in North Fort Myers? This section highlights key areas, outlining why they are attractive for hosts and guests, along with notable local attractions. Consider these locations based on your target guest profile and investment strategy.
| Neighborhood / Area | Why Host Here? (Target Guests & Appeal) | Key Attractions & Landmarks |
|---|---|---|
| Downtown Fort Myers | The historic heart of Fort Myers with a vibrant arts scene. Offers waterfront dining, shopping, and cultural events, making it a prime location for tourists and business travelers. | Fort Myers River District, Burroughs Home and Gardens, Centennial Park, The Florida Repertory Theatre, Calusa Nature Center and Planetarium |
| Cape Coral | Just minutes from North Fort Myers, known for its extensive canal system and boating opportunities. Attracts families and vacationers looking for water activities and outdoor fun. | Yacht Club Community Park, Cape Coral Historical Museum, Four Freedoms Park, Sun Splash Family Waterpark, Rotary Park Environmental Center |
| North Fort Myers | A family-friendly suburb with parks, recreational areas, and proximity to Fort Myers. Appeals to those looking for quieter accommodations close to urban amenities. | Edison Park, North Fort Myers Community Park, Manatee Park, Dunbar Park, El Rio Golf Club |
| Fort Myers Beach | A popular tourist destination known for its beautiful beaches and vibrant nightlife. Perfect for attracting vacationers looking for sun and fun by the water. | Times Square, Lynn Hall Beach Park, Fort Myers Beach Pier, Bowditch Point Park, Coconut Point Park |
| Sanibel Island | Famous for its stunning beaches and shelling. A sought-after vacation spot for nature lovers and families, making it ideal for short-term rentals. | Bowman's Beach, J.N. Ding Darling National Wildlife Refuge, Sanibel Lighthouse, Captiva Island, Bailey-Matthews National Shell Museum |
| Captiva Island | A picturesque destination near Sanibel, known for its secluded beaches and tranquil atmosphere. Attracts couples and families looking for relaxation and nature. | Captiva Beach, North Captiva Island, Blind Pass Beach, South Seas Island Resort, Captiva Island Historical Society |
| Lehigh Acres | A growing community with affordable housing options. Offers a suburban setting that appeals to families and individuals looking for more space and local amenities. | Lehigh Acres Parks and Recreation, Greenbriar Park, Lehigh Acres Community Park, The Lehigh Acres Trailhead Park |
| Estero | A suburban area with a blend of residential and commercial developments. Close to beaches and offers many shopping and dining options, great for family vacations. | Coconut Point Mall, Estero River, Koreshan State Park, Germain Arena, Estero Community Park |
Understanding Airbnb License Requirements & STR Laws in North Fort Myers (2026)
While North Fort Myers, Florida, United States currently shows low STR regulations, specific Airbnb license requirements might still exist or change. Always verify the latest short term rental regulations and Airbnb license requirements directly with local government authorities for North Fort Myers to ensure full compliance before hosting.
(Source: AirROI data, 2026, finding no licensed listings among those analyzed)
Top Performing Airbnb Properties in North Fort Myers (2026)
Benchmark your potential! Explore examples of top-performing Airbnb properties in North Fort Myersbased on Trailing Twelve Month (TTM) revenue. Analyze their characteristics, revenue, occupancy rate, and ADR to understand what drives success in this market.
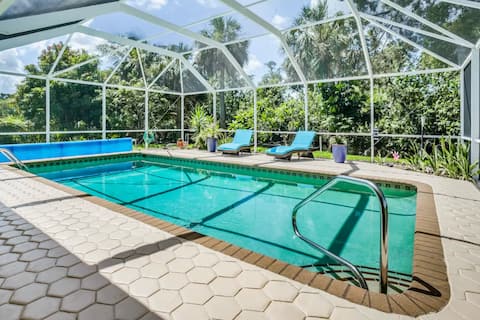
NEW! Waterfront Heated Pool, Kayaks, Fishing Pier.
Entire Place • 3 bedrooms
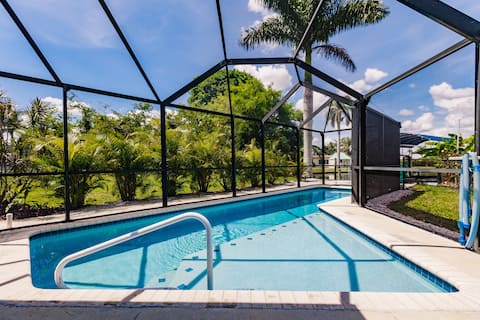
Luxury Spacious Home Pool, Boat Dock Gulf Access!
Entire Place • 4 bedrooms
Waterfront Deal: Hot Tub, Kayaks & Fishing - Pets
Entire Place • 3 bedrooms
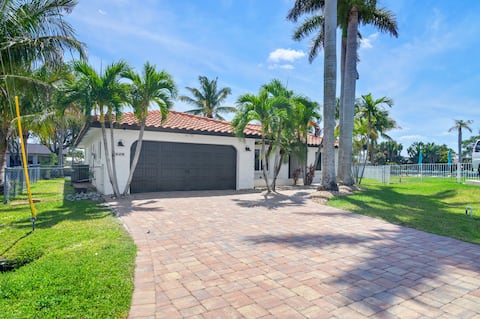
3 BR Heated Pool House with Boat Lift
Entire Place • 3 bedrooms
The Bridge Escape • Fort Myers
Entire Place • 4 bedrooms
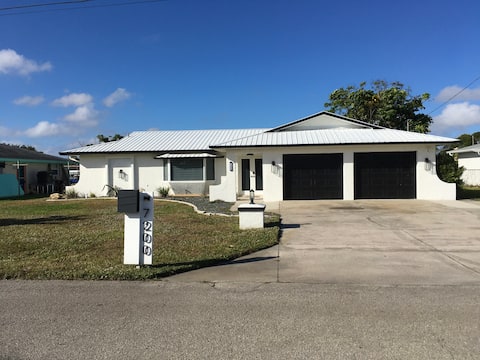
Waterfront North Fort Myers Home w/ Private Pool!
Entire Place • 3 bedrooms
Note: Performance varies based on location, size, amenities, seasonality, and management quality. Data reflects the past 12 months.
Top Performing Airbnb Hosts in North Fort Myers (2026)
Learn from the best! This table showcases top-performing Airbnb hosts in North Fort Myers based on the number of properties managed and estimated total revenue over the past year. Analyze their scale and performance metrics.
| Host Name | Properties | Grossing Revenue | Stay Reviews | Avg Rating |
|---|---|---|---|---|
| CoralVilla | 2 | $63,305 | 37 | 4.85/5.0 |
| Carlos | 1 | $61,699 | 63 | 4.84/5.0 |
| Francisco | 1 | $58,226 | 114 | 4.79/5.0 |
| Johanna | 1 | $57,326 | 37 | 4.97/5.0 |
| Evolve | 3 | $56,885 | 30 | 4.82/5.0 |
| Maria | 1 | $53,271 | 60 | 5.00/5.0 |
| Boris & Jorgette | 1 | $43,045 | 11 | 4.73/5.0 |
| Tom | 3 | $42,678 | 23 | 4.97/5.0 |
| Christy | 1 | $37,094 | 9 | 4.67/5.0 |
| Kendra | 1 | $36,732 | 20 | 4.65/5.0 |
Analyzing the strategies of top hosts, such as their property selection, pricing, and guest communication, can offer valuable lessons for optimizing your own Airbnb operations in North Fort Myers.
Dive Deeper: Advanced North Fort Myers STR Market Data (2026)
Ready to unlock more insights? AirROI provides access to advanced metrics and comprehensive Airbnb data for North Fort Myers. Explore detailed analytics beyond this report to refine your investment strategy, optimize pricing, and maximize your vacation rental profits.
Explore Advanced MetricsNorth Fort Myers Short-Term Rental Market Composition (2026): Property & Room Types
Room Type Distribution
Property Type Distribution
Market Composition Insights for North Fort Myers
- The North Fort Myers Airbnb market composition is heavily skewed towards Entire Home/Apt listings, which make up 87.1% of the 116 active rentals. This indicates strong guest preference for privacy and space.
- Looking at the property type distribution in North Fort Myers, House properties are the most common (83.6%), reflecting the local real estate landscape.
- Houses represent a significant 83.6% portion, catering likely to families or larger groups.
- Smaller segments like outdoor/unique, others, hotel/boutique (combined 7.7%) offer potential for unique stay experiences.
North Fort Myers Airbnb Room Capacity Analysis (2026): Bedroom Distribution
Distribution of Listings by Number of Bedrooms
Room Capacity Insights for North Fort Myers
- The dominant room capacity in North Fort Myers is 3 bedrooms listings, making up 37.1% of the market. This suggests a strong demand for properties suitable for families or small groups.
- Together, 3 bedrooms and 2 bedrooms properties represent 62.1% of the active Airbnb listings in North Fort Myers, indicating a high concentration in these sizes.
- A significant 47.4% of listings offer 3+ bedrooms, catering to larger groups and families seeking more space in North Fort Myers.
North Fort Myers Vacation Rental Guest Capacity Trends (2026)
Distribution of Listings by Guest Capacity
Guest Capacity Insights for North Fort Myers
- The most common guest capacity trend in North Fort Myers vacation rentals is listings accommodating 6 guests (24.1%). This suggests the primary traveler segment is likely larger groups.
- Properties designed for 6 guests and 8+ guests dominate the North Fort Myers STR market, accounting for 44.8% of listings.
- 50.0% of properties accommodate 6+ guests, serving the market segment for larger families or group travel in North Fort Myers.
- On average, properties in North Fort Myers are equipped to host 4.9 guests.
North Fort Myers Airbnb Booking Patterns (2026): Available vs. Booked Days
Available Days Distribution
Booked Days Distribution
Booking Pattern Insights for North Fort Myers
- The most common availability pattern in North Fort Myers falls within the 271-366 days range, representing 70.7% of listings. This suggests many properties have significant open periods on their calendars.
- Approximately 94.8% of listings show high availability (181+ days open annually), indicating potential for increased bookings or specific owner usage patterns.
- For booked days, the 31-90 days range is most frequent in North Fort Myers (43.1%), reflecting common guest stay durations or potential owner blocking patterns.
- A notable 5.2% of properties secure long booking periods (181+ days booked per year), highlighting successful long-term rental strategies or significant owner usage.
North Fort Myers Airbnb Minimum Stay Requirements Analysis
Distribution of Listings by Minimum Night Requirement
1 Night
24 listings
20.7% of total
2 Nights
21 listings
18.1% of total
3 Nights
11 listings
9.5% of total
4-6 Nights
22 listings
19% of total
7-29 Nights
7 listings
6% of total
30+ Nights
31 listings
26.7% of total
Key Insights
- The most prevalent minimum stay requirement in North Fort Myers is 30+ Nights, adopted by 26.7% of listings. This highlights the market's preference for longer commitments.
- A significant segment (26.7%) caters to monthly stays (30+ nights) in North Fort Myers, pointing to opportunities in the extended-stay market.
Recommendations
- Align with the market by considering a 30+ Nights minimum stay, as 26.7% of North Fort Myers hosts use this setting.
- If feasible, allowing 1-night stays, especially midweek or during low season, could capture last-minute bookings, as only 20.7% currently do.
- Explore offering discounts for stays of 30+ nights to attract the 26.7% of the market seeking extended stays.
- Adjust minimum nights based on seasonality – potentially shorter during low season and longer during peak demand periods in North Fort Myers.
North Fort Myers Airbnb Cancellation Policy Trends Analysis (2026)
Limited
2 listings
1.8% of total
Super Strict 60 Days
4 listings
3.5% of total
Flexible
20 listings
17.5% of total
Moderate
25 listings
21.9% of total
Firm
45 listings
39.5% of total
Strict
18 listings
15.8% of total
Cancellation Policy Insights for North Fort Myers
- The prevailing Airbnb cancellation policy trend in North Fort Myers is Firm, used by 39.5% of listings.
- A majority (55.3%) of hosts in North Fort Myers utilize Firm or Strict policies, indicating a market where hosts prioritize booking security.
Recommendations for Hosts
- Consider adopting a Firm policy to align with the 39.5% market standard in North Fort Myers.
- Regularly review your cancellation policy against competitors and market demand shifts in North Fort Myers.
North Fort Myers STR Booking Lead Time Analysis (2026)
Average Booking Lead Time by Month
Booking Lead Time Insights for North Fort Myers
- The overall average booking lead time for vacation rentals in North Fort Myers is 50 days.
- Guests book furthest in advance for stays during January (average 82 days), likely coinciding with peak travel demand or local events.
- The shortest booking windows occur for stays in June (average 18 days), indicating more last-minute travel plans during this time.
- Seasonally, Winter (67 days avg.) sees the longest lead times, while Summer (25 days avg.) has the shortest, reflecting typical travel planning cycles.
Recommendations for Hosts
- Use the overall average lead time (50 days) as a baseline for your pricing and availability strategy in North Fort Myers.
- For January stays, consider implementing length-of-stay discounts or slightly higher rates for bookings made less than 82 days out to capitalize on advance planning.
- Target marketing efforts for the Winter season well in advance (at least 67 days) to capture early planners.
- Monitor your own booking lead times against these North Fort Myers averages to identify opportunities for dynamic pricing adjustments.
Popular & Essential Airbnb Amenities in North Fort Myers (2026)
Amenity Prevalence
Amenity Insights for North Fort Myers
- Essential amenities in North Fort Myers that guests expect include: Wifi, TV, Air conditioning, Free parking on premises. Lacking these (any) could significantly impact bookings.
- Popular amenities like Smoke alarm, Kitchen, Hot water are common but not universal. Offering these can provide a competitive edge.
Recommendations for Hosts
- Ensure your listing includes all essential amenities for North Fort Myers: Wifi, TV, Air conditioning, Free parking on premises.
- Prioritize adding missing essentials: Wifi, TV, Air conditioning, Free parking on premises.
- Consider adding popular differentiators like Smoke alarm or Kitchen to increase appeal.
- Highlight unique or less common amenities you offer (e.g., hot tub, dedicated workspace, EV charger) in your listing description and photos.
- Regularly check competitor amenities in North Fort Myers to stay competitive.
North Fort Myers Airbnb Guest Demographics & Profile Analysis (2026)
Guest Profile Summary for North Fort Myers
- The typical guest profile for Airbnb in North Fort Myers consists of primarily domestic travelers (92%), often arriving from nearby Fort Myers, typically belonging to the Post-2000s (Gen Z/Alpha) group (50%), primarily speaking English or Spanish.
- Domestic travelers account for 91.9% of guests.
- Key international markets include United States (91.9%) and Germany (2%).
- Top languages spoken are English (64.3%) followed by Spanish (19.7%).
- A significant demographic segment is the Post-2000s (Gen Z/Alpha) group, representing 50% of guests.
Recommendations for Hosts
- Target domestic marketing efforts towards travelers from Fort Myers and Tampa.
- Tailor amenities and listing descriptions to appeal to the dominant Post-2000s (Gen Z/Alpha) demographic (e.g., highlight fast WiFi, smart home features, local guides).
- Highlight unique local experiences or amenities relevant to the primary guest profile.
- Consider seasonal promotions aligned with peak travel times for key origin markets.
Nearby Short-Term Rental Market Comparison
How does the North Fort Myers Airbnb market stack up against its neighbors? Compare key performance metrics like average monthly revenue, ADR, and occupancy rates in surrounding areas to understand the broader regional STR landscape.
| Market | Active Properties | Monthly Revenue | Daily Rate | Avg. Occupancy |
|---|---|---|---|---|
| Sailfish Point | 19 | $16,709 | $1587.63 | 48% |
| Bal Harbour Village | 37 | $8,846 | $850.63 | 34% |
| Anna Maria island | 587 | $7,996 | $823.96 | 41% |
| Lake Clarke Shores | 26 | $6,710 | $516.52 | 46% |
| Anna Maria | 56 | $6,434 | $692.96 | 52% |
| Lighthouse Point | 75 | $6,205 | $472.94 | 51% |
| Boca Grande | 31 | $6,128 | $787.07 | 37% |
| Pinecrest | 11 | $6,117 | $861.24 | 43% |
| North Bay Village | 120 | $6,032 | $561.12 | 44% |
| Indian Rocks Beach | 842 | $5,560 | $419.63 | 49% |