Mullis City Airbnb Market Analysis 2025: Short Term Rental Data & Vacation Rental Statistics in Florida, United States
Is Airbnb profitable in Mullis City in 2025? Explore comprehensive Airbnb analytics for Mullis City, Florida, United States to uncover income potential. This 2025 STR market report for Mullis City, based on AirROI data from November 2024 to October 2025, reveals key trends in the niche market of 21 active listings.
Whether you're considering an Airbnb investment in Mullis City, optimizing your existing vacation rental, or exploring rental arbitrage opportunities, understanding the Mullis City Airbnb data is crucial. Leveraging the low regulation environment is key to maximizing your short term rental income potential. Let's dive into the specifics.
Key Mullis City Airbnb Performance Metrics Overview
Monthly Airbnb Revenue Variations & Income Potential in Mullis City (2025)
Understanding the monthly revenue variations for Airbnb listings in Mullis City is key to maximizing your short term rental income potential. Seasonality significantly impacts earnings. Our analysis, based on data from the past 12 months, shows that the peak revenue month for STRs in Mullis City is typically March, while October often presents the lowest earnings, highlighting opportunities for strategic pricing adjustments during shoulder and low seasons. Explore the typical Airbnb income in Mullis City across different performance tiers:
- Best-in-class properties (Top 10%) achieve $7,503+ monthly, often utilizing dynamic pricing and superior guest experiences.
- Strong performing properties (Top 25%) earn $4,153 or more, indicating effective management and desirable locations/amenities.
- Typical properties (Median) generate around $2,148 per month, representing the average market performance.
- Entry-level properties (Bottom 25%) see earnings around $941, often with potential for optimization.
Average Monthly Airbnb Earnings Trend in Mullis City
Mullis City Airbnb Occupancy Rate Trends (2025)
Maximize your bookings by understanding the Mullis City STR occupancy trends. Seasonal demand shifts significantly influence how often properties are booked. Typically, Marchsees the highest demand (peak season occupancy), while October experiences the lowest (low season). Effective strategies, like adjusting minimum stays or offering promotions, can boost occupancy during slower periods. Here's how different property tiers perform in Mullis City:
- Best-in-class properties (Top 10%) achieve 85%+ occupancy, indicating high desirability and potentially optimized availability.
- Strong performing properties (Top 25%) maintain 75% or higher occupancy, suggesting good market fit and guest satisfaction.
- Typical properties (Median) have an occupancy rate around 49%.
- Entry-level properties (Bottom 25%) average 29% occupancy, potentially facing higher vacancy.
Average Monthly Occupancy Rate Trend in Mullis City
Average Daily Rate (ADR) Airbnb Trends in Mullis City (2025)
Effective short term rental pricing strategy in Mullis City involves understanding monthly ADR fluctuations. The Average Daily Rate (ADR) for Airbnb in Mullis City typically peaks in December and dips lowest during August. Leveraging Airbnb dynamic pricing tools or strategies based on this seasonality can significantly boost revenue. Here's a look at the typical nightly rates achieved:
- Best-in-class properties (Top 10%) command rates of $353+ per night, often due to premium features or locations.
- Strong performing properties (Top 25%) achieve nightly rates of $181 or more.
- Typical properties (Median) charge around $110 per night.
- Entry-level properties (Bottom 25%) earn around $78 per night.
Average Daily Rate (ADR) Trend by Month in Mullis City
Get Live Mullis City Market Intelligence 👇

Explore Real-time Analytics
Airbnb Seasonality Analysis & Trends in Mullis City (2025)
Peak Season (March, February, December)
- Revenue averages $3,964 per month
- Occupancy rates average 64.4%
- Daily rates average $169
Shoulder Season
- Revenue averages $2,958 per month
- Occupancy maintains around 50.6%
- Daily rates hold near $163
Low Season (August, September, October)
- Revenue drops to average $2,250 per month
- Occupancy decreases to average 41.5%
- Daily rates adjust to average $157
Seasonality Insights for Mullis City
- The Airbnb seasonality in Mullis City shows highly seasonal trends requiring careful strategy. While the sections above show seasonal averages, it's also insightful to look at the extremes:
- During the high season, the absolute peak month showcases Mullis City's highest earning potential, with monthly revenues capable of climbing to $4,649, occupancy reaching a high of 66.0%, and ADRs peaking at $171.
- Conversely, the slowest single month of the year, typically falling within the low season, marks the market's lowest point. In this month, revenue might dip to $1,846, occupancy could drop to 35.2%, and ADRs may adjust down to $155.
- Understanding both the seasonal averages and these monthly peaks and troughs in revenue, occupancy, and ADR is crucial for maximizing your Airbnb profit potential in Mullis City.
Seasonal Strategies for Maximizing Profit
- Peak Season: Maximize revenue through premium pricing and potentially longer minimum stays. Ensure high availability.
- Low Season: Offer competitive pricing, special promotions (e.g., extended stay discounts), and flexible cancellation policies. Target off-season travelers like remote workers or budget-conscious guests.
- Shoulder Seasons: Implement dynamic pricing that balances peak and low rates. Target weekend travelers or specific events. Offer slightly more flexible terms than peak season.
- Regularly analyze your own performance against these Mullis City seasonality benchmarks and adjust your pricing and availability strategy accordingly.
Best Areas for Airbnb Investment in Mullis City (2025)
Exploring the top neighborhoods for short-term rentals in Mullis City? This section highlights key areas, outlining why they are attractive for hosts and guests, along with notable local attractions. Consider these locations based on your target guest profile and investment strategy.
| Neighborhood / Area | Why Host Here? (Target Guests & Appeal) | Key Attractions & Landmarks |
|---|---|---|
| Mullis City Center | The heart of Mullis City with bustling shops and eateries. Ideal for visitors looking to explore local culture and enjoy convenience. | Mullis City Park, Local Antique Shops, Mullis Art Gallery |
| Mullis Lake | A scenic area surrounding the lake, perfect for families and those seeking outdoor activities like fishing and boating. | Mullis Lake Beach, Hiking Trails, Picnic Areas |
| Historic Mullis District | Known for its charming historic homes and architecture. A great location for guests interested in history and heritage. | Mullis Historical Museum, Guided Heritage Tours |
| Mullis Nature Reserve | A beautiful nature reserve offering hiking trails and wildlife watching. Ideal for nature lovers and outdoor enthusiasts. | Nature Trails, Birdwatching, Picnic Spots |
| Mullis Golf Club Area | A popular location for golf enthusiasts and those looking for serene views. Attracts sporting guests year-round. | Mullis Golf Club, Driving Range, Clubhouse Restaurant |
| Downtown Mullis nightlife | A vibrant area known for its nightlife offerings, appealing to younger crowds and tourists looking for fun evenings out. | Bars and Clubs, Live Music Venues, Local Festivals |
| Mullis Arts District | An artsy area filled with galleries, studios, and art installations. Great for creatives and arts enthusiasts. | Art Galleries, Workshops, Art Festivals |
| Family-friendly Mullis Suburbs | Quiet residential neighborhoods ideal for families visiting the area. Close to schools and parks, making it suitable for longer stays. | Local Parks, Elementary Schools, Family-friendly Dining Options |
Understanding Airbnb License Requirements & STR Laws in Mullis City (2025)
While Mullis City, Florida, United States currently shows low STR regulations, specific Airbnb license requirements might still exist or change. Always verify the latest short term rental regulations and Airbnb license requirements directly with local government authorities for Mullis City to ensure full compliance before hosting.
(Source: AirROI data, 2025, finding no licensed listings among those analyzed)
Top Performing Airbnb Properties in Mullis City (2025)
Benchmark your potential! Explore examples of top-performing Airbnb properties in Mullis Citybased on Trailing Twelve Month (TTM) revenue. Analyze their characteristics, revenue, occupancy rate, and ADR to understand what drives success in this market.
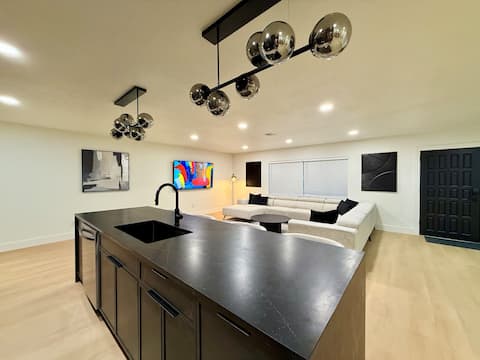
Big Luxury Modern Pool Home With Hot Tub!
Entire Place • 4 bedrooms
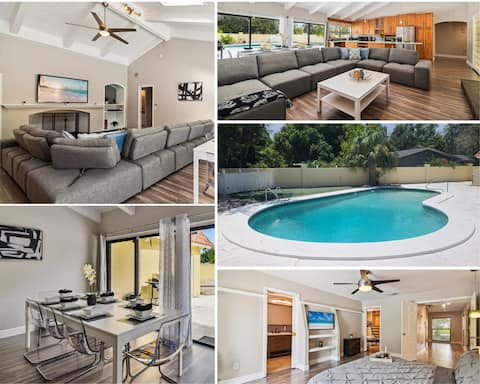
5 Star Tampa POOL Oasis
Entire Place • 4 bedrooms
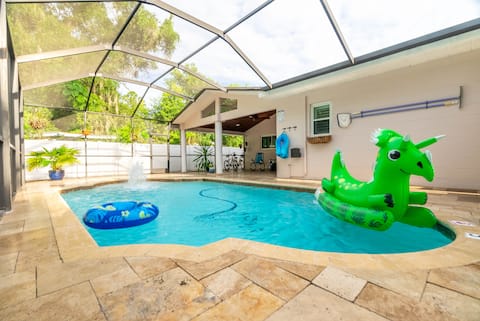
Tropical Tampa Oasis ~ Heated Pool
Entire Place • 4 bedrooms
Huge Pool House + 14 Guests + King Bed + Renovated
Entire Place • 4 bedrooms
Zen Holistic Retreat by Carrollwood/Westchase
Entire Place • 2 bedrooms
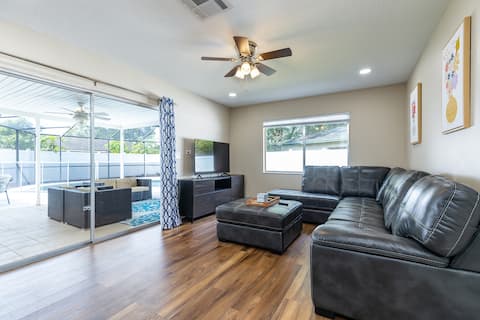
Family-friendly getaway home in the heart of Tampa
Entire Place • 3 bedrooms
Note: Performance varies based on location, size, amenities, seasonality, and management quality. Data reflects the past 12 months.
Top Performing Airbnb Hosts in Mullis City (2025)
Learn from the best! This table showcases top-performing Airbnb hosts in Mullis City based on the number of properties managed and estimated total revenue over the past year. Analyze their scale and performance metrics.
| Host Name | Properties | Grossing Revenue | Stay Reviews | Avg Rating |
|---|---|---|---|---|
| Siddhant | 1 | $84,853 | 35 | 5.00/5.0 |
| David | 1 | $77,045 | 137 | 4.82/5.0 |
| Beatriz | 1 | $74,069 | 52 | 4.58/5.0 |
| Brian | 2 | $69,330 | 147 | 4.82/5.0 |
| Mark | 1 | $57,497 | 83 | 4.84/5.0 |
| Scott | 1 | $47,428 | 133 | 4.86/5.0 |
| Thanh | 3 | $26,660 | 320 | 4.78/5.0 |
| Rosy | 1 | $25,285 | 19 | 4.79/5.0 |
| Grand Welcome Tampa | 1 | $19,264 | 5 | 4.80/5.0 |
| Nicole | 1 | $15,328 | 34 | 4.97/5.0 |
Analyzing the strategies of top hosts, such as their property selection, pricing, and guest communication, can offer valuable lessons for optimizing your own Airbnb operations in Mullis City.
Dive Deeper: Advanced Mullis City STR Market Data (2025)
Ready to unlock more insights? AirROI provides access to advanced metrics and comprehensive Airbnb data for Mullis City. Explore detailed analytics beyond this report to refine your investment strategy, optimize pricing, and maximize your vacation rental profits.
Explore Advanced MetricsMullis City Short-Term Rental Market Composition (2025): Property & Room Types
Room Type Distribution
Property Type Distribution
Market Composition Insights for Mullis City
- The Mullis City Airbnb market composition is heavily skewed towards Entire Home/Apt listings, which make up 95.2% of the 21 active rentals. This indicates strong guest preference for privacy and space.
- Looking at the property type distribution in Mullis City, House properties are the most common (47.6%), reflecting the local real estate landscape.
- Houses represent a significant 47.6% portion, catering likely to families or larger groups.
- The presence of 9.5% Hotel/Boutique listings indicates integration with traditional hospitality.
- Smaller segments like others (combined 4.8%) offer potential for unique stay experiences.
Mullis City Airbnb Room Capacity Analysis (2025): Bedroom Distribution
Distribution of Listings by Number of Bedrooms
Room Capacity Insights for Mullis City
- The dominant room capacity in Mullis City is 1 bedroom listings, making up 42.9% of the market. This suggests a strong demand for properties suitable for couples or solo travelers.
- Together, 1 bedroom and 4 bedrooms properties represent 66.7% of the active Airbnb listings in Mullis City, indicating a high concentration in these sizes.
- A significant 38.1% of listings offer 3+ bedrooms, catering to larger groups and families seeking more space in Mullis City.
Mullis City Vacation Rental Guest Capacity Trends (2025)
Distribution of Listings by Guest Capacity
Guest Capacity Insights for Mullis City
- The most common guest capacity trend in Mullis City vacation rentals is listings accommodating 8+ guests (28.6%). This suggests the primary traveler segment is likely larger groups.
- Properties designed for 8+ guests and 2 guests dominate the Mullis City STR market, accounting for 52.4% of listings.
- 42.9% of properties accommodate 6+ guests, serving the market segment for larger families or group travel in Mullis City.
- On average, properties in Mullis City are equipped to host 4.7 guests.
Mullis City Airbnb Booking Patterns (2025): Available vs. Booked Days
Available Days Distribution
Booked Days Distribution
Booking Pattern Insights for Mullis City
- The most common availability pattern in Mullis City falls within the 271-366 days range, representing 38.1% of listings. This suggests many properties have significant open periods on their calendars.
- Approximately 66.7% of listings show high availability (181+ days open annually), indicating potential for increased bookings or specific owner usage patterns.
- For booked days, the 91-180 days range is most frequent in Mullis City (38.1%), reflecting common guest stay durations or potential owner blocking patterns.
- A notable 33.3% of properties secure long booking periods (181+ days booked per year), highlighting successful long-term rental strategies or significant owner usage.
Mullis City Airbnb Minimum Stay Requirements Analysis
Distribution of Listings by Minimum Night Requirement
1 Night
3 listings
15% of total
2 Nights
5 listings
25% of total
3 Nights
4 listings
20% of total
4-6 Nights
2 listings
10% of total
30+ Nights
6 listings
30% of total
Key Insights
- The most prevalent minimum stay requirement in Mullis City is 30+ Nights, adopted by 30% of listings. This highlights the market's preference for longer commitments.
- A significant segment (30%) caters to monthly stays (30+ nights) in Mullis City, pointing to opportunities in the extended-stay market.
Recommendations
- Align with the market by considering a 30+ Nights minimum stay, as 30% of Mullis City hosts use this setting.
- If feasible, allowing 1-night stays, especially midweek or during low season, could capture last-minute bookings, as only 15% currently do.
- Explore offering discounts for stays of 30+ nights to attract the 30% of the market seeking extended stays.
- Adjust minimum nights based on seasonality – potentially shorter during low season and longer during peak demand periods in Mullis City.
Mullis City Airbnb Cancellation Policy Trends Analysis (2025)
Flexible
3 listings
15% of total
Moderate
11 listings
55% of total
Firm
4 listings
20% of total
Strict
2 listings
10% of total
Cancellation Policy Insights for Mullis City
- The prevailing Airbnb cancellation policy trend in Mullis City is Moderate, used by 55% of listings.
- There's a relatively balanced mix between guest-friendly (70.0%) and stricter (30.0%) policies, offering choices for different guest needs.
Recommendations for Hosts
- Consider adopting a Moderate policy to align with the 55% market standard in Mullis City.
- Using a Strict policy might deter some guests, as only 10% of listings use it. Evaluate if potential revenue protection outweighs possible lower booking rates.
- Regularly review your cancellation policy against competitors and market demand shifts in Mullis City.
Mullis City STR Booking Lead Time Analysis (2025)
Average Booking Lead Time by Month
Booking Lead Time Insights for Mullis City
- The overall average booking lead time for vacation rentals in Mullis City is 37 days.
- Guests book furthest in advance for stays during April (average 62 days), likely coinciding with peak travel demand or local events.
- The shortest booking windows occur for stays in July (average 21 days), indicating more last-minute travel plans during this time.
- Seasonally, Spring (48 days avg.) sees the longest lead times, while Summer (24 days avg.) has the shortest, reflecting typical travel planning cycles.
Recommendations for Hosts
- Use the overall average lead time (37 days) as a baseline for your pricing and availability strategy in Mullis City.
- For April stays, consider implementing length-of-stay discounts or slightly higher rates for bookings made less than 62 days out to capitalize on advance planning.
- Target marketing efforts for the Spring season well in advance (at least 48 days) to capture early planners.
- Monitor your own booking lead times against these Mullis City averages to identify opportunities for dynamic pricing adjustments.
Popular & Essential Airbnb Amenities in Mullis City (2025)
Amenity Prevalence
Amenity Insights for Mullis City
- Essential amenities in Mullis City that guests expect include: Free parking on premises, Wifi, Hot water, Smoke alarm, Air conditioning, TV, Hair dryer. Lacking these (any) could significantly impact bookings.
- Popular amenities like Kitchen, Heating, Microwave are common but not universal. Offering these can provide a competitive edge.
Recommendations for Hosts
- Ensure your listing includes all essential amenities for Mullis City: Free parking on premises, Wifi, Hot water, Smoke alarm, Air conditioning, TV, Hair dryer.
- Prioritize adding missing essentials: TV, Hair dryer.
- Consider adding popular differentiators like Kitchen or Heating to increase appeal.
- Highlight unique or less common amenities you offer (e.g., hot tub, dedicated workspace, EV charger) in your listing description and photos.
- Regularly check competitor amenities in Mullis City to stay competitive.
Mullis City Airbnb Guest Demographics & Profile Analysis (2025)
Guest Profile Summary for Mullis City
- The typical guest profile for Airbnb in Mullis City consists of primarily domestic travelers (91%), often arriving from nearby Tampa, typically belonging to the Post-2000s (Gen Z/Alpha) group (50%), primarily speaking English or Spanish.
- Domestic travelers account for 91.0% of guests.
- Key international markets include United States (91%) and Canada (3.4%).
- Top languages spoken are English (69.1%) followed by Spanish (23%).
- A significant demographic segment is the Post-2000s (Gen Z/Alpha) group, representing 50% of guests.
Recommendations for Hosts
- Target domestic marketing efforts towards travelers from Tampa and New York.
- Tailor amenities and listing descriptions to appeal to the dominant Post-2000s (Gen Z/Alpha) demographic (e.g., highlight fast WiFi, smart home features, local guides).
- Highlight unique local experiences or amenities relevant to the primary guest profile.
- Consider seasonal promotions aligned with peak travel times for key origin markets.
Nearby Short-Term Rental Market Comparison
How does the Mullis City Airbnb market stack up against its neighbors? Compare key performance metrics like average monthly revenue, ADR, and occupancy rates in surrounding areas to understand the broader regional STR landscape.
| Market | Active Properties | Monthly Revenue | Daily Rate | Avg. Occupancy |
|---|---|---|---|---|
| Anna Maria island | 587 | $7,433 | $824.81 | 40% |
| St. Augustine Beach | 10 | $6,713 | $427.27 | 48% |
| Reunion | 12 | $6,493 | $583.05 | 42% |
| Vilano Beach | 174 | $5,928 | $452.40 | 46% |
| Indian Rocks Beach | 799 | $5,613 | $430.15 | 49% |
| Bradenton Beach | 65 | $5,585 | $520.88 | 45% |
| Siesta Key | 1,109 | $5,281 | $514.53 | 43% |
| Belleair Beach | 97 | $4,908 | $341.97 | 53% |
| Thonotosassa | 17 | $4,846 | $349.94 | 54% |
| Seminole | 503 | $4,631 | $321.57 | 55% |