Miramar Airbnb Market Analysis 2026: Short Term Rental Data & Vacation Rental Statistics in Florida, United States
Is Airbnb profitable in Miramar in 2026? Explore comprehensive Airbnb analytics for Miramar, Florida, United States to uncover income potential. This 2026 STR market report for Miramar, based on AirROI data from February 2025 to January 2026, reveals key trends in the niche market of 110 active listings.
Whether you're considering an Airbnb investment in Miramar, optimizing your existing vacation rental, or exploring rental arbitrage opportunities, understanding the Miramar Airbnb data is crucial. Leveraging the low regulation environment is key to maximizing your short term rental income potential. Let's dive into the specifics.
Key Miramar Airbnb Performance Metrics Overview
Monthly Airbnb Revenue Variations & Income Potential in Miramar (2026)
Understanding the monthly revenue variations for Airbnb listings in Miramar is key to maximizing your short term rental income potential. Seasonality significantly impacts earnings. Our analysis, based on data from the past 12 months, shows that the peak revenue month for STRs in Miramar is typically March, while September often presents the lowest earnings, highlighting opportunities for strategic pricing adjustments during shoulder and low seasons. Explore the typical Airbnb income in Miramar across different performance tiers:
- Best-in-class properties (Top 10%) achieve $5,781+ monthly, often utilizing dynamic pricing and superior guest experiences.
- Strong performing properties (Top 25%) earn $3,268 or more, indicating effective management and desirable locations/amenities.
- Typical properties (Median) generate around $1,574 per month, representing the average market performance.
- Entry-level properties (Bottom 25%) see earnings around $761, often with potential for optimization.
Average Monthly Airbnb Earnings Trend in Miramar
Miramar Airbnb Occupancy Rate Trends (2026)
Maximize your bookings by understanding the Miramar STR occupancy trends. Seasonal demand shifts significantly influence how often properties are booked. Typically, Marchsees the highest demand (peak season occupancy), while May experiences the lowest (low season). Effective strategies, like adjusting minimum stays or offering promotions, can boost occupancy during slower periods. Here's how different property tiers perform in Miramar:
- Best-in-class properties (Top 10%) achieve 84%+ occupancy, indicating high desirability and potentially optimized availability.
- Strong performing properties (Top 25%) maintain 72% or higher occupancy, suggesting good market fit and guest satisfaction.
- Typical properties (Median) have an occupancy rate around 49%.
- Entry-level properties (Bottom 25%) average 23% occupancy, potentially facing higher vacancy.
Average Monthly Occupancy Rate Trend in Miramar
Average Daily Rate (ADR) Airbnb Trends in Miramar (2026)
Effective short term rental pricing strategy in Miramar involves understanding monthly ADR fluctuations. The Average Daily Rate (ADR) for Airbnb in Miramar typically peaks in December and dips lowest during April. Leveraging Airbnb dynamic pricing tools or strategies based on this seasonality can significantly boost revenue. Here's a look at the typical nightly rates achieved:
- Best-in-class properties (Top 10%) command rates of $355+ per night, often due to premium features or locations.
- Strong performing properties (Top 25%) achieve nightly rates of $220 or more.
- Typical properties (Median) charge around $105 per night.
- Entry-level properties (Bottom 25%) earn around $70 per night.
Average Daily Rate (ADR) Trend by Month in Miramar
Get Live Miramar Market Intelligence 👇

Explore Real-time Analytics
Airbnb Seasonality Analysis & Trends in Miramar (2026)
Peak Season (March, December, February)
- Revenue averages $3,091 per month
- Occupancy rates average 59.9%
- Daily rates average $165
Shoulder Season
- Revenue averages $2,394 per month
- Occupancy maintains around 46.4%
- Daily rates hold near $162
Low Season (May, September, November)
- Revenue drops to average $1,989 per month
- Occupancy decreases to average 40.3%
- Daily rates adjust to average $164
Seasonality Insights for Miramar
- The Airbnb seasonality in Miramar shows moderate seasonality with distinct peak and low periods. While the sections above show seasonal averages, it's also insightful to look at the extremes:
- During the high season, the absolute peak month showcases Miramar's highest earning potential, with monthly revenues capable of climbing to $3,443, occupancy reaching a high of 64.5%, and ADRs peaking at $181.
- Conversely, the slowest single month of the year, typically falling within the low season, marks the market's lowest point. In this month, revenue might dip to $1,863, occupancy could drop to 38.4%, and ADRs may adjust down to $153.
- Understanding both the seasonal averages and these monthly peaks and troughs in revenue, occupancy, and ADR is crucial for maximizing your Airbnb profit potential in Miramar.
Seasonal Strategies for Maximizing Profit
- Peak Season: Maximize revenue through premium pricing and potentially longer minimum stays. Ensure high availability.
- Low Season: Offer competitive pricing, special promotions (e.g., extended stay discounts), and flexible cancellation policies. Target off-season travelers like remote workers or budget-conscious guests.
- Shoulder Seasons: Implement dynamic pricing that balances peak and low rates. Target weekend travelers or specific events. Offer slightly more flexible terms than peak season.
- Regularly analyze your own performance against these Miramar seasonality benchmarks and adjust your pricing and availability strategy accordingly.
Best Areas for Airbnb Investment in Miramar (2026)
Exploring the top neighborhoods for short-term rentals in Miramar? This section highlights key areas, outlining why they are attractive for hosts and guests, along with notable local attractions. Consider these locations based on your target guest profile and investment strategy.
| Neighborhood / Area | Why Host Here? (Target Guests & Appeal) | Key Attractions & Landmarks |
|---|---|---|
| Civic Center | Central hub close to hospitals, universities, and courthouses. Attracts medical professionals, students, and families visiting for various reasons. | Jackson Memorial Hospital, University of Miami, Miami-Dade County Courthouse, Civic Center Station, Lummus Park |
| Golden Glades | Major transportation hub connecting to various parts of Miami and Fort Lauderdale. Ideal for travelers seeking easy access to the region's attractions. | Golden Glades Interchange, Miami Gardens, Hard Rock Stadium, Oleta River State Park, Shopping plazas |
| Miramar Town Center | Modern shopping and entertainment center with a variety of dining and retail options. Convenient for visitors looking for amenities and local flair. | Shops at Miramar, AMC Miramar 18, Tuscany Restaurant, Miramar Cultural Center, Miramar Regional Park |
| Sunset Lakes | Family-friendly community with parks, lakes, and recreational activities. Great for longer stays and families visiting relatives in the area. | Sunset Lakes Community Park, Sunset Lakes Shopping Plaza, Family-friendly dining options, Lakeside walking trails |
| Hollywood Beach | Trendy beach destination known for its boardwalk, restaurants, and vibrant atmosphere. Perfect for tourists looking to enjoy the Florida sun and beach life. | Hollywood Beach Boardwalk, Hollywood Beach, Gulfstream Park Racing and Casino, Anna Kolb Nature Center, ArtsPark at Young Circle |
| Pembroke Pines | Adjacent to Miramar, offers suburban living with shopping and dining. Attracts families and business travelers looking for more affordable accommodations. | Pembroke Pines Mall, Flamingo Gardens, C.B. Smith Park, Shopping plazas, Dining establishments |
| North Perry Airport area | Close to the airport catering to travelers and aviation enthusiasts. Good for short stays or those in transit. | North Perry Airport, Local diners and cafes, Parks nearby, Convenient access to I-75 |
| Silver Lakes | A peaceful residential community with lakes and parks, ideal for families and long-term visitors looking for a quiet stay. | Silver Lakes Park, Shopping centers, Recreational activities, Family-friendly environment, Nearby schools |
Understanding Airbnb License Requirements & STR Laws in Miramar (2026)
While Miramar, Florida, United States currently shows low STR regulations, specific Airbnb license requirements might still exist or change. Always verify the latest short term rental regulations and Airbnb license requirements directly with local government authorities for Miramar to ensure full compliance before hosting.
(Source: AirROI data, 2026, based on 1% licensed listings)
Top Performing Airbnb Properties in Miramar (2026)
Benchmark your potential! Explore examples of top-performing Airbnb properties in Miramarbased on Trailing Twelve Month (TTM) revenue. Analyze their characteristics, revenue, occupancy rate, and ADR to understand what drives success in this market.
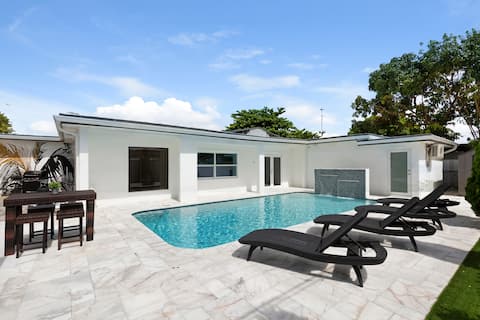
Modern 4.5 BR 3 Bath Dream House Heated Pool BBQ
Entire Place • 5 bedrooms
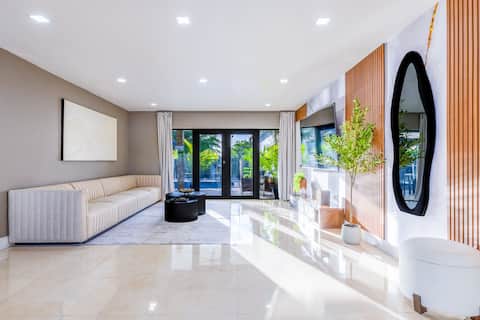
Majestic Lakeview Villa | Heated pool | kayak |BBQ
Entire Place • 3 bedrooms

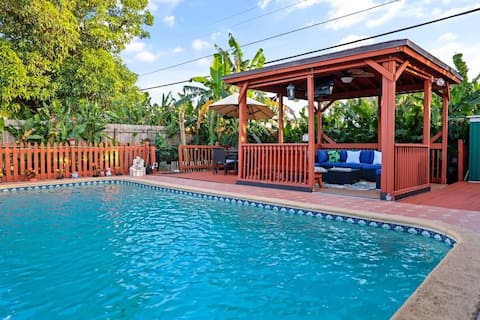
Modern Retreat w/ Heated Pool & Grill near Beach
Entire Place • 3 bedrooms

Blue Haven Vacations / Hot tub + Pool Table
Entire Place • 4 bedrooms
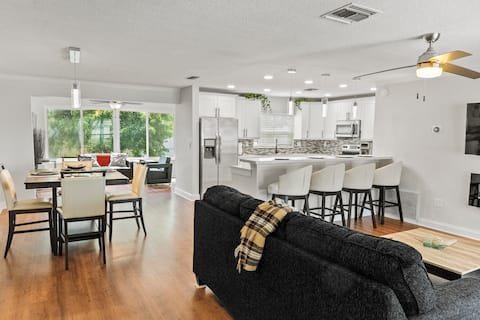
Relaxing Home With POOL
Entire Place • 3 bedrooms
Modern home, 3 bd, 2 ba, Hard Rock Stadium
Entire Place • 3 bedrooms
Note: Performance varies based on location, size, amenities, seasonality, and management quality. Data reflects the past 12 months.
Top Performing Airbnb Hosts in Miramar (2026)
Learn from the best! This table showcases top-performing Airbnb hosts in Miramar based on the number of properties managed and estimated total revenue over the past year. Analyze their scale and performance metrics.
| Host Name | Properties | Grossing Revenue | Stay Reviews | Avg Rating |
|---|---|---|---|---|
| Rodrigo And Julieth | 20 | $177,156 | 578 | 4.71/5.0 |
| Tim | 1 | $150,369 | 150 | 4.91/5.0 |
| Jessica And Javier | 1 | $127,147 | 78 | 4.92/5.0 |
| Modern Embassy LLC | 2 | $106,041 | 170 | 4.90/5.0 |
| Julian & Katalina | 4 | $91,625 | 151 | 4.88/5.0 |
| Steve | 1 | $69,856 | 43 | 4.79/5.0 |
| Kettelene | 1 | $69,597 | 45 | 4.89/5.0 |
| Jaye | 1 | $65,446 | 40 | 4.95/5.0 |
| Javin | 1 | $64,007 | 119 | 4.82/5.0 |
| Ronny | 1 | $62,311 | 40 | 4.73/5.0 |
Analyzing the strategies of top hosts, such as their property selection, pricing, and guest communication, can offer valuable lessons for optimizing your own Airbnb operations in Miramar.
Dive Deeper: Advanced Miramar STR Market Data (2026)
Ready to unlock more insights? AirROI provides access to advanced metrics and comprehensive Airbnb data for Miramar. Explore detailed analytics beyond this report to refine your investment strategy, optimize pricing, and maximize your vacation rental profits.
Explore Advanced MetricsMiramar Short-Term Rental Market Composition (2026): Property & Room Types
Room Type Distribution
Property Type Distribution
Market Composition Insights for Miramar
- The Miramar Airbnb market composition is heavily skewed towards Entire Home/Apt listings, which make up 66.4% of the 110 active rentals. This indicates strong guest preference for privacy and space.
- However, a notable 32.7% share for Private Rooms suggests opportunities for budget-conscious travelers or hosts renting out spare rooms.
- Looking at the property type distribution in Miramar, House properties are the most common (70.9%), reflecting the local real estate landscape.
- Houses represent a significant 70.9% portion, catering likely to families or larger groups.
- The presence of 6.4% Hotel/Boutique listings indicates integration with traditional hospitality.
- Smaller segments like outdoor/unique (combined 1.8%) offer potential for unique stay experiences.
Miramar Airbnb Room Capacity Analysis (2026): Bedroom Distribution
Distribution of Listings by Number of Bedrooms
Room Capacity Insights for Miramar
- The dominant room capacity in Miramar is 1 bedroom listings, making up 30.9% of the market. This suggests a strong demand for properties suitable for couples or solo travelers.
- Together, 1 bedroom and 3 bedrooms properties represent 50.0% of the active Airbnb listings in Miramar, indicating a high concentration in these sizes.
- A significant 28.2% of listings offer 3+ bedrooms, catering to larger groups and families seeking more space in Miramar.
Miramar Vacation Rental Guest Capacity Trends (2026)
Distribution of Listings by Guest Capacity
Guest Capacity Insights for Miramar
- The most common guest capacity trend in Miramar vacation rentals is listings accommodating 8+ guests (21.8%). This suggests the primary traveler segment is likely larger groups.
- Properties designed for 8+ guests and 2 guests dominate the Miramar STR market, accounting for 38.2% of listings.
- 31.8% of properties accommodate 6+ guests, serving the market segment for larger families or group travel in Miramar.
- On average, properties in Miramar are equipped to host 3.5 guests.
Miramar Airbnb Booking Patterns (2026): Available vs. Booked Days
Available Days Distribution
Booked Days Distribution
Booking Pattern Insights for Miramar
- The most common availability pattern in Miramar falls within the 271-366 days range, representing 40.9% of listings. This suggests many properties have significant open periods on their calendars.
- Approximately 72.7% of listings show high availability (181+ days open annually), indicating potential for increased bookings or specific owner usage patterns.
- For booked days, the 91-180 days range is most frequent in Miramar (33.6%), reflecting common guest stay durations or potential owner blocking patterns.
- A notable 27.2% of properties secure long booking periods (181+ days booked per year), highlighting successful long-term rental strategies or significant owner usage.
Miramar Airbnb Minimum Stay Requirements Analysis
Distribution of Listings by Minimum Night Requirement
1 Night
21 listings
19.1% of total
2 Nights
19 listings
17.3% of total
3 Nights
8 listings
7.3% of total
4-6 Nights
18 listings
16.4% of total
7-29 Nights
6 listings
5.5% of total
30+ Nights
38 listings
34.5% of total
Key Insights
- The most prevalent minimum stay requirement in Miramar is 30+ Nights, adopted by 34.5% of listings. This highlights the market's preference for longer commitments.
- A significant segment (34.5%) caters to monthly stays (30+ nights) in Miramar, pointing to opportunities in the extended-stay market.
Recommendations
- Align with the market by considering a 30+ Nights minimum stay, as 34.5% of Miramar hosts use this setting.
- If feasible, allowing 1-night stays, especially midweek or during low season, could capture last-minute bookings, as only 19.1% currently do.
- Explore offering discounts for stays of 30+ nights to attract the 34.5% of the market seeking extended stays.
- Adjust minimum nights based on seasonality – potentially shorter during low season and longer during peak demand periods in Miramar.
Miramar Airbnb Cancellation Policy Trends Analysis (2026)
Flexible
25 listings
23.1% of total
Moderate
27 listings
25% of total
Firm
27 listings
25% of total
Strict
29 listings
26.9% of total
Cancellation Policy Insights for Miramar
- The prevailing Airbnb cancellation policy trend in Miramar is Strict, used by 26.9% of listings.
- A majority (51.9%) of hosts in Miramar utilize Firm or Strict policies, indicating a market where hosts prioritize booking security.
Recommendations for Hosts
- Consider adopting a Strict policy to align with the 26.9% market standard in Miramar.
- Regularly review your cancellation policy against competitors and market demand shifts in Miramar.
Miramar STR Booking Lead Time Analysis (2026)
Average Booking Lead Time by Month
Booking Lead Time Insights for Miramar
- The overall average booking lead time for vacation rentals in Miramar is 29 days.
- Guests book furthest in advance for stays during July (average 48 days), likely coinciding with peak travel demand or local events.
- The shortest booking windows occur for stays in October (average 23 days), indicating more last-minute travel plans during this time.
- Seasonally, Spring (38 days avg.) sees the longest lead times, while Fall (25 days avg.) has the shortest, reflecting typical travel planning cycles.
Recommendations for Hosts
- Use the overall average lead time (29 days) as a baseline for your pricing and availability strategy in Miramar.
- For July stays, consider implementing length-of-stay discounts or slightly higher rates for bookings made less than 48 days out to capitalize on advance planning.
- Target marketing efforts for the Spring season well in advance (at least 38 days) to capture early planners.
- Monitor your own booking lead times against these Miramar averages to identify opportunities for dynamic pricing adjustments.
Popular & Essential Airbnb Amenities in Miramar (2026)
Amenity Prevalence
Amenity Insights for Miramar
- Essential amenities in Miramar that guests expect include: Wifi, TV, Air conditioning, Free parking on premises. Lacking these (any) could significantly impact bookings.
- Popular amenities like Kitchen, Microwave, Smoke alarm are common but not universal. Offering these can provide a competitive edge.
Recommendations for Hosts
- Ensure your listing includes all essential amenities for Miramar: Wifi, TV, Air conditioning, Free parking on premises.
- Prioritize adding missing essentials: Wifi, TV, Air conditioning, Free parking on premises.
- Consider adding popular differentiators like Kitchen or Microwave to increase appeal.
- Highlight unique or less common amenities you offer (e.g., hot tub, dedicated workspace, EV charger) in your listing description and photos.
- Regularly check competitor amenities in Miramar to stay competitive.
Miramar Airbnb Guest Demographics & Profile Analysis (2026)
Guest Profile Summary for Miramar
- The typical guest profile for Airbnb in Miramar consists of primarily domestic travelers (75%), often arriving from nearby Miami, typically belonging to the Post-2000s (Gen Z/Alpha) group (50%), primarily speaking English or Spanish.
- Domestic travelers account for 75.2% of guests.
- Key international markets include United States (75.2%) and Canada (3.6%).
- Top languages spoken are English (57.7%) followed by Spanish (23.7%).
- A significant demographic segment is the Post-2000s (Gen Z/Alpha) group, representing 50% of guests.
Recommendations for Hosts
- Target domestic marketing efforts towards travelers from Miami and New York.
- Tailor amenities and listing descriptions to appeal to the dominant Post-2000s (Gen Z/Alpha) demographic (e.g., highlight fast WiFi, smart home features, local guides).
- Highlight unique local experiences or amenities relevant to the primary guest profile.
- Consider seasonal promotions aligned with peak travel times for key origin markets.
Nearby Short-Term Rental Market Comparison
How does the Miramar Airbnb market stack up against its neighbors? Compare key performance metrics like average monthly revenue, ADR, and occupancy rates in surrounding areas to understand the broader regional STR landscape.
| Market | Active Properties | Monthly Revenue | Daily Rate | Avg. Occupancy |
|---|---|---|---|---|
| Stock Island | 107 | $9,731 | $733.54 | 47% |
| Bal Harbour Village | 37 | $8,846 | $850.63 | 34% |
| Key West | 1,137 | $7,525 | $630.09 | 47% |
| Lake Clarke Shores | 26 | $6,710 | $516.52 | 46% |
| Lighthouse Point | 75 | $6,205 | $472.94 | 51% |
| Pinecrest | 11 | $6,117 | $861.24 | 43% |
| North Bay Village | 120 | $6,032 | $561.12 | 44% |
| Duck Key | 60 | $5,308 | $504.94 | 43% |
| Little Torch Key | 20 | $5,131 | $701.83 | 29% |
| Tequesta | 43 | $4,920 | $376.96 | 50% |