Minneola Airbnb Market Analysis 2026: Short Term Rental Data & Vacation Rental Statistics in Florida, United States
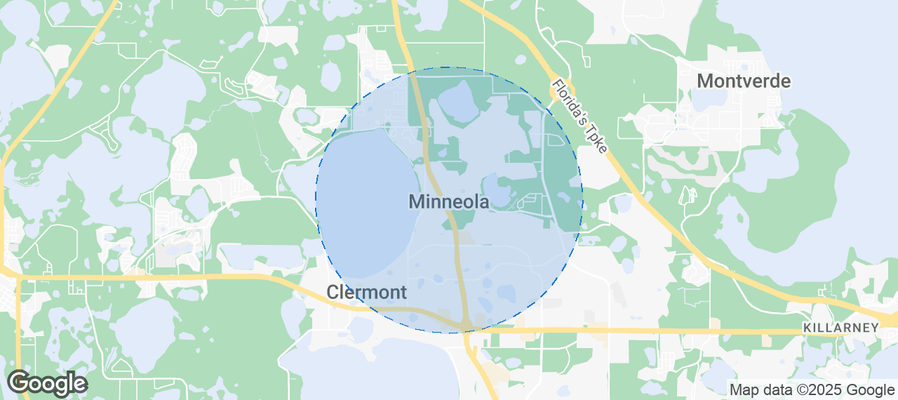
Is Airbnb profitable in Minneola in 2026? Explore comprehensive Airbnb analytics for Minneola, Florida, United States to uncover income potential. This 2026 STR market report for Minneola, based on AirROI data from February 2025 to January 2026, reveals key trends in the niche market of 19 active listings.
Whether you're considering an Airbnb investment in Minneola, optimizing your existing vacation rental, or exploring rental arbitrage opportunities, understanding the Minneola Airbnb data is crucial. Leveraging the low regulation environment is key to maximizing your short term rental income potential. Let's dive into the specifics.
Key Minneola Airbnb Performance Metrics Overview
Monthly Airbnb Revenue Variations & Income Potential in Minneola (2026)
Understanding the monthly revenue variations for Airbnb listings in Minneola is key to maximizing your short term rental income potential. Seasonality significantly impacts earnings. Our analysis, based on data from the past 12 months, shows that the peak revenue month for STRs in Minneola is typically March, while October often presents the lowest earnings, highlighting opportunities for strategic pricing adjustments during shoulder and low seasons. Explore the typical Airbnb income in Minneola across different performance tiers:
- Best-in-class properties (Top 10%) achieve $6,235+ monthly, often utilizing dynamic pricing and superior guest experiences.
- Strong performing properties (Top 25%) earn $4,341 or more, indicating effective management and desirable locations/amenities.
- Typical properties (Median) generate around $2,237 per month, representing the average market performance.
- Entry-level properties (Bottom 25%) see earnings around $1,137, often with potential for optimization.
Average Monthly Airbnb Earnings Trend in Minneola
Minneola Airbnb Occupancy Rate Trends (2026)
Maximize your bookings by understanding the Minneola STR occupancy trends. Seasonal demand shifts significantly influence how often properties are booked. Typically, Marchsees the highest demand (peak season occupancy), while October experiences the lowest (low season). Effective strategies, like adjusting minimum stays or offering promotions, can boost occupancy during slower periods. Here's how different property tiers perform in Minneola:
- Best-in-class properties (Top 10%) achieve 85%+ occupancy, indicating high desirability and potentially optimized availability.
- Strong performing properties (Top 25%) maintain 73% or higher occupancy, suggesting good market fit and guest satisfaction.
- Typical properties (Median) have an occupancy rate around 52%.
- Entry-level properties (Bottom 25%) average 27% occupancy, potentially facing higher vacancy.
Average Monthly Occupancy Rate Trend in Minneola
Average Daily Rate (ADR) Airbnb Trends in Minneola (2026)
Effective short term rental pricing strategy in Minneola involves understanding monthly ADR fluctuations. The Average Daily Rate (ADR) for Airbnb in Minneola typically peaks in January and dips lowest during April. Leveraging Airbnb dynamic pricing tools or strategies based on this seasonality can significantly boost revenue. Here's a look at the typical nightly rates achieved:
- Best-in-class properties (Top 10%) command rates of $274+ per night, often due to premium features or locations.
- Strong performing properties (Top 25%) achieve nightly rates of $222 or more.
- Typical properties (Median) charge around $170 per night.
- Entry-level properties (Bottom 25%) earn around $98 per night.
Average Daily Rate (ADR) Trend by Month in Minneola
Get Live Minneola Market Intelligence 👇
Explore Real-time Analytics
Airbnb Seasonality Analysis & Trends in Minneola (2026)
Peak Season (March, August, November)
- Revenue averages $3,353 per month
- Occupancy rates average 54.7%
- Daily rates average $177
Shoulder Season
- Revenue averages $2,831 per month
- Occupancy maintains around 50.1%
- Daily rates hold near $180
Low Season (April, September, October)
- Revenue drops to average $2,527 per month
- Occupancy decreases to average 45.4%
- Daily rates adjust to average $173
Seasonality Insights for Minneola
- The Airbnb seasonality in Minneola shows moderate seasonality with distinct peak and low periods. While the sections above show seasonal averages, it's also insightful to look at the extremes:
- During the high season, the absolute peak month showcases Minneola's highest earning potential, with monthly revenues capable of climbing to $3,757, occupancy reaching a high of 64.9%, and ADRs peaking at $200.
- Conversely, the slowest single month of the year, typically falling within the low season, marks the market's lowest point. In this month, revenue might dip to $2,487, occupancy could drop to 42.6%, and ADRs may adjust down to $160.
- Understanding both the seasonal averages and these monthly peaks and troughs in revenue, occupancy, and ADR is crucial for maximizing your Airbnb profit potential in Minneola.
Seasonal Strategies for Maximizing Profit
- Peak Season: Maximize revenue through premium pricing and potentially longer minimum stays. Ensure high availability.
- Low Season: Offer competitive pricing, special promotions (e.g., extended stay discounts), and flexible cancellation policies. Target off-season travelers like remote workers or budget-conscious guests.
- Shoulder Seasons: Implement dynamic pricing that balances peak and low rates. Target weekend travelers or specific events. Offer slightly more flexible terms than peak season.
- Regularly analyze your own performance against these Minneola seasonality benchmarks and adjust your pricing and availability strategy accordingly.
Best Areas for Airbnb Investment in Minneola (2026)
Exploring the top neighborhoods for short-term rentals in Minneola? This section highlights key areas, outlining why they are attractive for hosts and guests, along with notable local attractions. Consider these locations based on your target guest profile and investment strategy.
| Neighborhood / Area | Why Host Here? (Target Guests & Appeal) | Key Attractions & Landmarks |
|---|---|---|
| Minneola Hills | A tranquil and scenic area with beautiful hill views, perfect for families and nature lovers looking for a peaceful getaway close to Orlando. | Lake Minneola, Minneola Athletic Complex, Citrus Grove Park, Minneola Historical Museum, Hiking trails and scenic parks |
| Downtown Minneola | The vibrant heart of Minneola offers convenience, dining, and shopping options, making it a prime location for short-term renters looking for amenities. | Minneola City Hall, local cafes and restaurants, shopping centers, community events, Minneola Library |
| Waterfront Properties | Beautiful waterfront areas along Lake Minneola provide stunning views and recreational activities, appealing to those looking for a lakeside experience. | Lake Minneola, water sports, fishing spots, picnic areas, scenic views |
| Minneola Estates | A welcoming suburban community with family-friendly amenities and parks, ideal for families and longer term visitors. | Minneola Recreation Center, local parks, community activities, family-oriented events |
| Preserves and Parks | Rich in natural beauty with parks and natural reserves, attractive to eco-tourists and nature enthusiasts seeking a tranquil stay. | Minneola Trail, Hickory Point Recreation Area, nature reserves, outdoor activities |
| Nearby Clermont | Clermont is a well-known vacation destination with attractions and entertainment, making it a great option for visitors to Minneola. | Clermont Waterfront Park, Citrus Tower, Lakeside Park, historical sites, entertainment options |
| The Villages (close proximity) | A popular retirement community that draws many visitors looking for short-term stays, providing a diverse range of amenities and activities. | The Villages squares, golf courses, community events, retail shops, dining options |
| Central Florida Attractions Access | Proximity to major Central Florida attractions, including theme parks and recreational sites, appealing to tourists and families. | Walt Disney World, Universal Studios, SeaWorld, Lake Louisa State Park, Orlando attractions |
Understanding Airbnb License Requirements & STR Laws in Minneola (2026)
While Minneola, Florida, United States currently shows low STR regulations, specific Airbnb license requirements might still exist or change. Always verify the latest short term rental regulations and Airbnb license requirements directly with local government authorities for Minneola to ensure full compliance before hosting.
(Source: AirROI data, 2026, finding no licensed listings among those analyzed)
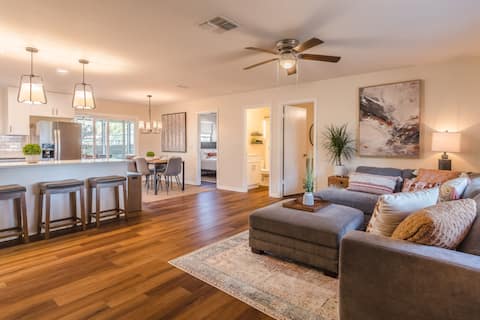
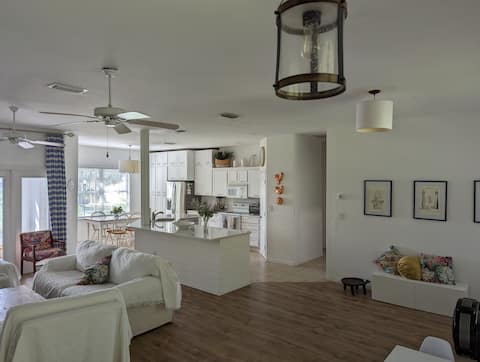
Top Performing Airbnb Properties in Minneola (2026)
Benchmark your potential! Explore examples of top-performing Airbnb properties in Minneolabased on Trailing Twelve Month (TTM) revenue. Analyze their characteristics, revenue, occupancy rate, and ADR to understand what drives success in this market.
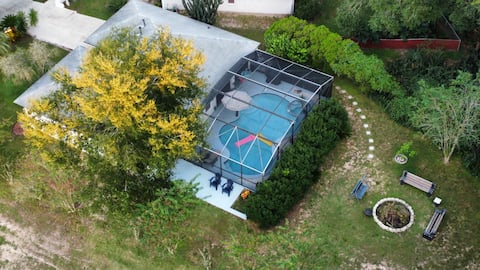
Pool + Heated spa Family friendly King suite Oasis
Entire Place • 3 bedrooms
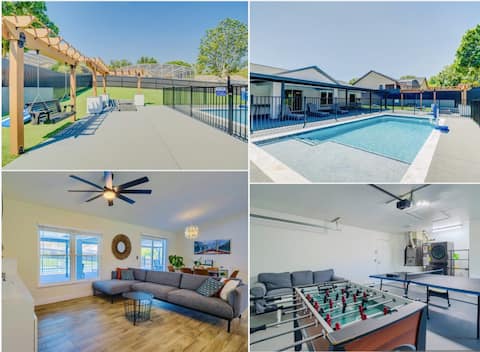
New! Resort Style Oasis ~ Heated Pool & Game Room
Entire Place • 3 bedrooms
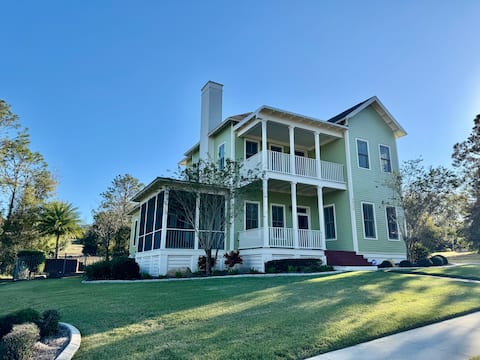
Sugarloaf Mountain Ranch House
Entire Place • 4 bedrooms
Modern Villa in Minneola near Disney, Orlando
Entire Place • 3 bedrooms
Lakeview - Families & Athletes Welcome!
Entire Place • 3 bedrooms
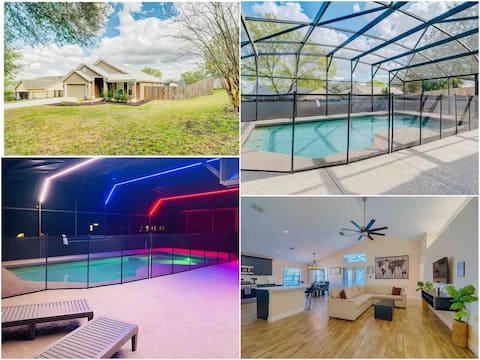
Spacious Getaway ~ Heated LED Pool & Ping Pong
Entire Place • 3 bedrooms
Note: Performance varies based on location, size, amenities, seasonality, and management quality. Data reflects the past 12 months.
Top Performing Airbnb Hosts in Minneola (2026)
Learn from the best! This table showcases top-performing Airbnb hosts in Minneola based on the number of properties managed and estimated total revenue over the past year. Analyze their scale and performance metrics.
| Host Name | Properties | Grossing Revenue | Stay Reviews | Avg Rating |
|---|---|---|---|---|
| Carlos | 2 | $107,302 | 246 | 4.99/5.0 |
| Sheena | 2 | $82,251 | 356 | 4.95/5.0 |
| Adrea And Justin | 1 | $73,396 | 152 | 4.98/5.0 |
| Wesley | 1 | $67,171 | 15 | 5.00/5.0 |
| Craig And Debbie | 2 | $61,011 | 170 | 4.97/5.0 |
| Denise | 1 | $50,070 | 76 | 4.91/5.0 |
| Sam | 2 | $43,094 | 61 | 4.93/5.0 |
| Corey | 1 | $24,009 | 138 | 4.96/5.0 |
| Wendy | 1 | $20,545 | 99 | 4.94/5.0 |
| Amara | 1 | $12,628 | 65 | 4.49/5.0 |
Analyzing the strategies of top hosts, such as their property selection, pricing, and guest communication, can offer valuable lessons for optimizing your own Airbnb operations in Minneola.
Dive Deeper: Advanced Minneola STR Market Data (2026)
Ready to unlock more insights? AirROI provides access to advanced metrics and comprehensive Airbnb data for Minneola. Explore detailed analytics beyond this report to refine your investment strategy, optimize pricing, and maximize your vacation rental profits.
Explore Advanced MetricsMinneola Short-Term Rental Market Composition (2026): Property & Room Types
Room Type Distribution
Property Type Distribution
Market Composition Insights for Minneola
- The Minneola Airbnb market composition is heavily skewed towards Entire Home/Apt listings, which make up 84.2% of the 19 active rentals. This indicates strong guest preference for privacy and space.
- Looking at the property type distribution in Minneola, House properties are the most common (84.2%), reflecting the local real estate landscape.
- Houses represent a significant 84.2% portion, catering likely to families or larger groups.
Minneola Airbnb Room Capacity Analysis (2026): Bedroom Distribution
Distribution of Listings by Number of Bedrooms
Room Capacity Insights for Minneola
- The dominant room capacity in Minneola is 3 bedrooms listings, making up 36.8% of the market. This suggests a strong demand for properties suitable for families or small groups.
- Together, 3 bedrooms and 2 bedrooms properties represent 57.9% of the active Airbnb listings in Minneola, indicating a high concentration in these sizes.
- A significant 52.6% of listings offer 3+ bedrooms, catering to larger groups and families seeking more space in Minneola.
Minneola Vacation Rental Guest Capacity Trends (2026)
Distribution of Listings by Guest Capacity
Guest Capacity Insights for Minneola
- The most common guest capacity trend in Minneola vacation rentals is listings accommodating 6 guests (36.8%). This suggests the primary traveler segment is likely larger groups.
- Properties designed for 6 guests and 8+ guests dominate the Minneola STR market, accounting for 57.9% of listings.
- 63.2% of properties accommodate 6+ guests, serving the market segment for larger families or group travel in Minneola.
- On average, properties in Minneola are equipped to host 4.9 guests.
Minneola Airbnb Booking Patterns (2026): Available vs. Booked Days
Available Days Distribution
Booked Days Distribution
Booking Pattern Insights for Minneola
- The most common availability pattern in Minneola falls within the 181-270 days range, representing 42.1% of listings. This suggests many properties have significant open periods on their calendars.
- Approximately 63.2% of listings show high availability (181+ days open annually), indicating potential for increased bookings or specific owner usage patterns.
- For booked days, the 91-180 days range is most frequent in Minneola (36.8%), reflecting common guest stay durations or potential owner blocking patterns.
- A notable 42.1% of properties secure long booking periods (181+ days booked per year), highlighting successful long-term rental strategies or significant owner usage.
Minneola Airbnb Minimum Stay Requirements Analysis
Distribution of Listings by Minimum Night Requirement
1 Night
4 listings
21.1% of total
2 Nights
6 listings
31.6% of total
3 Nights
2 listings
10.5% of total
4-6 Nights
1 listings
5.3% of total
30+ Nights
6 listings
31.6% of total
Key Insights
- The most prevalent minimum stay requirement in Minneola is 2 Nights, adopted by 31.6% of listings. This highlights the market's preference for shorter, flexible bookings.
- A significant segment (31.6%) caters to monthly stays (30+ nights) in Minneola, pointing to opportunities in the extended-stay market.
Recommendations
- Align with the market by considering a 2 Nights minimum stay, as 31.6% of Minneola hosts use this setting.
- If feasible, allowing 1-night stays, especially midweek or during low season, could capture last-minute bookings, as only 21.1% currently do.
- Explore offering discounts for stays of 30+ nights to attract the 31.6% of the market seeking extended stays.
- Adjust minimum nights based on seasonality – potentially shorter during low season and longer during peak demand periods in Minneola.
Minneola Airbnb Cancellation Policy Trends Analysis (2026)
Limited
2 listings
10.5% of total
Super Strict 30 Days
2 listings
10.5% of total
Flexible
2 listings
10.5% of total
Moderate
3 listings
15.8% of total
Firm
8 listings
42.1% of total
Strict
2 listings
10.5% of total
Cancellation Policy Insights for Minneola
- The prevailing Airbnb cancellation policy trend in Minneola is Firm, used by 42.1% of listings.
- A majority (52.6%) of hosts in Minneola utilize Firm or Strict policies, indicating a market where hosts prioritize booking security.
Recommendations for Hosts
- Consider adopting a Firm policy to align with the 42.1% market standard in Minneola.
- Using a Strict policy might deter some guests, as only 10.5% of listings use it. Evaluate if potential revenue protection outweighs possible lower booking rates.
- Regularly review your cancellation policy against competitors and market demand shifts in Minneola.
Minneola STR Booking Lead Time Analysis (2026)
Average Booking Lead Time by Month
Booking Lead Time Insights for Minneola
- The overall average booking lead time for vacation rentals in Minneola is 46 days.
- Guests book furthest in advance for stays during January (average 95 days), likely coinciding with peak travel demand or local events.
- The shortest booking windows occur for stays in June (average 27 days), indicating more last-minute travel plans during this time.
- Seasonally, Winter (69 days avg.) sees the longest lead times, while Summer (30 days avg.) has the shortest, reflecting typical travel planning cycles.
Recommendations for Hosts
- Use the overall average lead time (46 days) as a baseline for your pricing and availability strategy in Minneola.
- For January stays, consider implementing length-of-stay discounts or slightly higher rates for bookings made less than 95 days out to capitalize on advance planning.
- Target marketing efforts for the Winter season well in advance (at least 69 days) to capture early planners.
- Monitor your own booking lead times against these Minneola averages to identify opportunities for dynamic pricing adjustments.
Popular & Essential Airbnb Amenities in Minneola (2026)
Amenity Prevalence
Amenity Insights for Minneola
- Essential amenities in Minneola that guests expect include: Smoke alarm, Hot water, Hangers, Air conditioning, Free parking on premises, Microwave, Wifi, Essentials. Lacking these (any) could significantly impact bookings.
- Popular amenities like Bed linens, Dishes and silverware are common but not universal. Offering these can provide a competitive edge.
Recommendations for Hosts
- Ensure your listing includes all essential amenities for Minneola: Smoke alarm, Hot water, Hangers, Air conditioning, Free parking on premises, Microwave, Wifi, Essentials.
- Consider adding popular differentiators like Bed linens or Dishes and silverware to increase appeal.
- Highlight unique or less common amenities you offer (e.g., hot tub, dedicated workspace, EV charger) in your listing description and photos.
- Regularly check competitor amenities in Minneola to stay competitive.
Minneola Airbnb Guest Demographics & Profile Analysis (2026)
Guest Profile Summary for Minneola
- The typical guest profile for Airbnb in Minneola consists of primarily domestic travelers (93%), often arriving from nearby Miami, typically belonging to the Post-2000s (Gen Z/Alpha) group (50%), primarily speaking English or Spanish.
- Domestic travelers account for 93.1% of guests.
- Key international markets include United States (93.1%) and Canada (2.3%).
- Top languages spoken are English (71%) followed by Spanish (18.7%).
- A significant demographic segment is the Post-2000s (Gen Z/Alpha) group, representing 50% of guests.
Recommendations for Hosts
- Target domestic marketing efforts towards travelers from Miami and Tampa.
- Tailor amenities and listing descriptions to appeal to the dominant Post-2000s (Gen Z/Alpha) demographic (e.g., highlight fast WiFi, smart home features, local guides).
- Highlight unique local experiences or amenities relevant to the primary guest profile.
- Consider seasonal promotions aligned with peak travel times for key origin markets.
Nearby Short-Term Rental Market Comparison
How does the Minneola Airbnb market stack up against its neighbors? Compare key performance metrics like average monthly revenue, ADR, and occupancy rates in surrounding areas to understand the broader regional STR landscape.
| Market | Active Properties | Monthly Revenue | Daily Rate | Avg. Occupancy |
|---|---|---|---|---|
| Sailfish Point | 19 | $16,709 | $1587.63 | 48% |
| Anna Maria island | 587 | $7,996 | $823.96 | 41% |
| Anna Maria | 56 | $6,434 | $692.96 | 52% |
| Reunion | 12 | $6,321 | $580.45 | 44% |
| Vilano Beach | 173 | $5,571 | $442.95 | 45% |
| Indian Rocks Beach | 842 | $5,560 | $419.63 | 49% |
| Melbourne Beach | 275 | $5,384 | $488.83 | 43% |
| Siesta Key | 1,175 | $5,206 | $518.91 | 42% |
| Belleair Beach | 94 | $5,086 | $339.65 | 53% |
| Bradenton Beach | 122 | $4,977 | $507.12 | 42% |