Middleburg Airbnb Market Analysis 2026: Short Term Rental Data & Vacation Rental Statistics in Florida, United States
Is Airbnb profitable in Middleburg in 2026? Explore comprehensive Airbnb analytics for Middleburg, Florida, United States to uncover income potential. This 2026 STR market report for Middleburg, based on AirROI data from February 2025 to January 2026, reveals key trends in the niche market of 39 active listings.
Whether you're considering an Airbnb investment in Middleburg, optimizing your existing vacation rental, or exploring rental arbitrage opportunities, understanding the Middleburg Airbnb data is crucial. Leveraging the low regulation environment is key to maximizing your short term rental income potential. Let's dive into the specifics.
Key Middleburg Airbnb Performance Metrics Overview
Monthly Airbnb Revenue Variations & Income Potential in Middleburg (2026)
Understanding the monthly revenue variations for Airbnb listings in Middleburg is key to maximizing your short term rental income potential. Seasonality significantly impacts earnings. Our analysis, based on data from the past 12 months, shows that the peak revenue month for STRs in Middleburg is typically March, while August often presents the lowest earnings, highlighting opportunities for strategic pricing adjustments during shoulder and low seasons. Explore the typical Airbnb income in Middleburg across different performance tiers:
- Best-in-class properties (Top 10%) achieve $4,837+ monthly, often utilizing dynamic pricing and superior guest experiences.
- Strong performing properties (Top 25%) earn $3,222 or more, indicating effective management and desirable locations/amenities.
- Typical properties (Median) generate around $1,857 per month, representing the average market performance.
- Entry-level properties (Bottom 25%) see earnings around $902, often with potential for optimization.
Average Monthly Airbnb Earnings Trend in Middleburg
Middleburg Airbnb Occupancy Rate Trends (2026)
Maximize your bookings by understanding the Middleburg STR occupancy trends. Seasonal demand shifts significantly influence how often properties are booked. Typically, Marchsees the highest demand (peak season occupancy), while August experiences the lowest (low season). Effective strategies, like adjusting minimum stays or offering promotions, can boost occupancy during slower periods. Here's how different property tiers perform in Middleburg:
- Best-in-class properties (Top 10%) achieve 75%+ occupancy, indicating high desirability and potentially optimized availability.
- Strong performing properties (Top 25%) maintain 53% or higher occupancy, suggesting good market fit and guest satisfaction.
- Typical properties (Median) have an occupancy rate around 37%.
- Entry-level properties (Bottom 25%) average 20% occupancy, potentially facing higher vacancy.
Average Monthly Occupancy Rate Trend in Middleburg
Average Daily Rate (ADR) Airbnb Trends in Middleburg (2026)
Effective short term rental pricing strategy in Middleburg involves understanding monthly ADR fluctuations. The Average Daily Rate (ADR) for Airbnb in Middleburg typically peaks in December and dips lowest during February. Leveraging Airbnb dynamic pricing tools or strategies based on this seasonality can significantly boost revenue. Here's a look at the typical nightly rates achieved:
- Best-in-class properties (Top 10%) command rates of $311+ per night, often due to premium features or locations.
- Strong performing properties (Top 25%) achieve nightly rates of $239 or more.
- Typical properties (Median) charge around $156 per night.
- Entry-level properties (Bottom 25%) earn around $102 per night.
Average Daily Rate (ADR) Trend by Month in Middleburg
Get Live Middleburg Market Intelligence 👇

Explore Real-time Analytics
Airbnb Seasonality Analysis & Trends in Middleburg (2026)
Peak Season (March, July, November)
- Revenue averages $2,682 per month
- Occupancy rates average 44.4%
- Daily rates average $173
Shoulder Season
- Revenue averages $2,322 per month
- Occupancy maintains around 40.3%
- Daily rates hold near $171
Low Season (January, August, September)
- Revenue drops to average $1,870 per month
- Occupancy decreases to average 32.5%
- Daily rates adjust to average $180
Seasonality Insights for Middleburg
- The Airbnb seasonality in Middleburg shows moderate seasonality with distinct peak and low periods. While the sections above show seasonal averages, it's also insightful to look at the extremes:
- During the high season, the absolute peak month showcases Middleburg's highest earning potential, with monthly revenues capable of climbing to $2,924, occupancy reaching a high of 52.0%, and ADRs peaking at $198.
- Conversely, the slowest single month of the year, typically falling within the low season, marks the market's lowest point. In this month, revenue might dip to $1,743, occupancy could drop to 31.4%, and ADRs may adjust down to $153.
- Understanding both the seasonal averages and these monthly peaks and troughs in revenue, occupancy, and ADR is crucial for maximizing your Airbnb profit potential in Middleburg.
Seasonal Strategies for Maximizing Profit
- Peak Season: Maximize revenue through premium pricing and potentially longer minimum stays. Ensure high availability.
- Low Season: Offer competitive pricing, special promotions (e.g., extended stay discounts), and flexible cancellation policies. Target off-season travelers like remote workers or budget-conscious guests.
- Shoulder Seasons: Implement dynamic pricing that balances peak and low rates. Target weekend travelers or specific events. Offer slightly more flexible terms than peak season.
- Regularly analyze your own performance against these Middleburg seasonality benchmarks and adjust your pricing and availability strategy accordingly.
Best Areas for Airbnb Investment in Middleburg (2026)
Exploring the top neighborhoods for short-term rentals in Middleburg? This section highlights key areas, outlining why they are attractive for hosts and guests, along with notable local attractions. Consider these locations based on your target guest profile and investment strategy.
| Neighborhood / Area | Why Host Here? (Target Guests & Appeal) | Key Attractions & Landmarks |
|---|---|---|
| Middleburg Lake | Scenic views and outdoor activities make Middleburg Lake a sought-after destination for families and nature lovers. The tranquil lake allows for fishing, kayaking, and relaxation away from the city bustle. | Middleburg Lake, Horseback Riding Trails, Nature Parks, Fishing Areas, Local Farms |
| Black Creek | A picturesque area along the creek, ideal for those looking to escape the urban environment. It's popular for fishing, canoeing, and enjoying the serene surroundings. | Black Creek, Canoe Rentals, Fishing Spots, Nature Trails, Parks |
| Clay County Fairgrounds | Hosting various events and fairs throughout the year, this location attracts visitors and locals alike. Ideal for short-term stays during event seasons. | Clay County Agricultural Fair, Events and Festivals, Local Market Days, Concerts |
| Cedar Creek | Known for its peaceful environment, Cedar Creek attracts families and individuals looking for a relaxing place to stay with easy access to nature trails and outdoor activities. | Cedar Creek, Hiking Trails, Wildlife Watching, Local Parks |
| Middleburg Historic District | Rich in history, this charming district features several landmarks and is close to local eateries and boutiques, appealing to travelers who appreciate culture. | Historic Landmarks, Local Cafes, Boutiques, Community Events |
| Eagle Harbor | A suburban area with family-friendly neighborhoods, perfect for longer stays. Proximity to schools and parks makes it appealing for families. | Eagle Harbor Golf Club, Playgrounds, Family Parks, Community Centers |
| Brannan Field | A quieter area that offers a rural feel while still being accessible to the city, making it great for visitors looking for an escape without being too far away from urban amenities. | Brannan Field Park, Quiet Streets, Nature Trails, Local Wildlife |
| Camp Blanding | This military installation draws visitors for training and events, making accommodations nearby valuable for military families and associated personnel. | Military Exhibitions, Training Events, Historical Significance |
Understanding Airbnb License Requirements & STR Laws in Middleburg (2026)
While Middleburg, Florida, United States currently shows low STR regulations, specific Airbnb license requirements might still exist or change. Always verify the latest short term rental regulations and Airbnb license requirements directly with local government authorities for Middleburg to ensure full compliance before hosting.
(Source: AirROI data, 2026, finding no licensed listings among those analyzed)
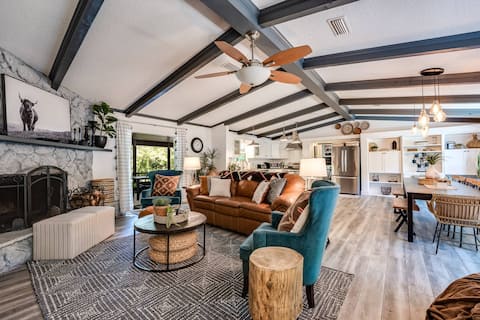
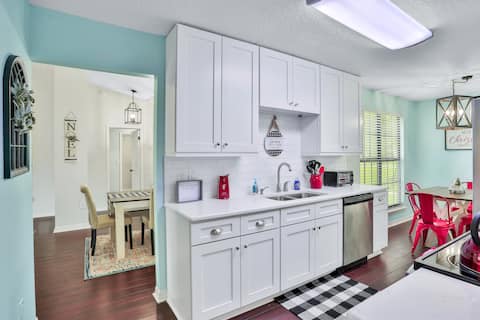
Top Performing Airbnb Properties in Middleburg (2026)
Benchmark your potential! Explore examples of top-performing Airbnb properties in Middleburgbased on Trailing Twelve Month (TTM) revenue. Analyze their characteristics, revenue, occupancy rate, and ADR to understand what drives success in this market.
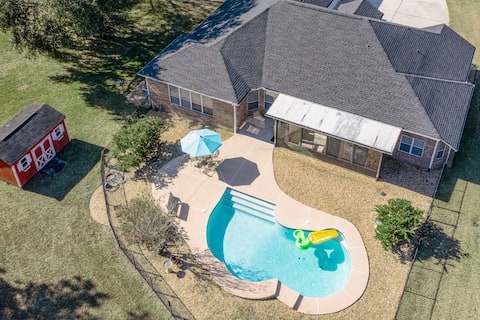
Private Pool |King Suite |Screened Patio |Dogs Ok
Entire Place • 3 bedrooms

Picturesque Middleburg Creek-View Vacation Home!
Entire Place • 2 bedrooms
Amazing Home on Black Creek, Hot Tub, Fire Pit
Entire Place • 4 bedrooms

The Lazy Cow Yurt w/ Fluffy Cows, Sheep & Llamas!
Entire Place • 1 bedroom
Modern E. Orange Park Home 6 bed Fence Beach 45Mn
Entire Place • 3 bedrooms

~Homey 3/2_near Fleming Island
Entire Place • 3 bedrooms
Note: Performance varies based on location, size, amenities, seasonality, and management quality. Data reflects the past 12 months.
Top Performing Airbnb Hosts in Middleburg (2026)
Learn from the best! This table showcases top-performing Airbnb hosts in Middleburg based on the number of properties managed and estimated total revenue over the past year. Analyze their scale and performance metrics.
| Host Name | Properties | Grossing Revenue | Stay Reviews | Avg Rating |
|---|---|---|---|---|
| ITrip Florida First Coast | 8 | $210,381 | 148 | 4.89/5.0 |
| Christopher | 2 | $79,545 | 247 | 4.95/5.0 |
| Hannah | 2 | $60,820 | 69 | 4.71/5.0 |
| Missy And Scott | 5 | $55,185 | 456 | 4.92/5.0 |
| Konti | 1 | $45,509 | 61 | 4.95/5.0 |
| John & Andrea | 1 | $40,069 | 24 | 4.92/5.0 |
| Theresa | 1 | $34,326 | 229 | 4.97/5.0 |
| Charles | 2 | $32,561 | 50 | 4.80/5.0 |
| Irene | 1 | $30,939 | 41 | 4.93/5.0 |
| Tracy | 1 | $30,878 | 260 | 4.89/5.0 |
Analyzing the strategies of top hosts, such as their property selection, pricing, and guest communication, can offer valuable lessons for optimizing your own Airbnb operations in Middleburg.
Dive Deeper: Advanced Middleburg STR Market Data (2026)
Ready to unlock more insights? AirROI provides access to advanced metrics and comprehensive Airbnb data for Middleburg. Explore detailed analytics beyond this report to refine your investment strategy, optimize pricing, and maximize your vacation rental profits.
Explore Advanced MetricsMiddleburg Short-Term Rental Market Composition (2026): Property & Room Types
Room Type Distribution
Property Type Distribution
Market Composition Insights for Middleburg
- The Middleburg Airbnb market composition is heavily skewed towards Entire Home/Apt listings, which make up 94.9% of the 39 active rentals. This indicates strong guest preference for privacy and space.
- Looking at the property type distribution in Middleburg, House properties are the most common (53.8%), reflecting the local real estate landscape.
- Houses represent a significant 53.8% portion, catering likely to families or larger groups.
- Smaller segments like others, hotel/boutique (combined 5.2%) offer potential for unique stay experiences.
Middleburg Airbnb Room Capacity Analysis (2026): Bedroom Distribution
Distribution of Listings by Number of Bedrooms
Room Capacity Insights for Middleburg
- The dominant room capacity in Middleburg is 1 bedroom listings, making up 46.2% of the market. This suggests a strong demand for properties suitable for couples or solo travelers.
- Together, 1 bedroom and 3 bedrooms properties represent 71.8% of the active Airbnb listings in Middleburg, indicating a high concentration in these sizes.
- A significant 38.4% of listings offer 3+ bedrooms, catering to larger groups and families seeking more space in Middleburg.
Middleburg Vacation Rental Guest Capacity Trends (2026)
Distribution of Listings by Guest Capacity
Guest Capacity Insights for Middleburg
- The most common guest capacity trend in Middleburg vacation rentals is listings accommodating 2 guests (33.3%). This suggests the primary traveler segment is likely couples or solo travelers.
- Properties designed for 2 guests and 8+ guests dominate the Middleburg STR market, accounting for 58.9% of listings.
- 46.1% of properties accommodate 6+ guests, serving the market segment for larger families or group travel in Middleburg.
- On average, properties in Middleburg are equipped to host 4.7 guests.
Middleburg Airbnb Booking Patterns (2026): Available vs. Booked Days
Available Days Distribution
Booked Days Distribution
Booking Pattern Insights for Middleburg
- The most common availability pattern in Middleburg falls within the 271-366 days range, representing 48.7% of listings. This suggests many properties have significant open periods on their calendars.
- Approximately 92.3% of listings show high availability (181+ days open annually), indicating potential for increased bookings or specific owner usage patterns.
- For booked days, the 91-180 days range is most frequent in Middleburg (41%), reflecting common guest stay durations or potential owner blocking patterns.
- A notable 12.8% of properties secure long booking periods (181+ days booked per year), highlighting successful long-term rental strategies or significant owner usage.
Middleburg Airbnb Minimum Stay Requirements Analysis
Distribution of Listings by Minimum Night Requirement
1 Night
13 listings
33.3% of total
2 Nights
15 listings
38.5% of total
3 Nights
5 listings
12.8% of total
7-29 Nights
1 listings
2.6% of total
30+ Nights
5 listings
12.8% of total
Key Insights
- The most prevalent minimum stay requirement in Middleburg is 2 Nights, adopted by 38.5% of listings. This highlights the market's preference for shorter, flexible bookings.
- A strong majority (71.8%) of the Middleburg Airbnb data shows acceptance of very short stays (1-2 nights), indicating a dynamic, high-turnover market.
- A significant segment (12.8%) caters to monthly stays (30+ nights) in Middleburg, pointing to opportunities in the extended-stay market.
Recommendations
- Align with the market by considering a 2 Nights minimum stay, as 38.5% of Middleburg hosts use this setting.
- Explore offering discounts for stays of 30+ nights to attract the 12.8% of the market seeking extended stays.
- Adjust minimum nights based on seasonality – potentially shorter during low season and longer during peak demand periods in Middleburg.
Middleburg Airbnb Cancellation Policy Trends Analysis (2026)
Limited
1 listings
2.6% of total
Flexible
14 listings
35.9% of total
Moderate
11 listings
28.2% of total
Firm
13 listings
33.3% of total
Cancellation Policy Insights for Middleburg
- The prevailing Airbnb cancellation policy trend in Middleburg is Flexible, used by 35.9% of listings.
- There's a relatively balanced mix between guest-friendly (64.1%) and stricter (33.3%) policies, offering choices for different guest needs.
Recommendations for Hosts
- Consider adopting a Flexible policy to align with the 35.9% market standard in Middleburg.
- Regularly review your cancellation policy against competitors and market demand shifts in Middleburg.
Middleburg STR Booking Lead Time Analysis (2026)
Average Booking Lead Time by Month
Booking Lead Time Insights for Middleburg
- The overall average booking lead time for vacation rentals in Middleburg is 25 days.
- Guests book furthest in advance for stays during November (average 50 days), likely coinciding with peak travel demand or local events.
- The shortest booking windows occur for stays in July (average 13 days), indicating more last-minute travel plans during this time.
- Seasonally, Fall (34 days avg.) sees the longest lead times, while Summer (17 days avg.) has the shortest, reflecting typical travel planning cycles.
Recommendations for Hosts
- Use the overall average lead time (25 days) as a baseline for your pricing and availability strategy in Middleburg.
- For November stays, consider implementing length-of-stay discounts or slightly higher rates for bookings made less than 50 days out to capitalize on advance planning.
- During July, focus on last-minute booking availability and promotions, as guests book with very short notice (13 days avg.).
- Target marketing efforts for the Fall season well in advance (at least 34 days) to capture early planners.
- Monitor your own booking lead times against these Middleburg averages to identify opportunities for dynamic pricing adjustments.
Popular & Essential Airbnb Amenities in Middleburg (2026)
Amenity Prevalence
Amenity Insights for Middleburg
- Essential amenities in Middleburg that guests expect include: Free parking on premises, Air conditioning. Lacking these (any) could significantly impact bookings.
- Popular amenities like Wifi, Coffee maker, TV are common but not universal. Offering these can provide a competitive edge.
- Warning: Wifi is not universally provided but is considered essential globally. Ensure reliable Wifi is offered.
Recommendations for Hosts
- Ensure your listing includes all essential amenities for Middleburg: Free parking on premises, Air conditioning.
- Consider adding popular differentiators like Wifi or Coffee maker to increase appeal.
- Highlight unique or less common amenities you offer (e.g., hot tub, dedicated workspace, EV charger) in your listing description and photos.
- Regularly check competitor amenities in Middleburg to stay competitive.
Middleburg Airbnb Guest Demographics & Profile Analysis (2026)
Guest Profile Summary for Middleburg
- The typical guest profile for Airbnb in Middleburg consists of primarily domestic travelers (97%), often arriving from nearby Jacksonville, typically belonging to the Post-2000s (Gen Z/Alpha) group (50%), primarily speaking English or Spanish.
- Domestic travelers account for 96.8% of guests.
- Key international markets include United States (96.8%) and Philippines (0.7%).
- Top languages spoken are English (73.6%) followed by Spanish (14.4%).
- A significant demographic segment is the Post-2000s (Gen Z/Alpha) group, representing 50% of guests.
Recommendations for Hosts
- Target domestic marketing efforts towards travelers from Jacksonville and Orlando.
- Tailor amenities and listing descriptions to appeal to the dominant Post-2000s (Gen Z/Alpha) demographic (e.g., highlight fast WiFi, smart home features, local guides).
- Highlight unique local experiences or amenities relevant to the primary guest profile.
- Consider seasonal promotions aligned with peak travel times for key origin markets.
Nearby Short-Term Rental Market Comparison
How does the Middleburg Airbnb market stack up against its neighbors? Compare key performance metrics like average monthly revenue, ADR, and occupancy rates in surrounding areas to understand the broader regional STR landscape.
| Market | Active Properties | Monthly Revenue | Daily Rate | Avg. Occupancy |
|---|---|---|---|---|
| St. Johns County | 12 | $6,964 | $592.43 | 47% |
| Ponte Vedra Beach | 224 | $5,720 | $574.75 | 43% |
| Vilano Beach | 173 | $5,571 | $442.95 | 45% |
| St. Simons | 91 | $4,162 | $379.84 | 42% |
| Jacksonville Beach | 763 | $4,123 | $328.32 | 49% |
| Saint Augustine | 1,749 | $3,586 | $287.24 | 46% |
| Montgomery | 11 | $3,557 | $246.45 | 54% |
| Saint Simons | 902 | $3,532 | $375.60 | 38% |
| Isle of Hope | 32 | $3,502 | $271.42 | 46% |
| Hammock Beach | 197 | $3,498 | $441.99 | 39% |