Miami Lakes Airbnb Market Analysis 2026: Short Term Rental Data & Vacation Rental Statistics in Florida, United States
Is Airbnb profitable in Miami Lakes in 2026? Explore comprehensive Airbnb analytics for Miami Lakes, Florida, United States to uncover income potential. This 2026 STR market report for Miami Lakes, based on AirROI data from February 2025 to January 2026, reveals key trends in the niche market of 21 active listings.
Whether you're considering an Airbnb investment in Miami Lakes, optimizing your existing vacation rental, or exploring rental arbitrage opportunities, understanding the Miami Lakes Airbnb data is crucial. Leveraging the low regulation environment is key to maximizing your short term rental income potential. Let's dive into the specifics.
Key Miami Lakes Airbnb Performance Metrics Overview
Monthly Airbnb Revenue Variations & Income Potential in Miami Lakes (2026)
Understanding the monthly revenue variations for Airbnb listings in Miami Lakes is key to maximizing your short term rental income potential. Seasonality significantly impacts earnings. Our analysis, based on data from the past 12 months, shows that the peak revenue month for STRs in Miami Lakes is typically March, while November often presents the lowest earnings, highlighting opportunities for strategic pricing adjustments during shoulder and low seasons. Explore the typical Airbnb income in Miami Lakes across different performance tiers:
- Best-in-class properties (Top 10%) achieve $12,413+ monthly, often utilizing dynamic pricing and superior guest experiences.
- Strong performing properties (Top 25%) earn $6,111 or more, indicating effective management and desirable locations/amenities.
- Typical properties (Median) generate around $2,326 per month, representing the average market performance.
- Entry-level properties (Bottom 25%) see earnings around $1,290, often with potential for optimization.
Average Monthly Airbnb Earnings Trend in Miami Lakes
Miami Lakes Airbnb Occupancy Rate Trends (2026)
Maximize your bookings by understanding the Miami Lakes STR occupancy trends. Seasonal demand shifts significantly influence how often properties are booked. Typically, Maysees the highest demand (peak season occupancy), while November experiences the lowest (low season). Effective strategies, like adjusting minimum stays or offering promotions, can boost occupancy during slower periods. Here's how different property tiers perform in Miami Lakes:
- Best-in-class properties (Top 10%) achieve 86%+ occupancy, indicating high desirability and potentially optimized availability.
- Strong performing properties (Top 25%) maintain 69% or higher occupancy, suggesting good market fit and guest satisfaction.
- Typical properties (Median) have an occupancy rate around 46%.
- Entry-level properties (Bottom 25%) average 22% occupancy, potentially facing higher vacancy.
Average Monthly Occupancy Rate Trend in Miami Lakes
Average Daily Rate (ADR) Airbnb Trends in Miami Lakes (2026)
Effective short term rental pricing strategy in Miami Lakes involves understanding monthly ADR fluctuations. The Average Daily Rate (ADR) for Airbnb in Miami Lakes typically peaks in December and dips lowest during April. Leveraging Airbnb dynamic pricing tools or strategies based on this seasonality can significantly boost revenue. Here's a look at the typical nightly rates achieved:
- Best-in-class properties (Top 10%) command rates of $672+ per night, often due to premium features or locations.
- Strong performing properties (Top 25%) achieve nightly rates of $433 or more.
- Typical properties (Median) charge around $168 per night.
- Entry-level properties (Bottom 25%) earn around $88 per night.
Average Daily Rate (ADR) Trend by Month in Miami Lakes
Get Live Miami Lakes Market Intelligence 👇

Explore Real-time Analytics
Airbnb Seasonality Analysis & Trends in Miami Lakes (2026)
Peak Season (March, May, April)
- Revenue averages $5,823 per month
- Occupancy rates average 57.4%
- Daily rates average $272
Shoulder Season
- Revenue averages $4,361 per month
- Occupancy maintains around 47.1%
- Daily rates hold near $294
Low Season (January, September, November)
- Revenue drops to average $3,097 per month
- Occupancy decreases to average 36.8%
- Daily rates adjust to average $325
Seasonality Insights for Miami Lakes
- The Airbnb seasonality in Miami Lakes shows highly seasonal trends requiring careful strategy. While the sections above show seasonal averages, it's also insightful to look at the extremes:
- During the high season, the absolute peak month showcases Miami Lakes's highest earning potential, with monthly revenues capable of climbing to $5,938, occupancy reaching a high of 59.1%, and ADRs peaking at $346.
- Conversely, the slowest single month of the year, typically falling within the low season, marks the market's lowest point. In this month, revenue might dip to $2,828, occupancy could drop to 32.2%, and ADRs may adjust down to $268.
- Understanding both the seasonal averages and these monthly peaks and troughs in revenue, occupancy, and ADR is crucial for maximizing your Airbnb profit potential in Miami Lakes.
Seasonal Strategies for Maximizing Profit
- Peak Season: Maximize revenue through premium pricing and potentially longer minimum stays. Ensure high availability.
- Low Season: Offer competitive pricing, special promotions (e.g., extended stay discounts), and flexible cancellation policies. Target off-season travelers like remote workers or budget-conscious guests.
- Shoulder Seasons: Implement dynamic pricing that balances peak and low rates. Target weekend travelers or specific events. Offer slightly more flexible terms than peak season.
- Regularly analyze your own performance against these Miami Lakes seasonality benchmarks and adjust your pricing and availability strategy accordingly.
Best Areas for Airbnb Investment in Miami Lakes (2026)
Exploring the top neighborhoods for short-term rentals in Miami Lakes? This section highlights key areas, outlining why they are attractive for hosts and guests, along with notable local attractions. Consider these locations based on your target guest profile and investment strategy.
| Neighborhood / Area | Why Host Here? (Target Guests & Appeal) | Key Attractions & Landmarks |
|---|---|---|
| Miami Lakes Town Center | A community hub featuring shops, dining, and entertainment options. It's attractive for families and individuals looking for convenience and comfort in a suburban setting. | Miami Lakes Golf Course, Miami Lakes Auto Mall, Shula's Steak House, Miami Lakes Park, Main Street shops |
| Royal Oaks | A gated community that offers luxurious housing and a serene environment. Ideal for short-term rentals to those seeking peace and security, as well as upscale amenities. | Royal Oaks Park, Miami Lakes Garden Club, Peterson Park, A+ rated schools, nearby shopping centers |
| Lake Patricia | Scenic area with beautiful lakes and parks, perfect for outdoor enthusiasts and families looking for recreational activities. | Lake Patricia, Miami Lakes Picnic Park West, Miami Lakes Community Center, walking trails, biking paths |
| Miami Lakes Golf Club | A popular location for golf lovers and those interested in luxury living. The golf club attracts visitors who enjoy golfing and the social scene that accompanies it. | Miami Lakes Golf Club, bundled golf memberships, community events held at the club, networking gatherings, golf tournaments |
| Satori | A modern community with eco-friendly features and a focus on sustainability. Attracts environmentally conscious travelers seeking a unique stay. | green parks, walking trails, family-friendly amenities, community events, sustainable living features |
| The Reserve at Miami Lakes | A luxurious gated community that appeals to high-end renters looking for privacy and exclusive amenities. | gated security, luxury amenities, community pool, fitness center, social activities |
| Miami Lakes Outlet Center | A shopping destination that draws visitors from all over the region, making it a great location for short-term rentals. | outlet shopping, restaurants, events and festivities, convenient location, high foot traffic |
| Miami Lakes Senior Community | A community specifically designed for seniors, offering amenities and activities suited for an older demographic. Ideal for those looking to spend quality time with family. | senior activities, community events, health and wellness programs, quiet neighborhoods, cycling paths |
Understanding Airbnb License Requirements & STR Laws in Miami Lakes (2026)
While Miami Lakes, Florida, United States currently shows low STR regulations, specific Airbnb license requirements might still exist or change. Always verify the latest short term rental regulations and Airbnb license requirements directly with local government authorities for Miami Lakes to ensure full compliance before hosting.
(Source: AirROI data, 2026, based on 5% licensed listings)
Top Performing Airbnb Properties in Miami Lakes (2026)
Benchmark your potential! Explore examples of top-performing Airbnb properties in Miami Lakesbased on Trailing Twelve Month (TTM) revenue. Analyze their characteristics, revenue, occupancy rate, and ADR to understand what drives success in this market.
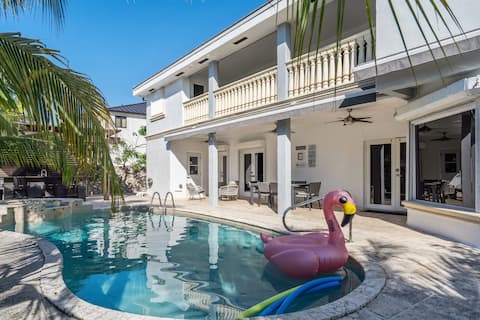
Tropical Pool Paradise x 6-BD,4-BA Luxury Living
Entire Place • 6 bedrooms
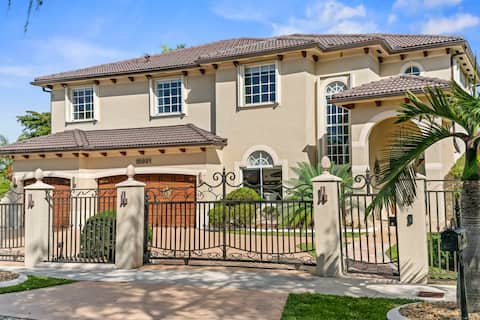
Luxury Villa | 8Bd | Heated Pool | Jacuzzi | Games
Entire Place • 4 bedrooms
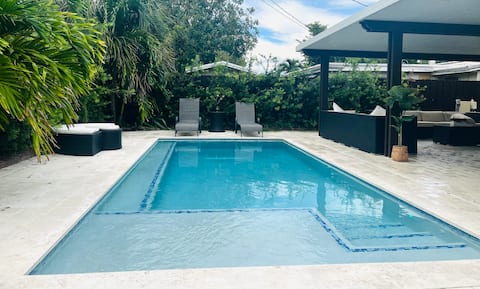
A beautiful place to stay with friends and family
Entire Place • 3 bedrooms
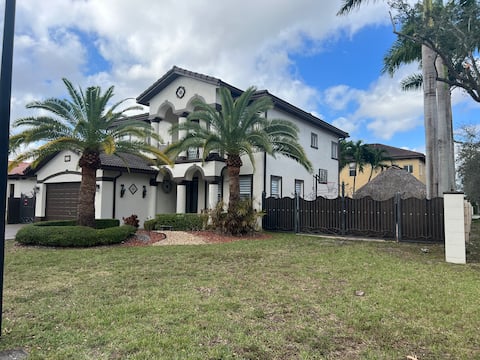
Luxurious villa. House-10 guests/Hot Pool-Spa
Entire Place • 4 bedrooms

Skyline Lux Villa w/ Pool 4/3
Entire Place • 4 bedrooms
Luxury Home heated pool, Jacuzzi
Entire Place • 3 bedrooms
Note: Performance varies based on location, size, amenities, seasonality, and management quality. Data reflects the past 12 months.
Top Performing Airbnb Hosts in Miami Lakes (2026)
Learn from the best! This table showcases top-performing Airbnb hosts in Miami Lakes based on the number of properties managed and estimated total revenue over the past year. Analyze their scale and performance metrics.
| Host Name | Properties | Grossing Revenue | Stay Reviews | Avg Rating |
|---|---|---|---|---|
| Goldnest | 1 | $136,933 | 35 | 4.69/5.0 |
| Maykel | 1 | $133,230 | 57 | 4.79/5.0 |
| Arianna | 1 | $97,411 | 76 | 4.86/5.0 |
| Mercedes | 1 | $61,559 | 73 | 4.95/5.0 |
| Lissette | 1 | $58,310 | 20 | 5.00/5.0 |
| Aron | 1 | $43,537 | 42 | 4.74/5.0 |
| Luciana | 1 | $39,187 | 247 | 4.98/5.0 |
| Jessica | 1 | $28,020 | 55 | 4.27/5.0 |
| Christine | 1 | $26,773 | 221 | 4.91/5.0 |
| Marthelys | 1 | $22,001 | 43 | 4.98/5.0 |
Analyzing the strategies of top hosts, such as their property selection, pricing, and guest communication, can offer valuable lessons for optimizing your own Airbnb operations in Miami Lakes.
Dive Deeper: Advanced Miami Lakes STR Market Data (2026)
Ready to unlock more insights? AirROI provides access to advanced metrics and comprehensive Airbnb data for Miami Lakes. Explore detailed analytics beyond this report to refine your investment strategy, optimize pricing, and maximize your vacation rental profits.
Explore Advanced MetricsMiami Lakes Short-Term Rental Market Composition (2026): Property & Room Types
Room Type Distribution
Property Type Distribution
Market Composition Insights for Miami Lakes
- The Miami Lakes Airbnb market composition is heavily skewed towards Entire Home/Apt listings, which make up 76.2% of the 21 active rentals. This indicates strong guest preference for privacy and space.
- Looking at the property type distribution in Miami Lakes, House properties are the most common (85.7%), reflecting the local real estate landscape.
- Houses represent a significant 85.7% portion, catering likely to families or larger groups.
- Smaller segments like apartment/condo (combined 4.8%) offer potential for unique stay experiences.
Miami Lakes Airbnb Room Capacity Analysis (2026): Bedroom Distribution
Distribution of Listings by Number of Bedrooms
Room Capacity Insights for Miami Lakes
- The dominant room capacity in Miami Lakes is 1 bedroom listings, making up 28.6% of the market. This suggests a strong demand for properties suitable for couples or solo travelers.
- Together, 1 bedroom and 4 bedrooms properties represent 52.4% of the active Airbnb listings in Miami Lakes, indicating a high concentration in these sizes.
- A significant 47.6% of listings offer 3+ bedrooms, catering to larger groups and families seeking more space in Miami Lakes.
Miami Lakes Vacation Rental Guest Capacity Trends (2026)
Distribution of Listings by Guest Capacity
Guest Capacity Insights for Miami Lakes
- The most common guest capacity trend in Miami Lakes vacation rentals is listings accommodating 8+ guests (42.9%). This suggests the primary traveler segment is likely larger groups.
- Properties designed for 8+ guests and 2 guests dominate the Miami Lakes STR market, accounting for 61.9% of listings.
- 47.7% of properties accommodate 6+ guests, serving the market segment for larger families or group travel in Miami Lakes.
- On average, properties in Miami Lakes are equipped to host 4.6 guests.
Miami Lakes Airbnb Booking Patterns (2026): Available vs. Booked Days
Available Days Distribution
Booked Days Distribution
Booking Pattern Insights for Miami Lakes
- The most common availability pattern in Miami Lakes falls within the 271-366 days range, representing 42.9% of listings. This suggests many properties have significant open periods on their calendars.
- Approximately 76.2% of listings show high availability (181+ days open annually), indicating potential for increased bookings or specific owner usage patterns.
- For booked days, the 91-180 days range is most frequent in Miami Lakes (38.1%), reflecting common guest stay durations or potential owner blocking patterns.
- A notable 23.8% of properties secure long booking periods (181+ days booked per year), highlighting successful long-term rental strategies or significant owner usage.
Miami Lakes Airbnb Minimum Stay Requirements Analysis
Distribution of Listings by Minimum Night Requirement
1 Night
5 listings
23.8% of total
2 Nights
4 listings
19% of total
3 Nights
2 listings
9.5% of total
4-6 Nights
2 listings
9.5% of total
7-29 Nights
2 listings
9.5% of total
30+ Nights
6 listings
28.6% of total
Key Insights
- The most prevalent minimum stay requirement in Miami Lakes is 30+ Nights, adopted by 28.6% of listings. This highlights the market's preference for longer commitments.
- A significant segment (28.6%) caters to monthly stays (30+ nights) in Miami Lakes, pointing to opportunities in the extended-stay market.
Recommendations
- Align with the market by considering a 30+ Nights minimum stay, as 28.6% of Miami Lakes hosts use this setting.
- If feasible, allowing 1-night stays, especially midweek or during low season, could capture last-minute bookings, as only 23.8% currently do.
- Explore offering discounts for stays of 30+ nights to attract the 28.6% of the market seeking extended stays.
- Adjust minimum nights based on seasonality – potentially shorter during low season and longer during peak demand periods in Miami Lakes.
Miami Lakes Airbnb Cancellation Policy Trends Analysis (2026)
Limited
1 listings
4.8% of total
Flexible
3 listings
14.3% of total
Moderate
4 listings
19% of total
Firm
9 listings
42.9% of total
Strict
4 listings
19% of total
Cancellation Policy Insights for Miami Lakes
- The prevailing Airbnb cancellation policy trend in Miami Lakes is Firm, used by 42.9% of listings.
- A majority (61.9%) of hosts in Miami Lakes utilize Firm or Strict policies, indicating a market where hosts prioritize booking security.
Recommendations for Hosts
- Consider adopting a Firm policy to align with the 42.9% market standard in Miami Lakes.
- Regularly review your cancellation policy against competitors and market demand shifts in Miami Lakes.
Miami Lakes STR Booking Lead Time Analysis (2026)
Average Booking Lead Time by Month
Booking Lead Time Insights for Miami Lakes
- The overall average booking lead time for vacation rentals in Miami Lakes is 35 days.
- Guests book furthest in advance for stays during December (average 48 days), likely coinciding with peak travel demand or local events.
- The shortest booking windows occur for stays in September (average 20 days), indicating more last-minute travel plans during this time.
- Seasonally, Winter (36 days avg.) sees the longest lead times, while Summer (31 days avg.) has the shortest, reflecting typical travel planning cycles.
Recommendations for Hosts
- Use the overall average lead time (35 days) as a baseline for your pricing and availability strategy in Miami Lakes.
- For December stays, consider implementing length-of-stay discounts or slightly higher rates for bookings made less than 48 days out to capitalize on advance planning.
- Target marketing efforts for the Winter season well in advance (at least 36 days) to capture early planners.
- Monitor your own booking lead times against these Miami Lakes averages to identify opportunities for dynamic pricing adjustments.
Popular & Essential Airbnb Amenities in Miami Lakes (2026)
Amenity Prevalence
Amenity Insights for Miami Lakes
- Essential amenities in Miami Lakes that guests expect include: Free parking on premises, Wifi, Air conditioning, TV, Smoke alarm. Lacking these (any) could significantly impact bookings.
- Popular amenities like Iron, Essentials, Coffee maker are common but not universal. Offering these can provide a competitive edge.
Recommendations for Hosts
- Ensure your listing includes all essential amenities for Miami Lakes: Free parking on premises, Wifi, Air conditioning, TV, Smoke alarm.
- Prioritize adding missing essentials: TV, Smoke alarm.
- Consider adding popular differentiators like Iron or Essentials to increase appeal.
- Highlight unique or less common amenities you offer (e.g., hot tub, dedicated workspace, EV charger) in your listing description and photos.
- Regularly check competitor amenities in Miami Lakes to stay competitive.
Miami Lakes Airbnb Guest Demographics & Profile Analysis (2026)
Guest Profile Summary for Miami Lakes
- The typical guest profile for Airbnb in Miami Lakes consists of primarily domestic travelers (84%), often arriving from nearby Miami, typically belonging to the Post-2000s (Gen Z/Alpha) group (50%), primarily speaking English or Spanish.
- Domestic travelers account for 83.9% of guests.
- Key international markets include United States (83.9%) and Canada (5.4%).
- Top languages spoken are English (59.1%) followed by Spanish (31.8%).
- A significant demographic segment is the Post-2000s (Gen Z/Alpha) group, representing 50% of guests.
Recommendations for Hosts
- Target domestic marketing efforts towards travelers from Miami and New York.
- Tailor amenities and listing descriptions to appeal to the dominant Post-2000s (Gen Z/Alpha) demographic (e.g., highlight fast WiFi, smart home features, local guides).
- Highlight unique local experiences or amenities relevant to the primary guest profile.
- Consider seasonal promotions aligned with peak travel times for key origin markets.
Nearby Short-Term Rental Market Comparison
How does the Miami Lakes Airbnb market stack up against its neighbors? Compare key performance metrics like average monthly revenue, ADR, and occupancy rates in surrounding areas to understand the broader regional STR landscape.
| Market | Active Properties | Monthly Revenue | Daily Rate | Avg. Occupancy |
|---|---|---|---|---|
| Stock Island | 107 | $9,731 | $733.54 | 47% |
| Bal Harbour Village | 37 | $8,846 | $850.63 | 34% |
| Key West | 1,137 | $7,525 | $630.09 | 47% |
| Lake Clarke Shores | 26 | $6,710 | $516.52 | 46% |
| Lighthouse Point | 75 | $6,205 | $472.94 | 51% |
| Pinecrest | 11 | $6,117 | $861.24 | 43% |
| North Bay Village | 120 | $6,032 | $561.12 | 44% |
| Duck Key | 60 | $5,308 | $504.94 | 43% |
| Little Torch Key | 20 | $5,131 | $701.83 | 29% |
| Tequesta | 43 | $4,920 | $376.96 | 50% |