Matlacha Airbnb Market Analysis 2026: Short Term Rental Data & Vacation Rental Statistics in Florida, United States
Is Airbnb profitable in Matlacha in 2026? Explore comprehensive Airbnb analytics for Matlacha, Florida, United States to uncover income potential. This 2026 STR market report for Matlacha, based on AirROI data from February 2025 to January 2026, reveals key trends in the niche market of 66 active listings.
Whether you're considering an Airbnb investment in Matlacha, optimizing your existing vacation rental, or exploring rental arbitrage opportunities, understanding the Matlacha Airbnb data is crucial. Leveraging the low regulation environment is key to maximizing your short term rental income potential. Let's dive into the specifics.
Key Matlacha Airbnb Performance Metrics Overview
Monthly Airbnb Revenue Variations & Income Potential in Matlacha (2026)
Understanding the monthly revenue variations for Airbnb listings in Matlacha is key to maximizing your short term rental income potential. Seasonality significantly impacts earnings. Our analysis, based on data from the past 12 months, shows that the peak revenue month for STRs in Matlacha is typically March, while September often presents the lowest earnings, highlighting opportunities for strategic pricing adjustments during shoulder and low seasons. Explore the typical Airbnb income in Matlacha across different performance tiers:
- Best-in-class properties (Top 10%) achieve $4,718+ monthly, often utilizing dynamic pricing and superior guest experiences.
- Strong performing properties (Top 25%) earn $3,372 or more, indicating effective management and desirable locations/amenities.
- Typical properties (Median) generate around $1,816 per month, representing the average market performance.
- Entry-level properties (Bottom 25%) see earnings around $880, often with potential for optimization.
Average Monthly Airbnb Earnings Trend in Matlacha
Matlacha Airbnb Occupancy Rate Trends (2026)
Maximize your bookings by understanding the Matlacha STR occupancy trends. Seasonal demand shifts significantly influence how often properties are booked. Typically, Februarysees the highest demand (peak season occupancy), while September experiences the lowest (low season). Effective strategies, like adjusting minimum stays or offering promotions, can boost occupancy during slower periods. Here's how different property tiers perform in Matlacha:
- Best-in-class properties (Top 10%) achieve 72%+ occupancy, indicating high desirability and potentially optimized availability.
- Strong performing properties (Top 25%) maintain 52% or higher occupancy, suggesting good market fit and guest satisfaction.
- Typical properties (Median) have an occupancy rate around 32%.
- Entry-level properties (Bottom 25%) average 15% occupancy, potentially facing higher vacancy.
Average Monthly Occupancy Rate Trend in Matlacha
Average Daily Rate (ADR) Airbnb Trends in Matlacha (2026)
Effective short term rental pricing strategy in Matlacha involves understanding monthly ADR fluctuations. The Average Daily Rate (ADR) for Airbnb in Matlacha typically peaks in January and dips lowest during August. Leveraging Airbnb dynamic pricing tools or strategies based on this seasonality can significantly boost revenue. Here's a look at the typical nightly rates achieved:
- Best-in-class properties (Top 10%) command rates of $298+ per night, often due to premium features or locations.
- Strong performing properties (Top 25%) achieve nightly rates of $236 or more.
- Typical properties (Median) charge around $189 per night.
- Entry-level properties (Bottom 25%) earn around $144 per night.
Average Daily Rate (ADR) Trend by Month in Matlacha
Get Live Matlacha Market Intelligence 👇

Explore Real-time Analytics
Airbnb Seasonality Analysis & Trends in Matlacha (2026)
Peak Season (March, February, January)
- Revenue averages $3,514 per month
- Occupancy rates average 49.7%
- Daily rates average $214
Shoulder Season
- Revenue averages $2,112 per month
- Occupancy maintains around 33.3%
- Daily rates hold near $194
Low Season (September, October, November)
- Revenue drops to average $1,479 per month
- Occupancy decreases to average 25.8%
- Daily rates adjust to average $198
Seasonality Insights for Matlacha
- The Airbnb seasonality in Matlacha shows highly seasonal trends requiring careful strategy. While the sections above show seasonal averages, it's also insightful to look at the extremes:
- During the high season, the absolute peak month showcases Matlacha's highest earning potential, with monthly revenues capable of climbing to $3,918, occupancy reaching a high of 57.3%, and ADRs peaking at $226.
- Conversely, the slowest single month of the year, typically falling within the low season, marks the market's lowest point. In this month, revenue might dip to $1,182, occupancy could drop to 21.1%, and ADRs may adjust down to $185.
- Understanding both the seasonal averages and these monthly peaks and troughs in revenue, occupancy, and ADR is crucial for maximizing your Airbnb profit potential in Matlacha.
Seasonal Strategies for Maximizing Profit
- Peak Season: Maximize revenue through premium pricing and potentially longer minimum stays. Ensure high availability.
- Low Season: Offer competitive pricing, special promotions (e.g., extended stay discounts), and flexible cancellation policies. Target off-season travelers like remote workers or budget-conscious guests.
- Shoulder Seasons: Implement dynamic pricing that balances peak and low rates. Target weekend travelers or specific events. Offer slightly more flexible terms than peak season.
- Regularly analyze your own performance against these Matlacha seasonality benchmarks and adjust your pricing and availability strategy accordingly.
Best Areas for Airbnb Investment in Matlacha (2026)
Exploring the top neighborhoods for short-term rentals in Matlacha? This section highlights key areas, outlining why they are attractive for hosts and guests, along with notable local attractions. Consider these locations based on your target guest profile and investment strategy.
| Neighborhood / Area | Why Host Here? (Target Guests & Appeal) | Key Attractions & Landmarks |
|---|---|---|
| Matlacha Village | A charming fishing village known for its colorful cottages and vibrant art scene. Ideal for tourists seeking a laid-back atmosphere with unique local shops and art galleries. | Matlacha Community Park, Gordon's Pass, Matlacha Art District, Bokeelia, Pine Island |
| Pine Island | The largest island in Southwest Florida, offering a tranquil retreat with opportunities for fishing, boating, and exploring nature. Appeals to nature lovers and those seeking a serene getaway. | Bokeelia, Pine Island Center, Cayo Costa State Park, Great Calusa Blueway, Pine Island Sound |
| Cape Coral | Known for its extensive canal system and proximity to various outdoor activities. Attracts families and tourists looking for water-based activities and nearby beaches. | Sunset Beach, Four Freedoms Park, Tarpon Point Marina, Lowe's City Park, Cape Coral Yacht Club |
| Fort Myers Beach | Popular beach destination with beautiful sandy shores and lively entertainment options. A great spot for beach lovers and those looking for nightlife. | Times Square, Lynn Hall Beach Park, Bowditch Point Park, Fort Myers Beach Theater, Estero Island |
| Sanibel Island | Renowned for its shell beaches and pristine nature reserves. Ideal for families and couples seeking a peaceful beach experience. | Sanibel Island Lighthouse, J.N. Ding Darling National Wildlife Refuge, Bowman's Beach, Bailey-Matthews Shell Museum, Clam Pass Park |
| Captiva Island | Known for its upscale resorts and beautiful coastlines. Attracts luxury travelers and those looking for a romantic getaway. | Captiva Beach, Blind Pass Beach, J. N. Ding Darling National Wildlife Refuge, South Seas Island Resort, Captiva Island Historical Society |
| Lehigh Acres | A growing community with affordable housing and a suburban feel. A good option for those looking for longer-term rental opportunities. | Lehigh Acres Community Park, Lehigh Acres Canal, Veterans Park, White Springs Park, Harmes Marsh Preserve |
| Alva | A quaint rural area offering access to outdoor activities and the Caloosahatchee River. Attracts those seeking a local experience away from the tourist crowds. | Alva Village, Caloosahatchee Regional Park, Alva Scrub, Caloosahatchee River, Hernando De Soto Bridge |
Understanding Airbnb License Requirements & STR Laws in Matlacha (2026)
While Matlacha, Florida, United States currently shows low STR regulations, specific Airbnb license requirements might still exist or change. Always verify the latest short term rental regulations and Airbnb license requirements directly with local government authorities for Matlacha to ensure full compliance before hosting.
(Source: AirROI data, 2026, finding no licensed listings among those analyzed)
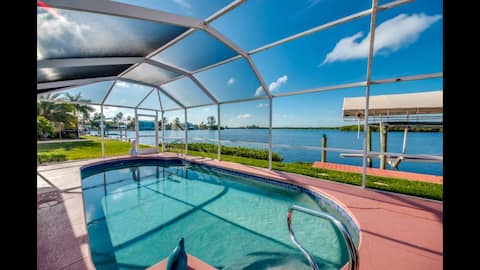
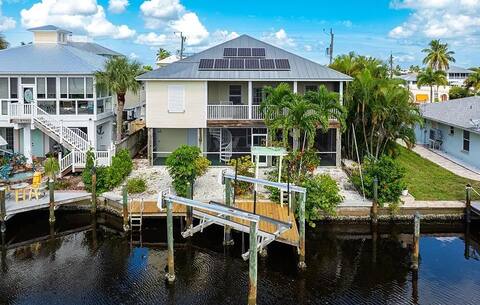
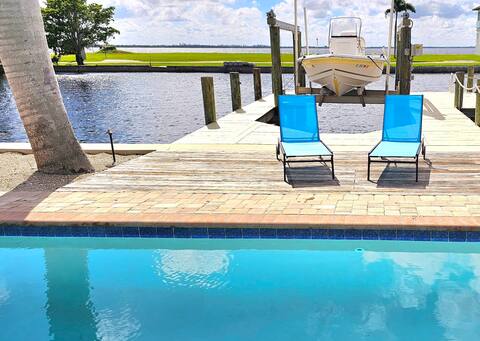
Top Performing Airbnb Properties in Matlacha (2026)
Benchmark your potential! Explore examples of top-performing Airbnb properties in Matlachabased on Trailing Twelve Month (TTM) revenue. Analyze their characteristics, revenue, occupancy rate, and ADR to understand what drives success in this market.

Waterfront Pool Kayak bikes fish from dock
Entire Place • 3 bedrooms

Matlacha Hideaway. Renovated in 2025. Heated pool!
Entire Place • 3 bedrooms
Nature Lover's Dream - Waterfront Living Matlacha
Entire Place • 3 bedrooms

Matlacha waterfront home
Entire Place • 2 bedrooms
Key West Style Home w/ Hot Tub & Boat Lift
Entire Place • 2 bedrooms
"House by the Sea"
Entire Place • 3 bedrooms
Note: Performance varies based on location, size, amenities, seasonality, and management quality. Data reflects the past 12 months.
Top Performing Airbnb Hosts in Matlacha (2026)
Learn from the best! This table showcases top-performing Airbnb hosts in Matlacha based on the number of properties managed and estimated total revenue over the past year. Analyze their scale and performance metrics.
| Host Name | Properties | Grossing Revenue | Stay Reviews | Avg Rating |
|---|---|---|---|---|
| Carina | 3 | $128,097 | 168 | 4.90/5.0 |
| Matlacha | 10 | $82,055 | 42 | 4.71/5.0 |
| Ron | 2 | $75,134 | 73 | 4.87/5.0 |
| Martina | 5 | $66,707 | 470 | 4.74/5.0 |
| Brandon | 1 | $55,445 | 46 | 5.00/5.0 |
| Charles | 1 | $54,349 | 14 | 5.00/5.0 |
| Kevin And Kimberly | 1 | $47,062 | 20 | 5.00/5.0 |
| Chris | 1 | $45,069 | 66 | 4.94/5.0 |
| Kati | 1 | $44,937 | 71 | 4.73/5.0 |
| Lisa | 4 | $41,813 | 129 | 4.83/5.0 |
Analyzing the strategies of top hosts, such as their property selection, pricing, and guest communication, can offer valuable lessons for optimizing your own Airbnb operations in Matlacha.
Dive Deeper: Advanced Matlacha STR Market Data (2026)
Ready to unlock more insights? AirROI provides access to advanced metrics and comprehensive Airbnb data for Matlacha. Explore detailed analytics beyond this report to refine your investment strategy, optimize pricing, and maximize your vacation rental profits.
Explore Advanced MetricsMatlacha Short-Term Rental Market Composition (2026): Property & Room Types
Room Type Distribution
Property Type Distribution
Market Composition Insights for Matlacha
- The Matlacha Airbnb market composition is heavily skewed towards Entire Home/Apt listings, which make up 83.3% of the 66 active rentals. This indicates strong guest preference for privacy and space.
- Looking at the property type distribution in Matlacha, House properties are the most common (68.2%), reflecting the local real estate landscape.
- Houses represent a significant 68.2% portion, catering likely to families or larger groups.
- Smaller segments like hotel/boutique, others (combined 4.5%) offer potential for unique stay experiences.
Matlacha Airbnb Room Capacity Analysis (2026): Bedroom Distribution
Distribution of Listings by Number of Bedrooms
Room Capacity Insights for Matlacha
- The dominant room capacity in Matlacha is 2 bedrooms listings, making up 39.4% of the market. This suggests a strong demand for properties suitable for couples or solo travelers.
- Together, 2 bedrooms and 1 bedroom properties represent 71.2% of the active Airbnb listings in Matlacha, indicating a high concentration in these sizes.
- A significant 21.2% of listings offer 3+ bedrooms, catering to larger groups and families seeking more space in Matlacha.
Matlacha Vacation Rental Guest Capacity Trends (2026)
Distribution of Listings by Guest Capacity
Guest Capacity Insights for Matlacha
- The most common guest capacity trend in Matlacha vacation rentals is listings accommodating 6 guests (34.8%). This suggests the primary traveler segment is likely larger groups.
- Properties designed for 6 guests and 4 guests dominate the Matlacha STR market, accounting for 59.0% of listings.
- 48.4% of properties accommodate 6+ guests, serving the market segment for larger families or group travel in Matlacha.
- On average, properties in Matlacha are equipped to host 4.7 guests.
Matlacha Airbnb Booking Patterns (2026): Available vs. Booked Days
Available Days Distribution
Booked Days Distribution
Booking Pattern Insights for Matlacha
- The most common availability pattern in Matlacha falls within the 271-366 days range, representing 60.6% of listings. This suggests many properties have significant open periods on their calendars.
- Approximately 90.9% of listings show high availability (181+ days open annually), indicating potential for increased bookings or specific owner usage patterns.
- For booked days, the 31-90 days range is most frequent in Matlacha (42.4%), reflecting common guest stay durations or potential owner blocking patterns.
- A notable 10.6% of properties secure long booking periods (181+ days booked per year), highlighting successful long-term rental strategies or significant owner usage.
Matlacha Airbnb Minimum Stay Requirements Analysis
Distribution of Listings by Minimum Night Requirement
1 Night
23 listings
34.8% of total
2 Nights
10 listings
15.2% of total
3 Nights
8 listings
12.1% of total
4-6 Nights
8 listings
12.1% of total
7-29 Nights
2 listings
3% of total
30+ Nights
15 listings
22.7% of total
Key Insights
- The most prevalent minimum stay requirement in Matlacha is 1 Night, adopted by 34.8% of listings. This highlights the market's preference for shorter, flexible bookings.
- A significant segment (22.7%) caters to monthly stays (30+ nights) in Matlacha, pointing to opportunities in the extended-stay market.
Recommendations
- Align with the market by considering a 1 Night minimum stay, as 34.8% of Matlacha hosts use this setting.
- Explore offering discounts for stays of 30+ nights to attract the 22.7% of the market seeking extended stays.
- Adjust minimum nights based on seasonality – potentially shorter during low season and longer during peak demand periods in Matlacha.
Matlacha Airbnb Cancellation Policy Trends Analysis (2026)
Super Strict 30 Days
5 listings
7.7% of total
Flexible
13 listings
20% of total
Moderate
12 listings
18.5% of total
Firm
27 listings
41.5% of total
Strict
8 listings
12.3% of total
Cancellation Policy Insights for Matlacha
- The prevailing Airbnb cancellation policy trend in Matlacha is Firm, used by 41.5% of listings.
- A majority (53.8%) of hosts in Matlacha utilize Firm or Strict policies, indicating a market where hosts prioritize booking security.
Recommendations for Hosts
- Consider adopting a Firm policy to align with the 41.5% market standard in Matlacha.
- Using a Strict policy might deter some guests, as only 12.3% of listings use it. Evaluate if potential revenue protection outweighs possible lower booking rates.
- Regularly review your cancellation policy against competitors and market demand shifts in Matlacha.
Matlacha STR Booking Lead Time Analysis (2026)
Average Booking Lead Time by Month
Booking Lead Time Insights for Matlacha
- The overall average booking lead time for vacation rentals in Matlacha is 60 days.
- Guests book furthest in advance for stays during February (average 91 days), likely coinciding with peak travel demand or local events.
- The shortest booking windows occur for stays in September (average 20 days), indicating more last-minute travel plans during this time.
- Seasonally, Winter (76 days avg.) sees the longest lead times, while Fall (39 days avg.) has the shortest, reflecting typical travel planning cycles.
Recommendations for Hosts
- Use the overall average lead time (60 days) as a baseline for your pricing and availability strategy in Matlacha.
- For February stays, consider implementing length-of-stay discounts or slightly higher rates for bookings made less than 91 days out to capitalize on advance planning.
- Target marketing efforts for the Winter season well in advance (at least 76 days) to capture early planners.
- Monitor your own booking lead times against these Matlacha averages to identify opportunities for dynamic pricing adjustments.
Popular & Essential Airbnb Amenities in Matlacha (2026)
Amenity Prevalence
Amenity Insights for Matlacha
- Essential amenities in Matlacha that guests expect include: TV, Air conditioning, Wifi, Free parking on premises, Hot water, Kitchen. Lacking these (any) could significantly impact bookings.
- Popular amenities like Smoke alarm, Refrigerator, Washer are common but not universal. Offering these can provide a competitive edge.
Recommendations for Hosts
- Ensure your listing includes all essential amenities for Matlacha: TV, Air conditioning, Wifi, Free parking on premises, Hot water, Kitchen.
- Prioritize adding missing essentials: Wifi, Free parking on premises, Hot water, Kitchen.
- Consider adding popular differentiators like Smoke alarm or Refrigerator to increase appeal.
- Highlight unique or less common amenities you offer (e.g., hot tub, dedicated workspace, EV charger) in your listing description and photos.
- Regularly check competitor amenities in Matlacha to stay competitive.
Matlacha Airbnb Guest Demographics & Profile Analysis (2026)
Guest Profile Summary for Matlacha
- The typical guest profile for Airbnb in Matlacha consists of primarily domestic travelers (98%), often arriving from nearby Fort Lauderdale, typically belonging to the Post-2000s (Gen Z/Alpha) group (50%), primarily speaking English or Spanish.
- Domestic travelers account for 98.0% of guests.
- Key international markets include United States (98%) and Canada (0.8%).
- Top languages spoken are English (70.6%) followed by Spanish (12.8%).
- A significant demographic segment is the Post-2000s (Gen Z/Alpha) group, representing 50% of guests.
Recommendations for Hosts
- Target domestic marketing efforts towards travelers from Fort Lauderdale and Miami.
- Tailor amenities and listing descriptions to appeal to the dominant Post-2000s (Gen Z/Alpha) demographic (e.g., highlight fast WiFi, smart home features, local guides).
- Highlight unique local experiences or amenities relevant to the primary guest profile.
- Consider seasonal promotions aligned with peak travel times for key origin markets.
Nearby Short-Term Rental Market Comparison
How does the Matlacha Airbnb market stack up against its neighbors? Compare key performance metrics like average monthly revenue, ADR, and occupancy rates in surrounding areas to understand the broader regional STR landscape.
| Market | Active Properties | Monthly Revenue | Daily Rate | Avg. Occupancy |
|---|---|---|---|---|
| Anna Maria island | 587 | $7,996 | $823.96 | 41% |
| Anna Maria | 56 | $6,434 | $692.96 | 52% |
| Boca Grande | 31 | $6,128 | $787.07 | 37% |
| Indian Rocks Beach | 842 | $5,560 | $419.63 | 49% |
| Captiva | 291 | $5,443 | $667.40 | 36% |
| Siesta Key | 1,175 | $5,206 | $518.91 | 42% |
| Belleair Beach | 94 | $5,086 | $339.65 | 53% |
| Bradenton Beach | 122 | $4,977 | $507.12 | 42% |
| Seminole | 519 | $4,223 | $316.69 | 52% |
| Brandenton Beach | 481 | $4,172 | $496.62 | 37% |