Marathon Airbnb Market Analysis 2026: Short Term Rental Data & Vacation Rental Statistics in Florida, United States
Is Airbnb profitable in Marathon in 2026? Explore comprehensive Airbnb analytics for Marathon, Florida, United States to uncover income potential. This 2026 STR market report for Marathon, based on AirROI data from February 2025 to January 2026, reveals key trends in the market of 987 active listings.
Whether you're considering an Airbnb investment in Marathon, optimizing your existing vacation rental, or exploring rental arbitrage opportunities, understanding the Marathon Airbnb data is crucial. Leveraging the low regulation environment is key to maximizing your short term rental income potential. Let's dive into the specifics.
Key Marathon Airbnb Performance Metrics Overview
Monthly Airbnb Revenue Variations & Income Potential in Marathon (2026)
Understanding the monthly revenue variations for Airbnb listings in Marathon is key to maximizing your short term rental income potential. Seasonality significantly impacts earnings. Our analysis, based on data from the past 12 months, shows that the peak revenue month for STRs in Marathon is typically March, while September often presents the lowest earnings, highlighting opportunities for strategic pricing adjustments during shoulder and low seasons. Explore the typical Airbnb income in Marathon across different performance tiers:
- Best-in-class properties (Top 10%) achieve $14,646+ monthly, often utilizing dynamic pricing and superior guest experiences.
- Strong performing properties (Top 25%) earn $9,319 or more, indicating effective management and desirable locations/amenities.
- Typical properties (Median) generate around $5,316 per month, representing the average market performance.
- Entry-level properties (Bottom 25%) see earnings around $2,845, often with potential for optimization.
Average Monthly Airbnb Earnings Trend in Marathon
Marathon Airbnb Occupancy Rate Trends (2026)
Maximize your bookings by understanding the Marathon STR occupancy trends. Seasonal demand shifts significantly influence how often properties are booked. Typically, Marchsees the highest demand (peak season occupancy), while September experiences the lowest (low season). Effective strategies, like adjusting minimum stays or offering promotions, can boost occupancy during slower periods. Here's how different property tiers perform in Marathon:
- Best-in-class properties (Top 10%) achieve 81%+ occupancy, indicating high desirability and potentially optimized availability.
- Strong performing properties (Top 25%) maintain 64% or higher occupancy, suggesting good market fit and guest satisfaction.
- Typical properties (Median) have an occupancy rate around 42%.
- Entry-level properties (Bottom 25%) average 23% occupancy, potentially facing higher vacancy.
Average Monthly Occupancy Rate Trend in Marathon
Average Daily Rate (ADR) Airbnb Trends in Marathon (2026)
Effective short term rental pricing strategy in Marathon involves understanding monthly ADR fluctuations. The Average Daily Rate (ADR) for Airbnb in Marathon typically peaks in January and dips lowest during September. Leveraging Airbnb dynamic pricing tools or strategies based on this seasonality can significantly boost revenue. Here's a look at the typical nightly rates achieved:
- Best-in-class properties (Top 10%) command rates of $842+ per night, often due to premium features or locations.
- Strong performing properties (Top 25%) achieve nightly rates of $599 or more.
- Typical properties (Median) charge around $405 per night.
- Entry-level properties (Bottom 25%) earn around $279 per night.
Average Daily Rate (ADR) Trend by Month in Marathon
Get Live Marathon Market Intelligence 👇

Explore Real-time Analytics
Airbnb Seasonality Analysis & Trends in Marathon (2026)
Peak Season (March, February, July)
- Revenue averages $9,703 per month
- Occupancy rates average 57.4%
- Daily rates average $506
Shoulder Season
- Revenue averages $6,799 per month
- Occupancy maintains around 42.0%
- Daily rates hold near $496
Low Season (September, October, November)
- Revenue drops to average $4,779 per month
- Occupancy decreases to average 35.5%
- Daily rates adjust to average $453
Seasonality Insights for Marathon
- The Airbnb seasonality in Marathon shows highly seasonal trends requiring careful strategy. While the sections above show seasonal averages, it's also insightful to look at the extremes:
- During the high season, the absolute peak month showcases Marathon's highest earning potential, with monthly revenues capable of climbing to $10,695, occupancy reaching a high of 61.6%, and ADRs peaking at $541.
- Conversely, the slowest single month of the year, typically falling within the low season, marks the market's lowest point. In this month, revenue might dip to $4,208, occupancy could drop to 33.2%, and ADRs may adjust down to $430.
- Understanding both the seasonal averages and these monthly peaks and troughs in revenue, occupancy, and ADR is crucial for maximizing your Airbnb profit potential in Marathon.
Seasonal Strategies for Maximizing Profit
- Peak Season: Maximize revenue through premium pricing and potentially longer minimum stays. Ensure high availability.
- Low Season: Offer competitive pricing, special promotions (e.g., extended stay discounts), and flexible cancellation policies. Target off-season travelers like remote workers or budget-conscious guests.
- Shoulder Seasons: Implement dynamic pricing that balances peak and low rates. Target weekend travelers or specific events. Offer slightly more flexible terms than peak season.
- Regularly analyze your own performance against these Marathon seasonality benchmarks and adjust your pricing and availability strategy accordingly.
Best Areas for Airbnb Investment in Marathon (2026)
Exploring the top neighborhoods for short-term rentals in Marathon? This section highlights key areas, outlining why they are attractive for hosts and guests, along with notable local attractions. Consider these locations based on your target guest profile and investment strategy.
| Neighborhood / Area | Why Host Here? (Target Guests & Appeal) | Key Attractions & Landmarks |
|---|---|---|
| Key Colony Beach | A popular small city in the Florida Keys known for its beautiful beaches and relaxed atmosphere. Perfect for families and vacationers looking for a peaceful getaway. | Marathon Seaside Park, Key Colony Beach Golf, Sunset Park, Dolphin Research Center, The Cabana Club |
| Sombrero Beach | Renowned for its sandy beach and turquoise waters, Sombrero Beach is a favorite spot for swimming, sunbathing, and picnicking. Great for those wanting to enjoy the beach life. | Sombrero Key Lighthouse, Sombrero Beach, Nature trails, Picnic areas, Water sports activities |
| Marathon Key | Known for its central location in the Florida Keys, Marathon offers easy access to various attractions, making it ideal for visitors looking for convenience and adventure. | Seven Mile Bridge, Marathon Main Street, Crane Point Museums & Nature Center, Islander Watersports, Swim with the Dolphins |
| Boot Key Harbor | A harbor destination popular with boaters and fishing enthusiasts. A vibrant community that attracts those who enjoy waterfront living and activities. | Boot Key Harbor, Fishing spots, Waterfront restaurants, Kayaking, Boating |
| Coco Plum Beach | A less crowded beach known for its natural beauty and excellent snorkeling opportunities. A perfect location for those seeking tranquility and nature. | Coco Plum Beach, Snorkeling, Wildlife viewing, Kayaking, Beachcombing |
| The Turtle Hospital | A unique facility dedicated to the rehabilitation of sea turtles. Attracts visitors interested in marine life and conservation efforts. | Turtle Hospital tours, Educational programs, Sea turtle rescue and rehabilitation, Releasing turtles into the wild |
| Marathon Community Park | A family-friendly park with sports facilities and playgrounds. Great for families traveling with children. | Playground, Basketball courts, Picnic areas, Walking trails, Community events |
| Florida Keys Marathon Airport | The main airport serving Marathon, making it convenient for visitors flying in. It's close to several popular vacation rentals and accommodations. | Airplane tours, Proximity to attractions, Car rentals, Restaurants nearby, Easy access to the Keys |
Understanding Airbnb License Requirements & STR Laws in Marathon (2026)
While Marathon, Florida, United States currently shows low STR regulations, specific Airbnb license requirements might still exist or change. Always verify the latest short term rental regulations and Airbnb license requirements directly with local government authorities for Marathon to ensure full compliance before hosting.
(Source: AirROI data, 2026, based on 0% licensed listings)
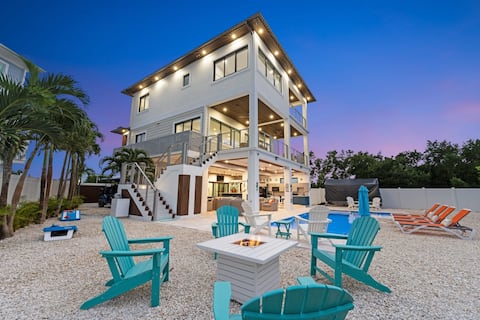
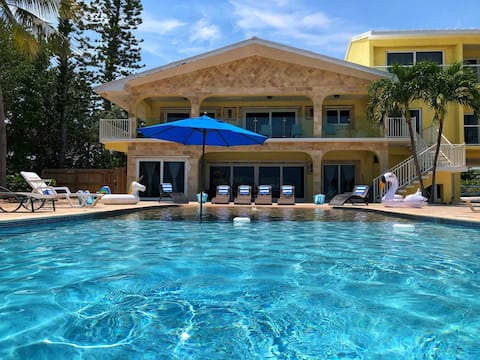
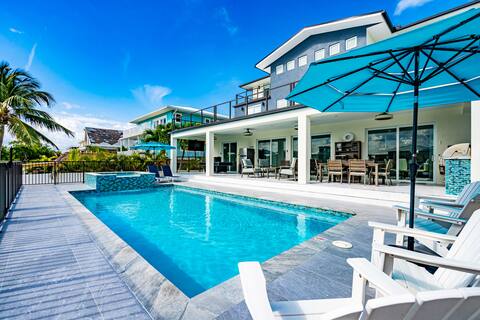
Top Performing Airbnb Properties in Marathon (2026)
Benchmark your potential! Explore examples of top-performing Airbnb properties in Marathonbased on Trailing Twelve Month (TTM) revenue. Analyze their characteristics, revenue, occupancy rate, and ADR to understand what drives success in this market.

Luxury Villa-Pool-Jacuzzi-Endless Amenities-
Entire Place • 6 bedrooms
Luxury Seaside Escape ~ Pool ~ Dock ~ Scenic Views
Entire Place • 5 bedrooms
Great Large Group Retreat! Sleeps Up To 30!
Entire Place • 13 bedrooms
Paradise Villa: a luxury retreat
Entire Place • 7 bedrooms

Luxe Waterfront Retreat-2 Pools-Beach-Spa-Dockage
Entire Place • 7 bedrooms

The Bent Coconut
Entire Place • 5 bedrooms
Note: Performance varies based on location, size, amenities, seasonality, and management quality. Data reflects the past 12 months.
Top Performing Airbnb Hosts in Marathon (2026)
Learn from the best! This table showcases top-performing Airbnb hosts in Marathon based on the number of properties managed and estimated total revenue over the past year. Analyze their scale and performance metrics.
| Host Name | Properties | Grossing Revenue | Stay Reviews | Avg Rating |
|---|---|---|---|---|
| Vacation Rentals Of The Fla Ke | 106 | $4,152,298 | 1460 | 4.77/5.0 |
| Coco Plum | 55 | $3,143,698 | 503 | 4.68/5.0 |
| Leslie | 46 | $2,845,696 | 587 | 4.84/5.0 |
| Bert | 16 | $2,020,249 | 277 | 4.96/5.0 |
| Michel | 9 | $1,531,510 | 188 | 4.93/5.0 |
| Island Breeze | 19 | $1,025,040 | 74 | 4.68/5.0 |
| Ruth | 6 | $829,731 | 98 | 5.00/5.0 |
| ITrip KeyWest | 13 | $769,670 | 155 | 4.71/5.0 |
| Roman | 3 | $699,283 | 114 | 4.89/5.0 |
| Yuni | 13 | $696,729 | 221 | 4.93/5.0 |
Analyzing the strategies of top hosts, such as their property selection, pricing, and guest communication, can offer valuable lessons for optimizing your own Airbnb operations in Marathon.
Dive Deeper: Advanced Marathon STR Market Data (2026)
Ready to unlock more insights? AirROI provides access to advanced metrics and comprehensive Airbnb data for Marathon. Explore detailed analytics beyond this report to refine your investment strategy, optimize pricing, and maximize your vacation rental profits.
Explore Advanced MetricsMarathon Short-Term Rental Market Composition (2026): Property & Room Types
Room Type Distribution
Property Type Distribution
Market Composition Insights for Marathon
- The Marathon Airbnb market composition is heavily skewed towards Entire Home/Apt listings, which make up 94.8% of the 987 active rentals. This indicates strong guest preference for privacy and space.
- Looking at the property type distribution in Marathon, House properties are the most common (77.5%), reflecting the local real estate landscape.
- Houses represent a significant 77.5% portion, catering likely to families or larger groups.
- Smaller segments like hotel/boutique, outdoor/unique, others, unique stays (combined 7.2%) offer potential for unique stay experiences.
Marathon Airbnb Room Capacity Analysis (2026): Bedroom Distribution
Distribution of Listings by Number of Bedrooms
Room Capacity Insights for Marathon
- The dominant room capacity in Marathon is 3 bedrooms listings, making up 28% of the market. This suggests a strong demand for properties suitable for families or small groups.
- Together, 3 bedrooms and 2 bedrooms properties represent 55.0% of the active Airbnb listings in Marathon, indicating a high concentration in these sizes.
- A significant 54.4% of listings offer 3+ bedrooms, catering to larger groups and families seeking more space in Marathon.
Marathon Vacation Rental Guest Capacity Trends (2026)
Distribution of Listings by Guest Capacity
Guest Capacity Insights for Marathon
- The most common guest capacity trend in Marathon vacation rentals is listings accommodating 8+ guests (48.2%). This suggests the primary traveler segment is likely larger groups.
- Properties designed for 8+ guests and 6 guests dominate the Marathon STR market, accounting for 72.6% of listings.
- 73.6% of properties accommodate 6+ guests, serving the market segment for larger families or group travel in Marathon.
- On average, properties in Marathon are equipped to host 6.4 guests.
Marathon Airbnb Booking Patterns (2026): Available vs. Booked Days
Available Days Distribution
Booked Days Distribution
Booking Pattern Insights for Marathon
- The most common availability pattern in Marathon falls within the 271-366 days range, representing 47.1% of listings. This suggests many properties have significant open periods on their calendars.
- Approximately 78.7% of listings show high availability (181+ days open annually), indicating potential for increased bookings or specific owner usage patterns.
- For booked days, the 91-180 days range is most frequent in Marathon (32.7%), reflecting common guest stay durations or potential owner blocking patterns.
- A notable 22.6% of properties secure long booking periods (181+ days booked per year), highlighting successful long-term rental strategies or significant owner usage.
Marathon Airbnb Minimum Stay Requirements Analysis
Distribution of Listings by Minimum Night Requirement
1 Night
70 listings
7.1% of total
2 Nights
24 listings
2.4% of total
3 Nights
18 listings
1.8% of total
4-6 Nights
39 listings
4% of total
7-29 Nights
594 listings
60.2% of total
30+ Nights
241 listings
24.4% of total
Key Insights
- The most prevalent minimum stay requirement in Marathon is 7-29 Nights, adopted by 60.2% of listings. This highlights the market's preference for shorter, flexible bookings.
- Very short stays (1-2 nights) are less common (9.5%), suggesting hosts prefer slightly longer bookings to optimize turnover.
- A significant segment (24.4%) caters to monthly stays (30+ nights) in Marathon, pointing to opportunities in the extended-stay market.
Recommendations
- Align with the market by considering a 7-29 Nights minimum stay, as 60.2% of Marathon hosts use this setting.
- If feasible, allowing 1-night stays, especially midweek or during low season, could capture last-minute bookings, as only 7.1% currently do.
- Explore offering discounts for stays of 30+ nights to attract the 24.4% of the market seeking extended stays.
- Adjust minimum nights based on seasonality – potentially shorter during low season and longer during peak demand periods in Marathon.
Marathon Airbnb Cancellation Policy Trends Analysis (2026)
Limited
11 listings
1.1% of total
Super Strict 30 Days
72 listings
7.4% of total
Super Strict 60 Days
272 listings
27.8% of total
Flexible
61 listings
6.2% of total
Moderate
112 listings
11.5% of total
Firm
299 listings
30.6% of total
Strict
151 listings
15.4% of total
Cancellation Policy Insights for Marathon
- The prevailing Airbnb cancellation policy trend in Marathon is Firm, used by 30.6% of listings.
- There's a relatively balanced mix between guest-friendly (17.7%) and stricter (46.0%) policies, offering choices for different guest needs.
Recommendations for Hosts
- Consider adopting a Firm policy to align with the 30.6% market standard in Marathon.
- Regularly review your cancellation policy against competitors and market demand shifts in Marathon.
Marathon STR Booking Lead Time Analysis (2026)
Average Booking Lead Time by Month
Booking Lead Time Insights for Marathon
- The overall average booking lead time for vacation rentals in Marathon is 95 days.
- Guests book furthest in advance for stays during February (average 118 days), likely coinciding with peak travel demand or local events.
- The shortest booking windows occur for stays in September (average 66 days), indicating more last-minute travel plans during this time.
- Seasonally, Winter (115 days avg.) sees the longest lead times, while Fall (83 days avg.) has the shortest, reflecting typical travel planning cycles.
Recommendations for Hosts
- Use the overall average lead time (95 days) as a baseline for your pricing and availability strategy in Marathon.
- For February stays, consider implementing length-of-stay discounts or slightly higher rates for bookings made less than 118 days out to capitalize on advance planning.
- Target marketing efforts for the Winter season well in advance (at least 115 days) to capture early planners.
- Monitor your own booking lead times against these Marathon averages to identify opportunities for dynamic pricing adjustments.
Popular & Essential Airbnb Amenities in Marathon (2026)
Amenity Prevalence
Amenity Insights for Marathon
- Essential amenities in Marathon that guests expect include: Air conditioning, TV, Wifi, Smoke alarm. Lacking these (any) could significantly impact bookings.
- Popular amenities like Kitchen, Coffee maker, Fire extinguisher are common but not universal. Offering these can provide a competitive edge.
Recommendations for Hosts
- Ensure your listing includes all essential amenities for Marathon: Air conditioning, TV, Wifi, Smoke alarm.
- Prioritize adding missing essentials: Air conditioning, TV, Wifi, Smoke alarm.
- Consider adding popular differentiators like Kitchen or Coffee maker to increase appeal.
- Highlight unique or less common amenities you offer (e.g., hot tub, dedicated workspace, EV charger) in your listing description and photos.
- Regularly check competitor amenities in Marathon to stay competitive.
Marathon Airbnb Guest Demographics & Profile Analysis (2026)
Guest Profile Summary for Marathon
- The typical guest profile for Airbnb in Marathon consists of primarily domestic travelers (93%), often arriving from nearby Miami, typically belonging to the Post-2000s (Gen Z/Alpha) group (50%), primarily speaking English or Spanish.
- Domestic travelers account for 92.7% of guests.
- Key international markets include United States (92.7%) and United Kingdom (1.5%).
- Top languages spoken are English (73.7%) followed by Spanish (12%).
- A significant demographic segment is the Post-2000s (Gen Z/Alpha) group, representing 50% of guests.
Recommendations for Hosts
- Target domestic marketing efforts towards travelers from Miami and Jacksonville.
- Tailor amenities and listing descriptions to appeal to the dominant Post-2000s (Gen Z/Alpha) demographic (e.g., highlight fast WiFi, smart home features, local guides).
- Highlight unique local experiences or amenities relevant to the primary guest profile.
- Consider seasonal promotions aligned with peak travel times for key origin markets.
Nearby Short-Term Rental Market Comparison
How does the Marathon Airbnb market stack up against its neighbors? Compare key performance metrics like average monthly revenue, ADR, and occupancy rates in surrounding areas to understand the broader regional STR landscape.
| Market | Active Properties | Monthly Revenue | Daily Rate | Avg. Occupancy |
|---|---|---|---|---|
| Stock Island | 107 | $9,731 | $733.54 | 47% |
| Bal Harbour Village | 37 | $8,846 | $850.63 | 34% |
| Key West | 1,137 | $7,525 | $630.09 | 47% |
| Pinecrest | 11 | $6,117 | $861.24 | 43% |
| North Bay Village | 120 | $6,032 | $561.12 | 44% |
| Duck Key | 60 | $5,308 | $504.94 | 43% |
| Little Torch Key | 20 | $5,131 | $701.83 | 29% |
| Key Biscayne | 104 | $4,470 | $448.61 | 49% |
| Miami Shores | 90 | $4,360 | $453.13 | 47% |
| Key Colony Beach | 264 | $4,280 | $382.20 | 46% |