Madeira Beach Airbnb Market Analysis 2026: Short Term Rental Data & Vacation Rental Statistics in Florida, United States
Is Airbnb profitable in Madeira Beach in 2026? Explore comprehensive Airbnb analytics for Madeira Beach, Florida, United States to uncover income potential. This 2026 STR market report for Madeira Beach, based on AirROI data from February 2025 to January 2026, reveals key trends in the market of 729 active listings.
Whether you're considering an Airbnb investment in Madeira Beach, optimizing your existing vacation rental, or exploring rental arbitrage opportunities, understanding the Madeira Beach Airbnb data is crucial. Leveraging the low regulation environment is key to maximizing your short term rental income potential. Let's dive into the specifics.
Key Madeira Beach Airbnb Performance Metrics Overview
Monthly Airbnb Revenue Variations & Income Potential in Madeira Beach (2026)
Understanding the monthly revenue variations for Airbnb listings in Madeira Beach is key to maximizing your short term rental income potential. Seasonality significantly impacts earnings. Our analysis, based on data from the past 12 months, shows that the peak revenue month for STRs in Madeira Beach is typically March, while September often presents the lowest earnings, highlighting opportunities for strategic pricing adjustments during shoulder and low seasons. Explore the typical Airbnb income in Madeira Beach across different performance tiers:
- Best-in-class properties (Top 10%) achieve $8,828+ monthly, often utilizing dynamic pricing and superior guest experiences.
- Strong performing properties (Top 25%) earn $6,164 or more, indicating effective management and desirable locations/amenities.
- Typical properties (Median) generate around $3,798 per month, representing the average market performance.
- Entry-level properties (Bottom 25%) see earnings around $2,061, often with potential for optimization.
Average Monthly Airbnb Earnings Trend in Madeira Beach
Madeira Beach Airbnb Occupancy Rate Trends (2026)
Maximize your bookings by understanding the Madeira Beach STR occupancy trends. Seasonal demand shifts significantly influence how often properties are booked. Typically, Marchsees the highest demand (peak season occupancy), while January experiences the lowest (low season). Effective strategies, like adjusting minimum stays or offering promotions, can boost occupancy during slower periods. Here's how different property tiers perform in Madeira Beach:
- Best-in-class properties (Top 10%) achieve 82%+ occupancy, indicating high desirability and potentially optimized availability.
- Strong performing properties (Top 25%) maintain 65% or higher occupancy, suggesting good market fit and guest satisfaction.
- Typical properties (Median) have an occupancy rate around 46%.
- Entry-level properties (Bottom 25%) average 25% occupancy, potentially facing higher vacancy.
Average Monthly Occupancy Rate Trend in Madeira Beach
Average Daily Rate (ADR) Airbnb Trends in Madeira Beach (2026)
Effective short term rental pricing strategy in Madeira Beach involves understanding monthly ADR fluctuations. The Average Daily Rate (ADR) for Airbnb in Madeira Beach typically peaks in January and dips lowest during August. Leveraging Airbnb dynamic pricing tools or strategies based on this seasonality can significantly boost revenue. Here's a look at the typical nightly rates achieved:
- Best-in-class properties (Top 10%) command rates of $443+ per night, often due to premium features or locations.
- Strong performing properties (Top 25%) achieve nightly rates of $327 or more.
- Typical properties (Median) charge around $252 per night.
- Entry-level properties (Bottom 25%) earn around $193 per night.
Average Daily Rate (ADR) Trend by Month in Madeira Beach
Get Live Madeira Beach Market Intelligence 👇

Explore Real-time Analytics
Airbnb Seasonality Analysis & Trends in Madeira Beach (2026)
Peak Season (March, February, April)
- Revenue averages $6,546 per month
- Occupancy rates average 62.3%
- Daily rates average $299
Shoulder Season
- Revenue averages $4,347 per month
- Occupancy maintains around 43.9%
- Daily rates hold near $281
Low Season (January, August, September)
- Revenue drops to average $3,194 per month
- Occupancy decreases to average 33.9%
- Daily rates adjust to average $277
Seasonality Insights for Madeira Beach
- The Airbnb seasonality in Madeira Beach shows highly seasonal trends requiring careful strategy. While the sections above show seasonal averages, it's also insightful to look at the extremes:
- During the high season, the absolute peak month showcases Madeira Beach's highest earning potential, with monthly revenues capable of climbing to $7,992, occupancy reaching a high of 68.5%, and ADRs peaking at $313.
- Conversely, the slowest single month of the year, typically falling within the low season, marks the market's lowest point. In this month, revenue might dip to $2,769, occupancy could drop to 31.9%, and ADRs may adjust down to $254.
- Understanding both the seasonal averages and these monthly peaks and troughs in revenue, occupancy, and ADR is crucial for maximizing your Airbnb profit potential in Madeira Beach.
Seasonal Strategies for Maximizing Profit
- Peak Season: Maximize revenue through premium pricing and potentially longer minimum stays. Ensure high availability.
- Low Season: Offer competitive pricing, special promotions (e.g., extended stay discounts), and flexible cancellation policies. Target off-season travelers like remote workers or budget-conscious guests.
- Shoulder Seasons: Implement dynamic pricing that balances peak and low rates. Target weekend travelers or specific events. Offer slightly more flexible terms than peak season.
- Regularly analyze your own performance against these Madeira Beach seasonality benchmarks and adjust your pricing and availability strategy accordingly.
Best Areas for Airbnb Investment in Madeira Beach (2026)
Exploring the top neighborhoods for short-term rentals in Madeira Beach? This section highlights key areas, outlining why they are attractive for hosts and guests, along with notable local attractions. Consider these locations based on your target guest profile and investment strategy.
| Neighborhood / Area | Why Host Here? (Target Guests & Appeal) | Key Attractions & Landmarks |
|---|---|---|
| Johns Pass Village | A bustling waterfront area known for its shops, restaurants, and entertainment. It's popular with tourists looking for dining and water activities, making it an ideal spot for Airbnb hosting. | Johns Pass Boardwalk, Water sports rentals, Historic fishing village, Shops and boutiques, Restaurants and bars |
| Madeira Beach | A beautiful coastal community famous for its sandy beaches and relaxed atmosphere. It's perfect for families and vacationers seeking direct beach access and a laid-back experience. | Madeira Beach, Archibald Park, Gulf Boulevard, Beachfront restaurants, Parks and recreation areas |
| Treasure Island | Close to Madeira Beach, this area is known for its picturesque beaches and family-friendly atmosphere. It's a favorite for vacationers looking for sand and sunshine. | Treasure Island Beach, Johns Pass, Caddy's On The Beach, Sunset Beach, Beach parks |
| Redington Shores | A quiet community known for its tranquil beaches and family-oriented vibe. Ideal for those looking to escape the busier tourist areas while still enjoying beach access. | Redington Shores Beach, Nature parks, Fishing pier, Local eateries, Sunset views |
| St. Pete Beach | Just south of Madeira Beach, it's one of Florida's most popular beach destinations known for its beautiful shoreline and vibrant nightlife options. | St. Pete Beach, Pass-a-Grille Beach, Beach bars and restaurants, Historic Corey Avenue, Water sports activities |
| Gulfport | A charming small town with a vibrant arts scene and cultural events. Attracts visitors looking for a unique experience away from traditional tourist spots. | Gulfport Beach, Art district, Restaurants and cafes, Weekly markets, Cultural festivals |
| Isle of Palms | An exclusive neighborhood that offers a mix of privacy and beach access, it's attractive for those seeking luxury rentals and intimate getaway experiences. | Secluded beaches, Private parks, Waterfront dining, Nature trails, Relaxed environment |
| Old Northeast St. Petersburg | A historic neighborhood close to the waterfront and downtown, it's attractive for those looking for a mix of cultural experiences and beach proximity. | Vinoy Park, Downtown St. Petersburg, Historic homes, Mosaic art murals, Restaurants and nightlife |
Understanding Airbnb License Requirements & STR Laws in Madeira Beach (2026)
While Madeira Beach, Florida, United States currently shows low STR regulations, specific Airbnb license requirements might still exist or change. Always verify the latest short term rental regulations and Airbnb license requirements directly with local government authorities for Madeira Beach to ensure full compliance before hosting.
(Source: AirROI data, 2026, finding no licensed listings among those analyzed)
Top Performing Airbnb Properties in Madeira Beach (2026)
Benchmark your potential! Explore examples of top-performing Airbnb properties in Madeira Beachbased on Trailing Twelve Month (TTM) revenue. Analyze their characteristics, revenue, occupancy rate, and ADR to understand what drives success in this market.
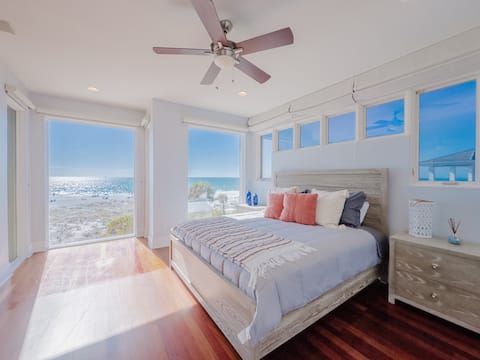
Lux Madeira Beachfront Home
Entire Place • 4 bedrooms
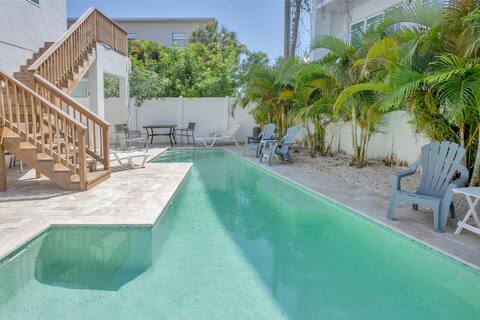
Luxury Pool Home/Golf Cart
Entire Place • 6 bedrooms

Sleeps 24-Beachfront Resort-Outdoor Pool 7BR
Entire Place • 7 bedrooms

Duo Dwellings, Views Galore
Entire Place • 6 bedrooms

Luxe waterfront home, near beach
Entire Place • 7 bedrooms

Huge Beachfront House with Patio! Family Friendly.
Entire Place • 5 bedrooms
Note: Performance varies based on location, size, amenities, seasonality, and management quality. Data reflects the past 12 months.
Top Performing Airbnb Hosts in Madeira Beach (2026)
Learn from the best! This table showcases top-performing Airbnb hosts in Madeira Beach based on the number of properties managed and estimated total revenue over the past year. Analyze their scale and performance metrics.
| Host Name | Properties | Grossing Revenue | Stay Reviews | Avg Rating |
|---|---|---|---|---|
| Charles And Liz | 90 | $4,179,052 | 3022 | 4.66/5.0 |
| Tim | 121 | $2,496,185 | 1035 | 4.60/5.0 |
| Resort Rentals | 61 | $2,291,297 | 718 | 4.59/5.0 |
| Kristin | 16 | $1,499,835 | 2377 | 4.87/5.0 |
| Travel Resort | 31 | $1,258,646 | 350 | 4.62/5.0 |
| Luxury Host | 7 | $824,601 | 156 | 4.77/5.0 |
| Zarko | 4 | $639,406 | 375 | 4.93/5.0 |
| Helena | 3 | $386,142 | 242 | 4.98/5.0 |
| Sandy Beach | 19 | $382,712 | 314 | 4.66/5.0 |
| Distinctive Beach Rentals | 13 | $368,083 | 51 | 4.60/5.0 |
Analyzing the strategies of top hosts, such as their property selection, pricing, and guest communication, can offer valuable lessons for optimizing your own Airbnb operations in Madeira Beach.
Dive Deeper: Advanced Madeira Beach STR Market Data (2026)
Ready to unlock more insights? AirROI provides access to advanced metrics and comprehensive Airbnb data for Madeira Beach. Explore detailed analytics beyond this report to refine your investment strategy, optimize pricing, and maximize your vacation rental profits.
Explore Advanced MetricsMadeira Beach Short-Term Rental Market Composition (2026): Property & Room Types
Room Type Distribution
Property Type Distribution
Market Composition Insights for Madeira Beach
- The Madeira Beach Airbnb market composition is heavily skewed towards Entire Home/Apt listings, which make up 98.4% of the 729 active rentals. This indicates strong guest preference for privacy and space.
- Looking at the property type distribution in Madeira Beach, Apartment/Condo properties are the most common (88.1%), reflecting the local real estate landscape.
- Smaller segments like hotel/boutique, outdoor/unique, others (combined 1.8%) offer potential for unique stay experiences.
Madeira Beach Airbnb Room Capacity Analysis (2026): Bedroom Distribution
Distribution of Listings by Number of Bedrooms
Room Capacity Insights for Madeira Beach
- The dominant room capacity in Madeira Beach is 2 bedrooms listings, making up 49.5% of the market. This suggests a strong demand for properties suitable for couples or solo travelers.
- Together, 2 bedrooms and 1 bedroom properties represent 73.2% of the active Airbnb listings in Madeira Beach, indicating a high concentration in these sizes.
- A significant 24.5% of listings offer 3+ bedrooms, catering to larger groups and families seeking more space in Madeira Beach.
Madeira Beach Vacation Rental Guest Capacity Trends (2026)
Distribution of Listings by Guest Capacity
Guest Capacity Insights for Madeira Beach
- The most common guest capacity trend in Madeira Beach vacation rentals is listings accommodating 6 guests (39.9%). This suggests the primary traveler segment is likely larger groups.
- Properties designed for 6 guests and 4 guests dominate the Madeira Beach STR market, accounting for 64.9% of listings.
- 59.5% of properties accommodate 6+ guests, serving the market segment for larger families or group travel in Madeira Beach.
- On average, properties in Madeira Beach are equipped to host 5.5 guests.
Madeira Beach Airbnb Booking Patterns (2026): Available vs. Booked Days
Available Days Distribution
Booked Days Distribution
Booking Pattern Insights for Madeira Beach
- The most common availability pattern in Madeira Beach falls within the 271-366 days range, representing 43.8% of listings. This suggests many properties have significant open periods on their calendars.
- Approximately 78.1% of listings show high availability (181+ days open annually), indicating potential for increased bookings or specific owner usage patterns.
- For booked days, the 91-180 days range is most frequent in Madeira Beach (34.4%), reflecting common guest stay durations or potential owner blocking patterns.
- A notable 23.5% of properties secure long booking periods (181+ days booked per year), highlighting successful long-term rental strategies or significant owner usage.
Madeira Beach Airbnb Minimum Stay Requirements Analysis
Distribution of Listings by Minimum Night Requirement
1 Night
41 listings
5.6% of total
2 Nights
78 listings
10.7% of total
3 Nights
47 listings
6.5% of total
4-6 Nights
156 listings
21.5% of total
7-29 Nights
125 listings
17.2% of total
30+ Nights
280 listings
38.5% of total
Key Insights
- The most prevalent minimum stay requirement in Madeira Beach is 30+ Nights, adopted by 38.5% of listings. This highlights the market's preference for longer commitments.
- Very short stays (1-2 nights) are less common (16.3%), suggesting hosts prefer slightly longer bookings to optimize turnover.
- A significant segment (38.5%) caters to monthly stays (30+ nights) in Madeira Beach, pointing to opportunities in the extended-stay market.
Recommendations
- Align with the market by considering a 30+ Nights minimum stay, as 38.5% of Madeira Beach hosts use this setting.
- If feasible, allowing 1-night stays, especially midweek or during low season, could capture last-minute bookings, as only 5.6% currently do.
- Explore offering discounts for stays of 30+ nights to attract the 38.5% of the market seeking extended stays.
- Adjust minimum nights based on seasonality – potentially shorter during low season and longer during peak demand periods in Madeira Beach.
Madeira Beach Airbnb Cancellation Policy Trends Analysis (2026)
Non-refundable
1 listings
0.1% of total
Limited
95 listings
13.1% of total
Super Strict 60 Days
3 listings
0.4% of total
Super Strict 30 Days
57 listings
7.9% of total
Flexible
40 listings
5.5% of total
Moderate
87 listings
12% of total
Firm
280 listings
38.6% of total
Strict
162 listings
22.3% of total
Cancellation Policy Insights for Madeira Beach
- The prevailing Airbnb cancellation policy trend in Madeira Beach is Firm, used by 38.6% of listings.
- A majority (60.9%) of hosts in Madeira Beach utilize Firm or Strict policies, indicating a market where hosts prioritize booking security.
Recommendations for Hosts
- Consider adopting a Firm policy to align with the 38.6% market standard in Madeira Beach.
- Regularly review your cancellation policy against competitors and market demand shifts in Madeira Beach.
Madeira Beach STR Booking Lead Time Analysis (2026)
Average Booking Lead Time by Month
Booking Lead Time Insights for Madeira Beach
- The overall average booking lead time for vacation rentals in Madeira Beach is 82 days.
- Guests book furthest in advance for stays during March (average 125 days), likely coinciding with peak travel demand or local events.
- The shortest booking windows occur for stays in August (average 50 days), indicating more last-minute travel plans during this time.
- Seasonally, Spring (102 days avg.) sees the longest lead times, while Summer (59 days avg.) has the shortest, reflecting typical travel planning cycles.
Recommendations for Hosts
- Use the overall average lead time (82 days) as a baseline for your pricing and availability strategy in Madeira Beach.
- For March stays, consider implementing length-of-stay discounts or slightly higher rates for bookings made less than 125 days out to capitalize on advance planning.
- Target marketing efforts for the Spring season well in advance (at least 102 days) to capture early planners.
- Monitor your own booking lead times against these Madeira Beach averages to identify opportunities for dynamic pricing adjustments.
Popular & Essential Airbnb Amenities in Madeira Beach (2026)
Amenity Prevalence
Amenity Insights for Madeira Beach
- Essential amenities in Madeira Beach that guests expect include: Wifi, TV, Air conditioning, Kitchen, Heating, Free parking on premises, Smoke alarm, Refrigerator. Lacking these (any) could significantly impact bookings.
- Popular amenities like Coffee maker, Microwave are common but not universal. Offering these can provide a competitive edge.
Recommendations for Hosts
- Ensure your listing includes all essential amenities for Madeira Beach: Wifi, TV, Air conditioning, Kitchen, Heating, Free parking on premises, Smoke alarm, Refrigerator.
- Prioritize adding missing essentials: TV, Air conditioning, Kitchen, Heating, Free parking on premises, Smoke alarm, Refrigerator.
- Consider adding popular differentiators like Coffee maker or Microwave to increase appeal.
- Highlight unique or less common amenities you offer (e.g., hot tub, dedicated workspace, EV charger) in your listing description and photos.
- Regularly check competitor amenities in Madeira Beach to stay competitive.
Madeira Beach Airbnb Guest Demographics & Profile Analysis (2026)
Guest Profile Summary for Madeira Beach
- The typical guest profile for Airbnb in Madeira Beach consists of primarily domestic travelers (95%), often arriving from nearby Tampa, typically belonging to the Post-2000s (Gen Z/Alpha) group (50%), primarily speaking English or Spanish.
- Domestic travelers account for 94.8% of guests.
- Key international markets include United States (94.8%) and Canada (2.2%).
- Top languages spoken are English (76.8%) followed by Spanish (10.9%).
- A significant demographic segment is the Post-2000s (Gen Z/Alpha) group, representing 50% of guests.
Recommendations for Hosts
- Target domestic marketing efforts towards travelers from Tampa and New York.
- Tailor amenities and listing descriptions to appeal to the dominant Post-2000s (Gen Z/Alpha) demographic (e.g., highlight fast WiFi, smart home features, local guides).
- Highlight unique local experiences or amenities relevant to the primary guest profile.
- Consider seasonal promotions aligned with peak travel times for key origin markets.
Nearby Short-Term Rental Market Comparison
How does the Madeira Beach Airbnb market stack up against its neighbors? Compare key performance metrics like average monthly revenue, ADR, and occupancy rates in surrounding areas to understand the broader regional STR landscape.
| Market | Active Properties | Monthly Revenue | Daily Rate | Avg. Occupancy |
|---|---|---|---|---|
| Anna Maria island | 587 | $7,996 | $823.96 | 41% |
| Anna Maria | 56 | $6,434 | $692.96 | 52% |
| Reunion | 12 | $6,321 | $580.45 | 44% |
| Boca Grande | 31 | $6,128 | $787.07 | 37% |
| Indian Rocks Beach | 842 | $5,560 | $419.63 | 49% |
| Captiva | 291 | $5,443 | $667.40 | 36% |
| Siesta Key | 1,175 | $5,206 | $518.91 | 42% |
| Belleair Beach | 94 | $5,086 | $339.65 | 53% |
| Bradenton Beach | 122 | $4,977 | $507.12 | 42% |
| Thonotosassa | 17 | $4,309 | $347.75 | 50% |