Loxahatchee Airbnb Market Analysis 2026: Short Term Rental Data & Vacation Rental Statistics in Florida, United States
Is Airbnb profitable in Loxahatchee in 2026? Explore comprehensive Airbnb analytics for Loxahatchee, Florida, United States to uncover income potential. This 2026 STR market report for Loxahatchee, based on AirROI data from February 2025 to January 2026, reveals key trends in the niche market of 41 active listings.
Whether you're considering an Airbnb investment in Loxahatchee, optimizing your existing vacation rental, or exploring rental arbitrage opportunities, understanding the Loxahatchee Airbnb data is crucial. Navigating the high regulation landscape is key to maximizing your short term rental income potential. Let's dive into the specifics.
Key Loxahatchee Airbnb Performance Metrics Overview
Monthly Airbnb Revenue Variations & Income Potential in Loxahatchee (2026)
Understanding the monthly revenue variations for Airbnb listings in Loxahatchee is key to maximizing your short term rental income potential. Seasonality significantly impacts earnings. Our analysis, based on data from the past 12 months, shows that the peak revenue month for STRs in Loxahatchee is typically March, while September often presents the lowest earnings, highlighting opportunities for strategic pricing adjustments during shoulder and low seasons. Explore the typical Airbnb income in Loxahatchee across different performance tiers:
- Best-in-class properties (Top 10%) achieve $6,481+ monthly, often utilizing dynamic pricing and superior guest experiences.
- Strong performing properties (Top 25%) earn $2,793 or more, indicating effective management and desirable locations/amenities.
- Typical properties (Median) generate around $1,322 per month, representing the average market performance.
- Entry-level properties (Bottom 25%) see earnings around $528, often with potential for optimization.
Average Monthly Airbnb Earnings Trend in Loxahatchee
Loxahatchee Airbnb Occupancy Rate Trends (2026)
Maximize your bookings by understanding the Loxahatchee STR occupancy trends. Seasonal demand shifts significantly influence how often properties are booked. Typically, Marchsees the highest demand (peak season occupancy), while November experiences the lowest (low season). Effective strategies, like adjusting minimum stays or offering promotions, can boost occupancy during slower periods. Here's how different property tiers perform in Loxahatchee:
- Best-in-class properties (Top 10%) achieve 80%+ occupancy, indicating high desirability and potentially optimized availability.
- Strong performing properties (Top 25%) maintain 59% or higher occupancy, suggesting good market fit and guest satisfaction.
- Typical properties (Median) have an occupancy rate around 34%.
- Entry-level properties (Bottom 25%) average 16% occupancy, potentially facing higher vacancy.
Average Monthly Occupancy Rate Trend in Loxahatchee
Average Daily Rate (ADR) Airbnb Trends in Loxahatchee (2026)
Effective short term rental pricing strategy in Loxahatchee involves understanding monthly ADR fluctuations. The Average Daily Rate (ADR) for Airbnb in Loxahatchee typically peaks in December and dips lowest during April. Leveraging Airbnb dynamic pricing tools or strategies based on this seasonality can significantly boost revenue. Here's a look at the typical nightly rates achieved:
- Best-in-class properties (Top 10%) command rates of $417+ per night, often due to premium features or locations.
- Strong performing properties (Top 25%) achieve nightly rates of $278 or more.
- Typical properties (Median) charge around $89 per night.
- Entry-level properties (Bottom 25%) earn around $53 per night.
Average Daily Rate (ADR) Trend by Month in Loxahatchee
Get Live Loxahatchee Market Intelligence 👇

Explore Real-time Analytics
Airbnb Seasonality Analysis & Trends in Loxahatchee (2026)
Peak Season (March, February, December)
- Revenue averages $3,637 per month
- Occupancy rates average 51.0%
- Daily rates average $180
Shoulder Season
- Revenue averages $2,081 per month
- Occupancy maintains around 36.2%
- Daily rates hold near $173
Low Season (August, September, November)
- Revenue drops to average $1,764 per month
- Occupancy decreases to average 31.5%
- Daily rates adjust to average $179
Seasonality Insights for Loxahatchee
- The Airbnb seasonality in Loxahatchee shows highly seasonal trends requiring careful strategy. While the sections above show seasonal averages, it's also insightful to look at the extremes:
- During the high season, the absolute peak month showcases Loxahatchee's highest earning potential, with monthly revenues capable of climbing to $4,153, occupancy reaching a high of 64.0%, and ADRs peaking at $220.
- Conversely, the slowest single month of the year, typically falling within the low season, marks the market's lowest point. In this month, revenue might dip to $1,708, occupancy could drop to 25.0%, and ADRs may adjust down to $151.
- Understanding both the seasonal averages and these monthly peaks and troughs in revenue, occupancy, and ADR is crucial for maximizing your Airbnb profit potential in Loxahatchee.
Seasonal Strategies for Maximizing Profit
- Peak Season: Maximize revenue through premium pricing and potentially longer minimum stays. Ensure high availability.
- Low Season: Offer competitive pricing, special promotions (e.g., extended stay discounts), and flexible cancellation policies. Target off-season travelers like remote workers or budget-conscious guests.
- Shoulder Seasons: Implement dynamic pricing that balances peak and low rates. Target weekend travelers or specific events. Offer slightly more flexible terms than peak season.
- Regularly analyze your own performance against these Loxahatchee seasonality benchmarks and adjust your pricing and availability strategy accordingly.
Best Areas for Airbnb Investment in Loxahatchee (2026)
Exploring the top neighborhoods for short-term rentals in Loxahatchee? This section highlights key areas, outlining why they are attractive for hosts and guests, along with notable local attractions. Consider these locations based on your target guest profile and investment strategy.
| Neighborhood / Area | Why Host Here? (Target Guests & Appeal) | Key Attractions & Landmarks |
|---|---|---|
| Loxahatchee Groves | A growing rural community known for its spacious lots, equestrian culture, and natural beauty. Ideal for families and those seeking a quiet retreat close to urban amenities. | Lion Country Safari, Wellington Green Mall, Beeline Highway Park, Winding Trails Park |
| Wellington | Known for its equestrian events and upscale living, Wellington attracts tourists interested in horse shows and luxury residences. A vibrant community with parks and recreation. | Wellington Equestrian Festival, International Polo Club, Wellington Town Center, Parks and nature trails |
| Royal Palm Beach | A family-friendly suburb with plenty of parks and recreational activities. Offers a more affordable suburban lifestyle within close distance of West Palm Beach and its attractions. | Royal Palm Beach Commons Park, Nautical Waterfront Park, Cypress Creek Natural Area, local shopping and dining |
| West Palm Beach | A vibrant city with a lively downtown and waterfront area. Perfect for tourists wanting nightlife, dining, and cultural experiences along with beautiful beaches. | Clematis Street, CityPlace, Norton Museum of Art, South Olive Park, Palm Beach Zoo |
| Boynton Beach | A coastal city with beautiful beaches and a strong sense of community. Popular for those looking for waterfront activities and family-friendly environments. | Boynton Beach Inlet, Gulfstream Park, Oceanfront Park, local markets and shops |
| Greenacres | A quiet city with a mix of residential and commercial spaces. Known for its diversity and community-focused activities, making it a great option for visitors looking to explore. | Greenacres Freedom Park, Lake Worth Lagoon, local events and festivals |
| Lake Worth Beach | A charming, artistic beach town with a bohemian vibe. Attracts visitors looking for a unique beach experience with local art and culture. | Lake Worth Beach, Downtown Lake Worth, Cultural Council of Palm Beach County, local galleries and shops |
| Palm Beach | Renowned for its luxury lifestyle, upscale shopping, and beautiful beaches. A prime location for affluent tourists seeking high-end experiences. | Worth Avenue, The Breakers Palm Beach, Ann Norton Sculpture Gardens, white sandy beaches |
Understanding Airbnb License Requirements & STR Laws in Loxahatchee (2026)
Yes, Loxahatchee, Florida, United States enforces high STR regulations. Obtaining a license and ensuring compliance is almost certainly required according to current 2026 STR laws. Always verify the latest short term rental regulations and Airbnb license requirements directly with local government authorities for Loxahatchee to ensure full compliance before hosting.
(Source: AirROI data, 2026, based on 100% licensed listings)
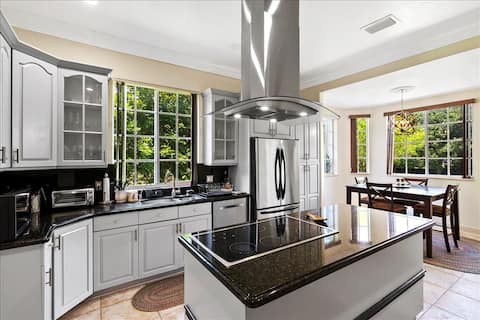
Top Performing Airbnb Properties in Loxahatchee (2026)
Benchmark your potential! Explore examples of top-performing Airbnb properties in Loxahatcheebased on Trailing Twelve Month (TTM) revenue. Analyze their characteristics, revenue, occupancy rate, and ADR to understand what drives success in this market.

Why Is Everyone Obsessed With This House?
Entire Place • 4 bedrooms
7 Bedroom Equestrian Haven
Entire Place • 7 bedrooms

West Royal Palm Villa, Pool/Spa, Privacy, 1.5 acre
Entire Place • 4 bedrooms

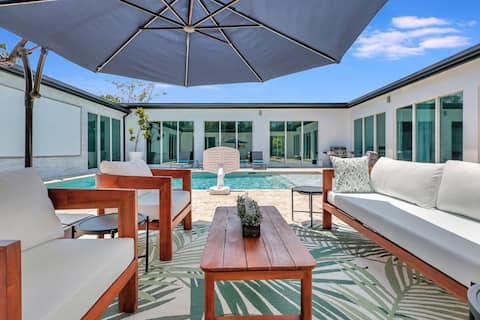
Private Resort-Style Paradise | Dog Friendly!
Entire Place • 2 bedrooms
6BR Sleeps 15 Pool BBQ Firepit Games Stables More!
Entire Place • 6 bedrooms
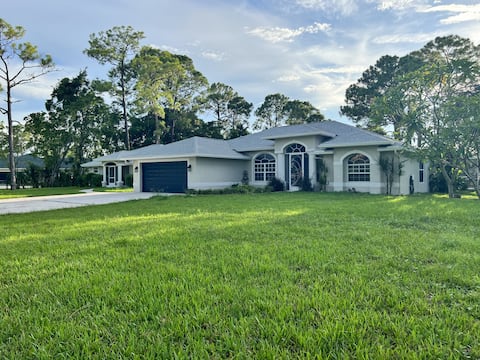
Beautiful Country Getaway
Entire Place • 3 bedrooms
Note: Performance varies based on location, size, amenities, seasonality, and management quality. Data reflects the past 12 months.
Top Performing Airbnb Hosts in Loxahatchee (2026)
Learn from the best! This table showcases top-performing Airbnb hosts in Loxahatchee based on the number of properties managed and estimated total revenue over the past year. Analyze their scale and performance metrics.
| Host Name | Properties | Grossing Revenue | Stay Reviews | Avg Rating |
|---|---|---|---|---|
| Cezar | 1 | $122,678 | 38 | 5.00/5.0 |
| Mike-Jenn-Lisa | 1 | $86,021 | 61 | 4.54/5.0 |
| Tony | 1 | $65,306 | 73 | 4.82/5.0 |
| April | 1 | $55,100 | 39 | 4.95/5.0 |
| Kenneth | 15 | $45,906 | 148 | 4.57/5.0 |
| Grand Welcome West Palm Beach | 1 | $38,107 | 12 | 4.33/5.0 |
| Roseann | 2 | $31,625 | 31 | 4.73/5.0 |
| Adriana Maria | 2 | $29,334 | 54 | 4.97/5.0 |
| Leandro | 1 | $23,736 | 46 | 4.85/5.0 |
| Navila | 1 | $23,393 | 14 | 4.71/5.0 |
Analyzing the strategies of top hosts, such as their property selection, pricing, and guest communication, can offer valuable lessons for optimizing your own Airbnb operations in Loxahatchee.
Dive Deeper: Advanced Loxahatchee STR Market Data (2026)
Ready to unlock more insights? AirROI provides access to advanced metrics and comprehensive Airbnb data for Loxahatchee. Explore detailed analytics beyond this report to refine your investment strategy, optimize pricing, and maximize your vacation rental profits.
Explore Advanced MetricsLoxahatchee Short-Term Rental Market Composition (2026): Property & Room Types
Room Type Distribution
Property Type Distribution
Market Composition Insights for Loxahatchee
- The Loxahatchee Airbnb market composition is heavily skewed towards Entire Home/Apt listings, which make up 70.7% of the 41 active rentals. This indicates strong guest preference for privacy and space.
- Looking at the property type distribution in Loxahatchee, House properties are the most common (43.9%), reflecting the local real estate landscape.
- Houses represent a significant 43.9% portion, catering likely to families or larger groups.
- The presence of 22% Hotel/Boutique listings indicates integration with traditional hospitality.
Loxahatchee Airbnb Room Capacity Analysis (2026): Bedroom Distribution
Distribution of Listings by Number of Bedrooms
Room Capacity Insights for Loxahatchee
- The dominant room capacity in Loxahatchee is 1 bedroom listings, making up 34.1% of the market. This suggests a strong demand for properties suitable for couples or solo travelers.
- Together, 1 bedroom and 3 bedrooms properties represent 48.7% of the active Airbnb listings in Loxahatchee, indicating a high concentration in these sizes.
- A significant 26.8% of listings offer 3+ bedrooms, catering to larger groups and families seeking more space in Loxahatchee.
Loxahatchee Vacation Rental Guest Capacity Trends (2026)
Distribution of Listings by Guest Capacity
Guest Capacity Insights for Loxahatchee
- The most common guest capacity trend in Loxahatchee vacation rentals is listings accommodating 8+ guests (19.5%). This suggests the primary traveler segment is likely larger groups.
- Properties designed for 8+ guests and 4 guests dominate the Loxahatchee STR market, accounting for 36.6% of listings.
- 31.7% of properties accommodate 6+ guests, serving the market segment for larger families or group travel in Loxahatchee.
- On average, properties in Loxahatchee are equipped to host 3.6 guests.
Loxahatchee Airbnb Booking Patterns (2026): Available vs. Booked Days
Available Days Distribution
Booked Days Distribution
Booking Pattern Insights for Loxahatchee
- The most common availability pattern in Loxahatchee falls within the 271-366 days range, representing 65.9% of listings. This suggests many properties have significant open periods on their calendars.
- Approximately 87.9% of listings show high availability (181+ days open annually), indicating potential for increased bookings or specific owner usage patterns.
- For booked days, the 31-90 days range is most frequent in Loxahatchee (34.1%), reflecting common guest stay durations or potential owner blocking patterns.
- A notable 12.2% of properties secure long booking periods (181+ days booked per year), highlighting successful long-term rental strategies or significant owner usage.
Loxahatchee Airbnb Minimum Stay Requirements Analysis
Distribution of Listings by Minimum Night Requirement
1 Night
17 listings
41.5% of total
2 Nights
6 listings
14.6% of total
3 Nights
5 listings
12.2% of total
4-6 Nights
1 listings
2.4% of total
7-29 Nights
2 listings
4.9% of total
30+ Nights
10 listings
24.4% of total
Key Insights
- The most prevalent minimum stay requirement in Loxahatchee is 1 Night, adopted by 41.5% of listings. This highlights the market's preference for shorter, flexible bookings.
- A significant segment (24.4%) caters to monthly stays (30+ nights) in Loxahatchee, pointing to opportunities in the extended-stay market.
Recommendations
- Align with the market by considering a 1 Night minimum stay, as 41.5% of Loxahatchee hosts use this setting.
- Explore offering discounts for stays of 30+ nights to attract the 24.4% of the market seeking extended stays.
- Adjust minimum nights based on seasonality – potentially shorter during low season and longer during peak demand periods in Loxahatchee.
Loxahatchee Airbnb Cancellation Policy Trends Analysis (2026)
Flexible
6 listings
14.6% of total
Moderate
4 listings
9.8% of total
Firm
18 listings
43.9% of total
Strict
13 listings
31.7% of total
Cancellation Policy Insights for Loxahatchee
- The prevailing Airbnb cancellation policy trend in Loxahatchee is Firm, used by 43.9% of listings.
- A majority (75.6%) of hosts in Loxahatchee utilize Firm or Strict policies, indicating a market where hosts prioritize booking security.
Recommendations for Hosts
- Consider adopting a Firm policy to align with the 43.9% market standard in Loxahatchee.
- With 31.7% using Strict terms, this is a viable option in Loxahatchee, particularly for high-value properties or during peak demand periods.
- Regularly review your cancellation policy against competitors and market demand shifts in Loxahatchee.
Loxahatchee STR Booking Lead Time Analysis (2026)
Average Booking Lead Time by Month
Booking Lead Time Insights for Loxahatchee
- The overall average booking lead time for vacation rentals in Loxahatchee is 28 days.
- Guests book furthest in advance for stays during February (average 43 days), likely coinciding with peak travel demand or local events.
- The shortest booking windows occur for stays in April (average 18 days), indicating more last-minute travel plans during this time.
- Seasonally, Winter (38 days avg.) sees the longest lead times, while Fall (20 days avg.) has the shortest, reflecting typical travel planning cycles.
Recommendations for Hosts
- Use the overall average lead time (28 days) as a baseline for your pricing and availability strategy in Loxahatchee.
- For February stays, consider implementing length-of-stay discounts or slightly higher rates for bookings made less than 43 days out to capitalize on advance planning.
- Target marketing efforts for the Winter season well in advance (at least 38 days) to capture early planners.
- Monitor your own booking lead times against these Loxahatchee averages to identify opportunities for dynamic pricing adjustments.
Popular & Essential Airbnb Amenities in Loxahatchee (2026)
Amenity Prevalence
Amenity Insights for Loxahatchee
- Essential amenities in Loxahatchee that guests expect include: Free parking on premises, Wifi. Lacking these (any) could significantly impact bookings.
- Popular amenities like Air conditioning, TV, Washer are common but not universal. Offering these can provide a competitive edge.
Recommendations for Hosts
- Ensure your listing includes all essential amenities for Loxahatchee: Free parking on premises, Wifi.
- Prioritize adding missing essentials: Free parking on premises, Wifi.
- Consider adding popular differentiators like Air conditioning or TV to increase appeal.
- Highlight unique or less common amenities you offer (e.g., hot tub, dedicated workspace, EV charger) in your listing description and photos.
- Regularly check competitor amenities in Loxahatchee to stay competitive.
Loxahatchee Airbnb Guest Demographics & Profile Analysis (2026)
Guest Profile Summary for Loxahatchee
- The typical guest profile for Airbnb in Loxahatchee consists of primarily domestic travelers (89%), often arriving from nearby Riviera Beach, typically belonging to the Post-2000s (Gen Z/Alpha) group (50%), primarily speaking English or Spanish.
- Domestic travelers account for 89.4% of guests.
- Key international markets include United States (89.4%) and Canada (2.6%).
- Top languages spoken are English (71.6%) followed by Spanish (16.8%).
- A significant demographic segment is the Post-2000s (Gen Z/Alpha) group, representing 50% of guests.
Recommendations for Hosts
- Target domestic marketing efforts towards travelers from Riviera Beach and Boynton Beach.
- Tailor amenities and listing descriptions to appeal to the dominant Post-2000s (Gen Z/Alpha) demographic (e.g., highlight fast WiFi, smart home features, local guides).
- Highlight unique local experiences or amenities relevant to the primary guest profile.
- Consider seasonal promotions aligned with peak travel times for key origin markets.
Nearby Short-Term Rental Market Comparison
How does the Loxahatchee Airbnb market stack up against its neighbors? Compare key performance metrics like average monthly revenue, ADR, and occupancy rates in surrounding areas to understand the broader regional STR landscape.
| Market | Active Properties | Monthly Revenue | Daily Rate | Avg. Occupancy |
|---|---|---|---|---|
| Sailfish Point | 19 | $16,709 | $1587.63 | 48% |
| Bal Harbour Village | 37 | $8,846 | $850.63 | 34% |
| Lake Clarke Shores | 26 | $6,710 | $516.52 | 46% |
| Lighthouse Point | 75 | $6,205 | $472.94 | 51% |
| Pinecrest | 11 | $6,117 | $861.24 | 43% |
| North Bay Village | 120 | $6,032 | $561.12 | 44% |
| Tequesta | 43 | $4,920 | $376.96 | 50% |
| Juno Beach | 39 | $4,807 | $377.00 | 47% |
| Parkland | 17 | $4,637 | $369.21 | 47% |
| Ocean Ridge | 14 | $4,588 | $602.78 | 48% |