Lauderdale Lakes Airbnb Market Analysis 2026: Short Term Rental Data & Vacation Rental Statistics in Florida, United States
Is Airbnb profitable in Lauderdale Lakes in 2026? Explore comprehensive Airbnb analytics for Lauderdale Lakes, Florida, United States to uncover income potential. This 2026 STR market report for Lauderdale Lakes, based on AirROI data from February 2025 to January 2026, reveals key trends in the niche market of 46 active listings.
Whether you're considering an Airbnb investment in Lauderdale Lakes, optimizing your existing vacation rental, or exploring rental arbitrage opportunities, understanding the Lauderdale Lakes Airbnb data is crucial. Leveraging the low regulation environment is key to maximizing your short term rental income potential. Let's dive into the specifics.
Key Lauderdale Lakes Airbnb Performance Metrics Overview
Monthly Airbnb Revenue Variations & Income Potential in Lauderdale Lakes (2026)
Understanding the monthly revenue variations for Airbnb listings in Lauderdale Lakes is key to maximizing your short term rental income potential. Seasonality significantly impacts earnings. Our analysis, based on data from the past 12 months, shows that the peak revenue month for STRs in Lauderdale Lakes is typically March, while September often presents the lowest earnings, highlighting opportunities for strategic pricing adjustments during shoulder and low seasons. Explore the typical Airbnb income in Lauderdale Lakes across different performance tiers:
- Best-in-class properties (Top 10%) achieve $5,039+ monthly, often utilizing dynamic pricing and superior guest experiences.
- Strong performing properties (Top 25%) earn $2,847 or more, indicating effective management and desirable locations/amenities.
- Typical properties (Median) generate around $1,416 per month, representing the average market performance.
- Entry-level properties (Bottom 25%) see earnings around $598, often with potential for optimization.
Average Monthly Airbnb Earnings Trend in Lauderdale Lakes
Lauderdale Lakes Airbnb Occupancy Rate Trends (2026)
Maximize your bookings by understanding the Lauderdale Lakes STR occupancy trends. Seasonal demand shifts significantly influence how often properties are booked. Typically, Marchsees the highest demand (peak season occupancy), while November experiences the lowest (low season). Effective strategies, like adjusting minimum stays or offering promotions, can boost occupancy during slower periods. Here's how different property tiers perform in Lauderdale Lakes:
- Best-in-class properties (Top 10%) achieve 86%+ occupancy, indicating high desirability and potentially optimized availability.
- Strong performing properties (Top 25%) maintain 71% or higher occupancy, suggesting good market fit and guest satisfaction.
- Typical properties (Median) have an occupancy rate around 45%.
- Entry-level properties (Bottom 25%) average 25% occupancy, potentially facing higher vacancy.
Average Monthly Occupancy Rate Trend in Lauderdale Lakes
Average Daily Rate (ADR) Airbnb Trends in Lauderdale Lakes (2026)
Effective short term rental pricing strategy in Lauderdale Lakes involves understanding monthly ADR fluctuations. The Average Daily Rate (ADR) for Airbnb in Lauderdale Lakes typically peaks in December and dips lowest during April. Leveraging Airbnb dynamic pricing tools or strategies based on this seasonality can significantly boost revenue. Here's a look at the typical nightly rates achieved:
- Best-in-class properties (Top 10%) command rates of $294+ per night, often due to premium features or locations.
- Strong performing properties (Top 25%) achieve nightly rates of $150 or more.
- Typical properties (Median) charge around $85 per night.
- Entry-level properties (Bottom 25%) earn around $63 per night.
Average Daily Rate (ADR) Trend by Month in Lauderdale Lakes
Get Live Lauderdale Lakes Market Intelligence 👇

Explore Real-time Analytics
Airbnb Seasonality Analysis & Trends in Lauderdale Lakes (2026)
Peak Season (March, December, January)
- Revenue averages $2,866 per month
- Occupancy rates average 54.9%
- Daily rates average $138
Shoulder Season
- Revenue averages $2,128 per month
- Occupancy maintains around 44.0%
- Daily rates hold near $126
Low Season (February, June, September)
- Revenue drops to average $1,932 per month
- Occupancy decreases to average 46.9%
- Daily rates adjust to average $122
Seasonality Insights for Lauderdale Lakes
- The Airbnb seasonality in Lauderdale Lakes shows moderate seasonality with distinct peak and low periods. While the sections above show seasonal averages, it's also insightful to look at the extremes:
- During the high season, the absolute peak month showcases Lauderdale Lakes's highest earning potential, with monthly revenues capable of climbing to $3,150, occupancy reaching a high of 67.5%, and ADRs peaking at $147.
- Conversely, the slowest single month of the year, typically falling within the low season, marks the market's lowest point. In this month, revenue might dip to $1,855, occupancy could drop to 38.2%, and ADRs may adjust down to $116.
- Understanding both the seasonal averages and these monthly peaks and troughs in revenue, occupancy, and ADR is crucial for maximizing your Airbnb profit potential in Lauderdale Lakes.
Seasonal Strategies for Maximizing Profit
- Peak Season: Maximize revenue through premium pricing and potentially longer minimum stays. Ensure high availability.
- Low Season: Offer competitive pricing, special promotions (e.g., extended stay discounts), and flexible cancellation policies. Target off-season travelers like remote workers or budget-conscious guests.
- Shoulder Seasons: Implement dynamic pricing that balances peak and low rates. Target weekend travelers or specific events. Offer slightly more flexible terms than peak season.
- Regularly analyze your own performance against these Lauderdale Lakes seasonality benchmarks and adjust your pricing and availability strategy accordingly.
Best Areas for Airbnb Investment in Lauderdale Lakes (2026)
Exploring the top neighborhoods for short-term rentals in Lauderdale Lakes? This section highlights key areas, outlining why they are attractive for hosts and guests, along with notable local attractions. Consider these locations based on your target guest profile and investment strategy.
| Neighborhood / Area | Why Host Here? (Target Guests & Appeal) | Key Attractions & Landmarks |
|---|---|---|
| Lauderdale Lakes Main Area | Central location with easy access to shopping, dining, and entertainment. Attracts a diverse range of tourists and families looking for comfortable stays close to local amenities. | Lauderdale Lakes Shopping Plaza, Lauderdale Lakes Community Center, Cultural activities |
| West Oakland Park | Family-friendly neighborhood with a mix of residential and recreational spaces. Ideal for families looking for spacious accommodations near parks and schools. | Wells Park, Dillard Park, Community recreation centers |
| Tamarac | Nearby city with a range of condos and apartments available for short-term rentals. Offers a suburban feel while being close to attractions in Broward County. | Tamarac Town Center, Golf courses, Walking paths and parks |
| Sunrise | Close to major shopping centers and the Sawgrass Mills Mall, popular with tourists looking for retail therapy and delicious dining options. | Sawgrass Mills Mall, Westfield Mall, Sunrise Civic Center |
| Fort Lauderdale | Nearby popular tourist destination with beautiful beaches, an array of restaurants, and a vibrant nightlife. Great for attracting vacationers seeking sun and fun. | Fort Lauderdale Beach, Las Olas Boulevard, Broward Center for the Performing Arts |
| Plantation | Quiet suburban area with a range of short-term rental options. Attracts families and business travelers seeking a peaceful environment close to Fort Lauderdale's attractions. | Plantation Historical Museum, Jacaranda Golf Club, Westfield Broward |
| Coral Springs | Family-oriented community with numerous parks and recreational facilities. Great for families visiting the area or those attending events in nearby cities. | Coral Springs Museum of Art, Betty Stravino Park, Coral Square Mall |
| Margate | A smaller suburban area that provides a sense of community while being in proximity to larger cities. Ideal for renters looking for affordable options. | Margate Sports Complex, Calypso Cove Waterpark, Quiet residential neighborhoods |
Understanding Airbnb License Requirements & STR Laws in Lauderdale Lakes (2026)
While Lauderdale Lakes, Florida, United States currently shows low STR regulations, specific Airbnb license requirements might still exist or change. Always verify the latest short term rental regulations and Airbnb license requirements directly with local government authorities for Lauderdale Lakes to ensure full compliance before hosting.
(Source: AirROI data, 2026, finding no licensed listings among those analyzed)
Top Performing Airbnb Properties in Lauderdale Lakes (2026)
Benchmark your potential! Explore examples of top-performing Airbnb properties in Lauderdale Lakesbased on Trailing Twelve Month (TTM) revenue. Analyze their characteristics, revenue, occupancy rate, and ADR to understand what drives success in this market.
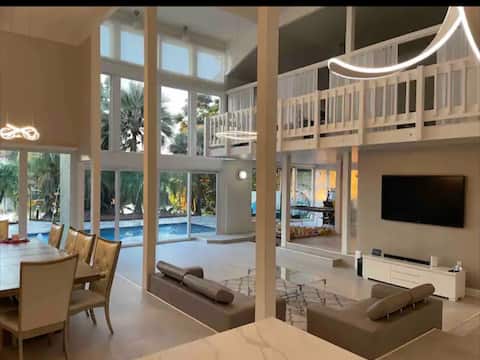
Paradise on the Lake close to Beaches & FLL
Entire Place • 4 bedrooms
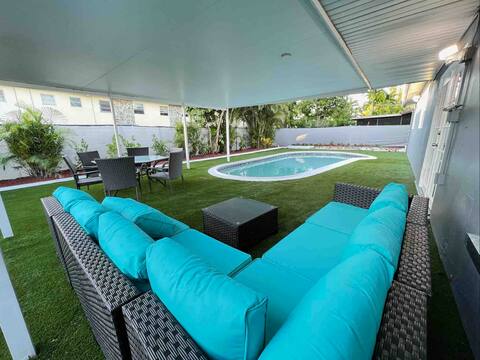
Royal Luxe Pool Home near Ft Laud airport & Beach
Entire Place • 4 bedrooms
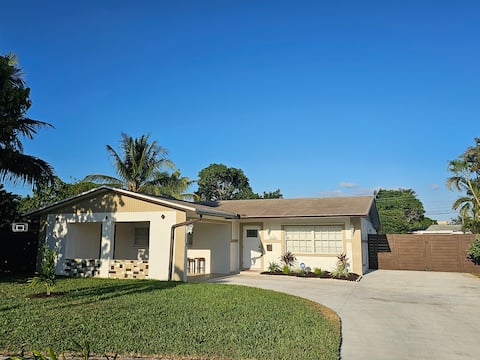
Sunny Goldie in Lauderdale Lakes
Entire Place • 4 bedrooms
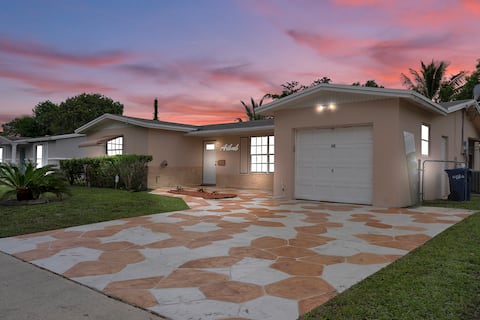
4BR/2B Home W/ Pool and Garage
Entire Place • 4 bedrooms
Private beautiful 3bed rm home
Entire Place • 3 bedrooms

Fully Furnished, Spacious Two Bedroom Condo
Entire Place • 2 bedrooms
Note: Performance varies based on location, size, amenities, seasonality, and management quality. Data reflects the past 12 months.
Top Performing Airbnb Hosts in Lauderdale Lakes (2026)
Learn from the best! This table showcases top-performing Airbnb hosts in Lauderdale Lakes based on the number of properties managed and estimated total revenue over the past year. Analyze their scale and performance metrics.
| Host Name | Properties | Grossing Revenue | Stay Reviews | Avg Rating |
|---|---|---|---|---|
| Malcolm | 1 | $127,131 | 51 | 4.88/5.0 |
| Sunshine Hosting | 1 | $71,398 | 82 | 4.63/5.0 |
| Garon | 1 | $55,360 | 27 | 4.81/5.0 |
| Rony | 1 | $51,507 | 45 | 4.38/5.0 |
| Par | 1 | $39,684 | 51 | 4.88/5.0 |
| Sandor | 1 | $39,366 | 82 | 4.83/5.0 |
| Kevin | 1 | $35,857 | 44 | 4.70/5.0 |
| Shelly | 1 | $34,271 | 143 | 4.76/5.0 |
| Kenny | 3 | $33,890 | 64 | 4.96/5.0 |
| Catalina | 1 | $29,564 | 42 | 4.71/5.0 |
Analyzing the strategies of top hosts, such as their property selection, pricing, and guest communication, can offer valuable lessons for optimizing your own Airbnb operations in Lauderdale Lakes.
Dive Deeper: Advanced Lauderdale Lakes STR Market Data (2026)
Ready to unlock more insights? AirROI provides access to advanced metrics and comprehensive Airbnb data for Lauderdale Lakes. Explore detailed analytics beyond this report to refine your investment strategy, optimize pricing, and maximize your vacation rental profits.
Explore Advanced MetricsLauderdale Lakes Short-Term Rental Market Composition (2026): Property & Room Types
Room Type Distribution
Property Type Distribution
Market Composition Insights for Lauderdale Lakes
- The Lauderdale Lakes Airbnb market composition is heavily skewed towards Private Room listings, which make up 47.8% of the 46 active rentals. This indicates strong guest preference for privacy and space.
- Looking at the property type distribution in Lauderdale Lakes, House properties are the most common (71.7%), reflecting the local real estate landscape.
- Houses represent a significant 71.7% portion, catering likely to families or larger groups.
- The presence of 6.5% Hotel/Boutique listings indicates integration with traditional hospitality.
- Smaller segments like others (combined 2.2%) offer potential for unique stay experiences.
Lauderdale Lakes Airbnb Room Capacity Analysis (2026): Bedroom Distribution
Distribution of Listings by Number of Bedrooms
Room Capacity Insights for Lauderdale Lakes
- The dominant room capacity in Lauderdale Lakes is 1 bedroom listings, making up 19.6% of the market. This suggests a strong demand for properties suitable for couples or solo travelers.
- Together, 1 bedroom and 2 bedrooms properties represent 32.6% of the active Airbnb listings in Lauderdale Lakes, indicating a high concentration in these sizes.
Lauderdale Lakes Vacation Rental Guest Capacity Trends (2026)
Distribution of Listings by Guest Capacity
Guest Capacity Insights for Lauderdale Lakes
- The most common guest capacity trend in Lauderdale Lakes vacation rentals is listings accommodating 4 guests (13%). This suggests the primary traveler segment is likely small families or groups.
- Properties designed for 4 guests and 6 guests dominate the Lauderdale Lakes STR market, accounting for 23.9% of listings.
- 21.8% of properties accommodate 6+ guests, serving the market segment for larger families or group travel in Lauderdale Lakes.
- On average, properties in Lauderdale Lakes are equipped to host 2.3 guests.
Lauderdale Lakes Airbnb Booking Patterns (2026): Available vs. Booked Days
Available Days Distribution
Booked Days Distribution
Booking Pattern Insights for Lauderdale Lakes
- The most common availability pattern in Lauderdale Lakes falls within the 271-366 days range, representing 52.2% of listings. This suggests many properties have significant open periods on their calendars.
- Approximately 80.5% of listings show high availability (181+ days open annually), indicating potential for increased bookings or specific owner usage patterns.
- For booked days, the 91-180 days range is most frequent in Lauderdale Lakes (30.4%), reflecting common guest stay durations or potential owner blocking patterns.
- A notable 19.5% of properties secure long booking periods (181+ days booked per year), highlighting successful long-term rental strategies or significant owner usage.
Lauderdale Lakes Airbnb Minimum Stay Requirements Analysis
Distribution of Listings by Minimum Night Requirement
1 Night
18 listings
39.1% of total
2 Nights
9 listings
19.6% of total
3 Nights
2 listings
4.3% of total
4-6 Nights
4 listings
8.7% of total
7-29 Nights
3 listings
6.5% of total
30+ Nights
10 listings
21.7% of total
Key Insights
- The most prevalent minimum stay requirement in Lauderdale Lakes is 1 Night, adopted by 39.1% of listings. This highlights the market's preference for shorter, flexible bookings.
- A significant segment (21.7%) caters to monthly stays (30+ nights) in Lauderdale Lakes, pointing to opportunities in the extended-stay market.
Recommendations
- Align with the market by considering a 1 Night minimum stay, as 39.1% of Lauderdale Lakes hosts use this setting.
- Explore offering discounts for stays of 30+ nights to attract the 21.7% of the market seeking extended stays.
- Adjust minimum nights based on seasonality – potentially shorter during low season and longer during peak demand periods in Lauderdale Lakes.
Lauderdale Lakes Airbnb Cancellation Policy Trends Analysis (2026)
Limited
2 listings
4.3% of total
Flexible
19 listings
41.3% of total
Moderate
12 listings
26.1% of total
Firm
6 listings
13% of total
Strict
7 listings
15.2% of total
Cancellation Policy Insights for Lauderdale Lakes
- The prevailing Airbnb cancellation policy trend in Lauderdale Lakes is Flexible, used by 41.3% of listings.
- There's a relatively balanced mix between guest-friendly (67.4%) and stricter (28.2%) policies, offering choices for different guest needs.
Recommendations for Hosts
- Consider adopting a Flexible policy to align with the 41.3% market standard in Lauderdale Lakes.
- Regularly review your cancellation policy against competitors and market demand shifts in Lauderdale Lakes.
Lauderdale Lakes STR Booking Lead Time Analysis (2026)
Average Booking Lead Time by Month
Booking Lead Time Insights for Lauderdale Lakes
- The overall average booking lead time for vacation rentals in Lauderdale Lakes is 29 days.
- Guests book furthest in advance for stays during January (average 40 days), likely coinciding with peak travel demand or local events.
- The shortest booking windows occur for stays in September (average 13 days), indicating more last-minute travel plans during this time.
- Seasonally, Winter (35 days avg.) sees the longest lead times, while Fall (23 days avg.) has the shortest, reflecting typical travel planning cycles.
Recommendations for Hosts
- Use the overall average lead time (29 days) as a baseline for your pricing and availability strategy in Lauderdale Lakes.
- For January stays, consider implementing length-of-stay discounts or slightly higher rates for bookings made less than 40 days out to capitalize on advance planning.
- During September, focus on last-minute booking availability and promotions, as guests book with very short notice (13 days avg.).
- Target marketing efforts for the Winter season well in advance (at least 35 days) to capture early planners.
- Monitor your own booking lead times against these Lauderdale Lakes averages to identify opportunities for dynamic pricing adjustments.
Popular & Essential Airbnb Amenities in Lauderdale Lakes (2026)
Amenity Prevalence
Amenity Insights for Lauderdale Lakes
- Essential amenities in Lauderdale Lakes that guests expect include: Wifi, Air conditioning, Free parking on premises, TV. Lacking these (any) could significantly impact bookings.
- Popular amenities like Smoke alarm, Kitchen, Washer are common but not universal. Offering these can provide a competitive edge.
Recommendations for Hosts
- Ensure your listing includes all essential amenities for Lauderdale Lakes: Wifi, Air conditioning, Free parking on premises, TV.
- Prioritize adding missing essentials: TV.
- Consider adding popular differentiators like Smoke alarm or Kitchen to increase appeal.
- Highlight unique or less common amenities you offer (e.g., hot tub, dedicated workspace, EV charger) in your listing description and photos.
- Regularly check competitor amenities in Lauderdale Lakes to stay competitive.
Lauderdale Lakes Airbnb Guest Demographics & Profile Analysis (2026)
Guest Profile Summary for Lauderdale Lakes
- The typical guest profile for Airbnb in Lauderdale Lakes consists of primarily domestic travelers (73%), often arriving from nearby Fort Lauderdale, typically belonging to the Post-2000s (Gen Z/Alpha) group (50%), primarily speaking English or Spanish.
- Domestic travelers account for 73.3% of guests.
- Key international markets include United States (73.3%) and Canada (4.1%).
- Top languages spoken are English (56.4%) followed by Spanish (18.6%).
- A significant demographic segment is the Post-2000s (Gen Z/Alpha) group, representing 50% of guests.
Recommendations for Hosts
- Target domestic marketing efforts towards travelers from Fort Lauderdale and New York.
- Tailor amenities and listing descriptions to appeal to the dominant Post-2000s (Gen Z/Alpha) demographic (e.g., highlight fast WiFi, smart home features, local guides).
- Highlight unique local experiences or amenities relevant to the primary guest profile.
- Consider seasonal promotions aligned with peak travel times for key origin markets.
Nearby Short-Term Rental Market Comparison
How does the Lauderdale Lakes Airbnb market stack up against its neighbors? Compare key performance metrics like average monthly revenue, ADR, and occupancy rates in surrounding areas to understand the broader regional STR landscape.
| Market | Active Properties | Monthly Revenue | Daily Rate | Avg. Occupancy |
|---|---|---|---|---|
| Sailfish Point | 19 | $16,709 | $1587.63 | 48% |
| Bal Harbour Village | 37 | $8,846 | $850.63 | 34% |
| Lake Clarke Shores | 26 | $6,710 | $516.52 | 46% |
| Lighthouse Point | 75 | $6,205 | $472.94 | 51% |
| Pinecrest | 11 | $6,117 | $861.24 | 43% |
| North Bay Village | 120 | $6,032 | $561.12 | 44% |
| Tequesta | 43 | $4,920 | $376.96 | 50% |
| Juno Beach | 39 | $4,807 | $377.00 | 47% |
| Parkland | 17 | $4,637 | $369.21 | 47% |
| Ocean Ridge | 14 | $4,588 | $602.78 | 48% |