Lake Placid Airbnb Market Analysis 2026: Short Term Rental Data & Vacation Rental Statistics in Florida, United States
Is Airbnb profitable in Lake Placid in 2026? Explore comprehensive Airbnb analytics for Lake Placid, Florida, United States to uncover income potential. This 2026 STR market report for Lake Placid, based on AirROI data from February 2025 to January 2026, reveals key trends in the niche market of 174 active listings.
Whether you're considering an Airbnb investment in Lake Placid, optimizing your existing vacation rental, or exploring rental arbitrage opportunities, understanding the Lake Placid Airbnb data is crucial. Leveraging the low regulation environment is key to maximizing your short term rental income potential. Let's dive into the specifics.
Key Lake Placid Airbnb Performance Metrics Overview
Monthly Airbnb Revenue Variations & Income Potential in Lake Placid (2026)
Understanding the monthly revenue variations for Airbnb listings in Lake Placid is key to maximizing your short term rental income potential. Seasonality significantly impacts earnings. Our analysis, based on data from the past 12 months, shows that the peak revenue month for STRs in Lake Placid is typically March, while October often presents the lowest earnings, highlighting opportunities for strategic pricing adjustments during shoulder and low seasons. Explore the typical Airbnb income in Lake Placid across different performance tiers:
- Best-in-class properties (Top 10%) achieve $7,007+ monthly, often utilizing dynamic pricing and superior guest experiences.
- Strong performing properties (Top 25%) earn $4,381 or more, indicating effective management and desirable locations/amenities.
- Typical properties (Median) generate around $2,546 per month, representing the average market performance.
- Entry-level properties (Bottom 25%) see earnings around $1,244, often with potential for optimization.
Average Monthly Airbnb Earnings Trend in Lake Placid
Lake Placid Airbnb Occupancy Rate Trends (2026)
Maximize your bookings by understanding the Lake Placid STR occupancy trends. Seasonal demand shifts significantly influence how often properties are booked. Typically, Februarysees the highest demand (peak season occupancy), while October experiences the lowest (low season). Effective strategies, like adjusting minimum stays or offering promotions, can boost occupancy during slower periods. Here's how different property tiers perform in Lake Placid:
- Best-in-class properties (Top 10%) achieve 74%+ occupancy, indicating high desirability and potentially optimized availability.
- Strong performing properties (Top 25%) maintain 57% or higher occupancy, suggesting good market fit and guest satisfaction.
- Typical properties (Median) have an occupancy rate around 36%.
- Entry-level properties (Bottom 25%) average 19% occupancy, potentially facing higher vacancy.
Average Monthly Occupancy Rate Trend in Lake Placid
Average Daily Rate (ADR) Airbnb Trends in Lake Placid (2026)
Effective short term rental pricing strategy in Lake Placid involves understanding monthly ADR fluctuations. The Average Daily Rate (ADR) for Airbnb in Lake Placid typically peaks in March and dips lowest during April. Leveraging Airbnb dynamic pricing tools or strategies based on this seasonality can significantly boost revenue. Here's a look at the typical nightly rates achieved:
- Best-in-class properties (Top 10%) command rates of $514+ per night, often due to premium features or locations.
- Strong performing properties (Top 25%) achieve nightly rates of $307 or more.
- Typical properties (Median) charge around $214 per night.
- Entry-level properties (Bottom 25%) earn around $145 per night.
Average Daily Rate (ADR) Trend by Month in Lake Placid
Get Live Lake Placid Market Intelligence 👇

Explore Real-time Analytics
Airbnb Seasonality Analysis & Trends in Lake Placid (2026)
Peak Season (March, February, July)
- Revenue averages $4,686 per month
- Occupancy rates average 53.6%
- Daily rates average $270
Shoulder Season
- Revenue averages $3,242 per month
- Occupancy maintains around 36.6%
- Daily rates hold near $269
Low Season (April, September, October)
- Revenue drops to average $2,446 per month
- Occupancy decreases to average 30.7%
- Daily rates adjust to average $261
Seasonality Insights for Lake Placid
- The Airbnb seasonality in Lake Placid shows highly seasonal trends requiring careful strategy. While the sections above show seasonal averages, it's also insightful to look at the extremes:
- During the high season, the absolute peak month showcases Lake Placid's highest earning potential, with monthly revenues capable of climbing to $5,450, occupancy reaching a high of 63.1%, and ADRs peaking at $296.
- Conversely, the slowest single month of the year, typically falling within the low season, marks the market's lowest point. In this month, revenue might dip to $2,351, occupancy could drop to 27.0%, and ADRs may adjust down to $245.
- Understanding both the seasonal averages and these monthly peaks and troughs in revenue, occupancy, and ADR is crucial for maximizing your Airbnb profit potential in Lake Placid.
Seasonal Strategies for Maximizing Profit
- Peak Season: Maximize revenue through premium pricing and potentially longer minimum stays. Ensure high availability.
- Low Season: Offer competitive pricing, special promotions (e.g., extended stay discounts), and flexible cancellation policies. Target off-season travelers like remote workers or budget-conscious guests.
- Shoulder Seasons: Implement dynamic pricing that balances peak and low rates. Target weekend travelers or specific events. Offer slightly more flexible terms than peak season.
- Regularly analyze your own performance against these Lake Placid seasonality benchmarks and adjust your pricing and availability strategy accordingly.
Best Areas for Airbnb Investment in Lake Placid (2026)
Exploring the top neighborhoods for short-term rentals in Lake Placid? This section highlights key areas, outlining why they are attractive for hosts and guests, along with notable local attractions. Consider these locations based on your target guest profile and investment strategy.
| Neighborhood / Area | Why Host Here? (Target Guests & Appeal) | Key Attractions & Landmarks |
|---|---|---|
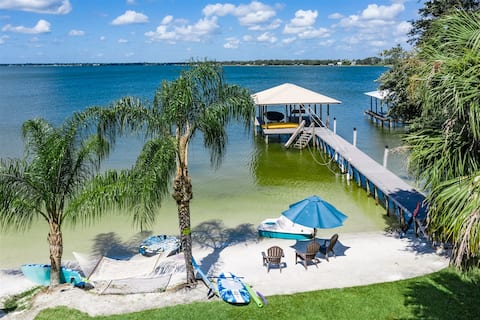
| Lakefront | Scenic area with stunning views of Lake Placid. Attracts visitors for water activities and relaxation., providing an ideal setting for vacation rentals. | Lake Placid Big Lake, Placid Lake State Park, Boating and fishing opportunities, Water sports activities, Local dining |
| Downtown Lake Placid | Vibrant town center with shops, restaurants, and local businesses. Perfect for tourists wanting to experience local culture and amenities. | Lake Placid Mural Society, Local cafes and boutiques, Annual Blueberry Festival, Community events and fairs, Historic buildings |
| Highland Lakes | Peaceful residential area near beautiful lakes, attracting families and nature lovers for outdoor activities and retreat getaways. | Highland Lakes, Lakeside parks, Hiking trails, Wildlife viewing, Fishing spots |
| Lake June | Charming area around Lake June in Winter with serene beauty ideal for a relaxing vacation rental experience. | Lake June, Picnic areas, Nature trails, Water activities, Local wildlife |
| Sunset View | A picturesque neighborhood known for breathtaking sunset views over the lakes, appealing to romantic getaways and nature enthusiasts. | Sunset Park, Scenic views, Photography spots, Fishing access, Nature trails |
| Country Club Estates | Upscale neighborhood with golf courses and spacious homes, ideal for families or groups looking for a more luxurious stay. | Golf Club Estates, Parks, Family-friendly activities, Nearby dining, Scenic drives |
| Placid Lakes | Quiet community with numerous lakes, perfect for those seeking tranquility and ample water recreational activities. | Placid Lakes, Outdoor sports, Fishing and boating, Local dining, Nature trails |
| Sebring | Nearby Sebring offers additional attractions like the Sebring International Raceway and various outdoor activities, making it a convenient base for exploring multiple lakes. | Sebring International Raceway, Sebring Downtown, Shopping, Cultural events, Outdoor adventures |
Understanding Airbnb License Requirements & STR Laws in Lake Placid (2026)
While Lake Placid, Florida, United States currently shows low STR regulations, specific Airbnb license requirements might still exist or change. Always verify the latest short term rental regulations and Airbnb license requirements directly with local government authorities for Lake Placid to ensure full compliance before hosting.
(Source: AirROI data, 2026, finding no licensed listings among those analyzed)
Top Performing Airbnb Properties in Lake Placid (2026)
Benchmark your potential! Explore examples of top-performing Airbnb properties in Lake Placidbased on Trailing Twelve Month (TTM) revenue. Analyze their characteristics, revenue, occupancy rate, and ADR to understand what drives success in this market.
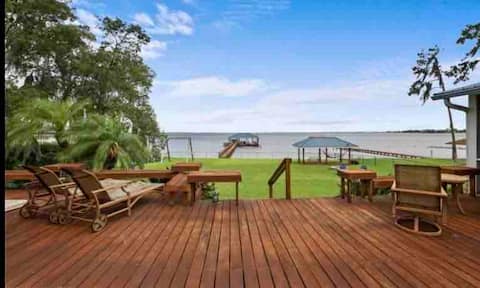
Lake front Floridian Oasis
Entire Place • 6 bedrooms
Lake Beach 7 Bedroom, 4 full Bath + 3rd floor play
Entire Place • 7 bedrooms
Lakefront Home, 2 King Beds, Kayak, Large Kitchen
Entire Place • 5 bedrooms
Private Old Florida Lake House Retreat
Entire Place • 5 bedrooms

Lakefront Home w/ Private Dock + Water Trampoline
Entire Place • 4 bedrooms
Family Ties Lake Front Home 7/7 game room & beach
Entire Place • 7 bedrooms
Note: Performance varies based on location, size, amenities, seasonality, and management quality. Data reflects the past 12 months.
Top Performing Airbnb Hosts in Lake Placid (2026)
Learn from the best! This table showcases top-performing Airbnb hosts in Lake Placid based on the number of properties managed and estimated total revenue over the past year. Analyze their scale and performance metrics.
| Host Name | Properties | Grossing Revenue | Stay Reviews | Avg Rating |
|---|---|---|---|---|
| Javier | 1 | $194,444 | 25 | 5.00/5.0 |
| Evolve | 6 | $171,732 | 241 | 4.90/5.0 |
| Erik | 1 | $139,843 | 182 | 4.96/5.0 |
| Marcel | 1 | $135,576 | 57 | 4.93/5.0 |
| Roby | 1 | $129,470 | 70 | 4.96/5.0 |
| Paris | 1 | $129,035 | 58 | 4.98/5.0 |
| Evolve | 5 | $124,252 | 38 | 4.72/5.0 |
| Lisa Anne | 1 | $102,629 | 36 | 4.89/5.0 |
| Carlos | 1 | $97,407 | 52 | 4.96/5.0 |
| Zack | 1 | $91,378 | 57 | 4.95/5.0 |
Analyzing the strategies of top hosts, such as their property selection, pricing, and guest communication, can offer valuable lessons for optimizing your own Airbnb operations in Lake Placid.
Dive Deeper: Advanced Lake Placid STR Market Data (2026)
Ready to unlock more insights? AirROI provides access to advanced metrics and comprehensive Airbnb data for Lake Placid. Explore detailed analytics beyond this report to refine your investment strategy, optimize pricing, and maximize your vacation rental profits.
Explore Advanced MetricsLake Placid Short-Term Rental Market Composition (2026): Property & Room Types
Room Type Distribution
Property Type Distribution
Market Composition Insights for Lake Placid
- The Lake Placid Airbnb market composition is heavily skewed towards Entire Home/Apt listings, which make up 99.4% of the 174 active rentals. This indicates strong guest preference for privacy and space.
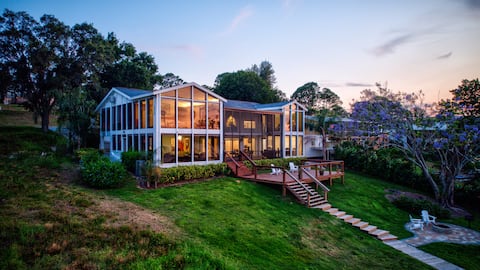
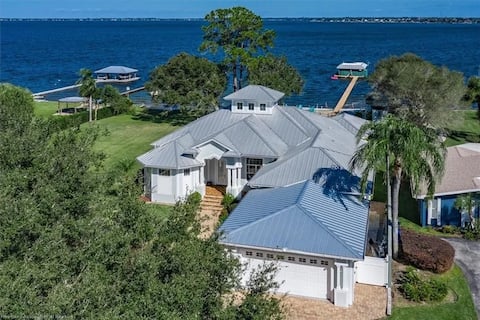
- Looking at the property type distribution in Lake Placid, House properties are the most common (89.7%), reflecting the local real estate landscape.
- Houses represent a significant 89.7% portion, catering likely to families or larger groups.
- Smaller segments like apartment/condo, hotel/boutique, others, unique stays (combined 5.2%) offer potential for unique stay experiences.
Lake Placid Airbnb Room Capacity Analysis (2026): Bedroom Distribution
Distribution of Listings by Number of Bedrooms
Room Capacity Insights for Lake Placid
- The dominant room capacity in Lake Placid is 3 bedrooms listings, making up 41.4% of the market. This suggests a strong demand for properties suitable for families or small groups.
- Together, 3 bedrooms and 2 bedrooms properties represent 66.7% of the active Airbnb listings in Lake Placid, indicating a high concentration in these sizes.
- A significant 64.9% of listings offer 3+ bedrooms, catering to larger groups and families seeking more space in Lake Placid.
Lake Placid Vacation Rental Guest Capacity Trends (2026)
Distribution of Listings by Guest Capacity
Guest Capacity Insights for Lake Placid
- The most common guest capacity trend in Lake Placid vacation rentals is listings accommodating 8+ guests (48.3%). This suggests the primary traveler segment is likely larger groups.
- Properties designed for 8+ guests and 6 guests dominate the Lake Placid STR market, accounting for 65.5% of listings.
- 71.8% of properties accommodate 6+ guests, serving the market segment for larger families or group travel in Lake Placid.
- On average, properties in Lake Placid are equipped to host 6.3 guests.
Lake Placid Airbnb Booking Patterns (2026): Available vs. Booked Days
Available Days Distribution
Booked Days Distribution
Booking Pattern Insights for Lake Placid
- The most common availability pattern in Lake Placid falls within the 271-366 days range, representing 47.1% of listings. This suggests many properties have significant open periods on their calendars.
- Approximately 83.9% of listings show high availability (181+ days open annually), indicating potential for increased bookings or specific owner usage patterns.
- For booked days, the 91-180 days range is most frequent in Lake Placid (35.1%), reflecting common guest stay durations or potential owner blocking patterns.
- A notable 18.4% of properties secure long booking periods (181+ days booked per year), highlighting successful long-term rental strategies or significant owner usage.
Lake Placid Airbnb Minimum Stay Requirements Analysis
Distribution of Listings by Minimum Night Requirement
1 Night
20 listings
11.5% of total
2 Nights
48 listings
27.6% of total
3 Nights
34 listings
19.5% of total
4-6 Nights
13 listings
7.5% of total
7-29 Nights
9 listings
5.2% of total
30+ Nights
50 listings
28.7% of total
Key Insights
- The most prevalent minimum stay requirement in Lake Placid is 30+ Nights, adopted by 28.7% of listings. This highlights the market's preference for longer commitments.
- A significant segment (28.7%) caters to monthly stays (30+ nights) in Lake Placid, pointing to opportunities in the extended-stay market.
Recommendations
- Align with the market by considering a 30+ Nights minimum stay, as 28.7% of Lake Placid hosts use this setting.
- If feasible, allowing 1-night stays, especially midweek or during low season, could capture last-minute bookings, as only 11.5% currently do.
- Explore offering discounts for stays of 30+ nights to attract the 28.7% of the market seeking extended stays.
- Adjust minimum nights based on seasonality – potentially shorter during low season and longer during peak demand periods in Lake Placid.
Lake Placid Airbnb Cancellation Policy Trends Analysis (2026)
Super Strict 30 Days
6 listings
3.4% of total
Limited
7 listings
4% of total
Flexible
42 listings
24.1% of total
Moderate
31 listings
17.8% of total
Firm
65 listings
37.4% of total
Strict
23 listings
13.2% of total
Cancellation Policy Insights for Lake Placid
- The prevailing Airbnb cancellation policy trend in Lake Placid is Firm, used by 37.4% of listings.
- A majority (50.6%) of hosts in Lake Placid utilize Firm or Strict policies, indicating a market where hosts prioritize booking security.
Recommendations for Hosts
- Consider adopting a Firm policy to align with the 37.4% market standard in Lake Placid.
- Using a Strict policy might deter some guests, as only 13.2% of listings use it. Evaluate if potential revenue protection outweighs possible lower booking rates.
- Regularly review your cancellation policy against competitors and market demand shifts in Lake Placid.
Lake Placid STR Booking Lead Time Analysis (2026)
Average Booking Lead Time by Month
Booking Lead Time Insights for Lake Placid
- The overall average booking lead time for vacation rentals in Lake Placid is 54 days.
- Guests book furthest in advance for stays during March (average 90 days), likely coinciding with peak travel demand or local events.
- The shortest booking windows occur for stays in September (average 25 days), indicating more last-minute travel plans during this time.
- Seasonally, Winter (62 days avg.) sees the longest lead times, while Fall (32 days avg.) has the shortest, reflecting typical travel planning cycles.
Recommendations for Hosts
- Use the overall average lead time (54 days) as a baseline for your pricing and availability strategy in Lake Placid.
- For March stays, consider implementing length-of-stay discounts or slightly higher rates for bookings made less than 90 days out to capitalize on advance planning.
- Target marketing efforts for the Winter season well in advance (at least 62 days) to capture early planners.
- Monitor your own booking lead times against these Lake Placid averages to identify opportunities for dynamic pricing adjustments.
Popular & Essential Airbnb Amenities in Lake Placid (2026)
Amenity Prevalence
Amenity Insights for Lake Placid
- Essential amenities in Lake Placid that guests expect include: Air conditioning, TV, Free parking on premises, Wifi, Kitchen. Lacking these (any) could significantly impact bookings.
- Popular amenities like Smoke alarm, Washer, Refrigerator are common but not universal. Offering these can provide a competitive edge.
Recommendations for Hosts
- Ensure your listing includes all essential amenities for Lake Placid: Air conditioning, TV, Free parking on premises, Wifi, Kitchen.
- Prioritize adding missing essentials: Air conditioning, TV, Free parking on premises, Wifi, Kitchen.
- Consider adding popular differentiators like Smoke alarm or Washer to increase appeal.
- Highlight unique or less common amenities you offer (e.g., hot tub, dedicated workspace, EV charger) in your listing description and photos.
- Regularly check competitor amenities in Lake Placid to stay competitive.
Lake Placid Airbnb Guest Demographics & Profile Analysis (2026)
Guest Profile Summary for Lake Placid
- The typical guest profile for Airbnb in Lake Placid consists of primarily domestic travelers (96%), often arriving from nearby Miami, typically belonging to the Post-2000s (Gen Z/Alpha) group (50%), primarily speaking English or Spanish.
- Domestic travelers account for 95.9% of guests.
- Key international markets include United States (95.9%) and Canada (1.4%).
- Top languages spoken are English (68.2%) followed by Spanish (20.4%).
- A significant demographic segment is the Post-2000s (Gen Z/Alpha) group, representing 50% of guests.
Recommendations for Hosts
- Target domestic marketing efforts towards travelers from Miami and Fort Lauderdale.
- Tailor amenities and listing descriptions to appeal to the dominant Post-2000s (Gen Z/Alpha) demographic (e.g., highlight fast WiFi, smart home features, local guides).
- Highlight unique local experiences or amenities relevant to the primary guest profile.
- Consider seasonal promotions aligned with peak travel times for key origin markets.
Nearby Short-Term Rental Market Comparison
How does the Lake Placid Airbnb market stack up against its neighbors? Compare key performance metrics like average monthly revenue, ADR, and occupancy rates in surrounding areas to understand the broader regional STR landscape.
| Market | Active Properties | Monthly Revenue | Daily Rate | Avg. Occupancy |
|---|---|---|---|---|
| Sailfish Point | 19 | $16,709 | $1587.63 | 48% |
| Anna Maria island | 587 | $7,996 | $823.96 | 41% |
| Lake Clarke Shores | 26 | $6,710 | $516.52 | 46% |
| Anna Maria | 56 | $6,434 | $692.96 | 52% |
| Reunion | 12 | $6,321 | $580.45 | 44% |
| Lighthouse Point | 75 | $6,205 | $472.94 | 51% |
| Boca Grande | 31 | $6,128 | $787.07 | 37% |
| Indian Rocks Beach | 842 | $5,560 | $419.63 | 49% |
| Captiva | 291 | $5,443 | $667.40 | 36% |
| Melbourne Beach | 275 | $5,384 | $488.83 | 43% |