Lake Mary Airbnb Market Analysis 2026: Short Term Rental Data & Vacation Rental Statistics in Florida, United States
Is Airbnb profitable in Lake Mary in 2026? Explore comprehensive Airbnb analytics for Lake Mary, Florida, United States to uncover income potential. This 2026 STR market report for Lake Mary, based on AirROI data from February 2025 to January 2026, reveals key trends in the niche market of 41 active listings.
Whether you're considering an Airbnb investment in Lake Mary, optimizing your existing vacation rental, or exploring rental arbitrage opportunities, understanding the Lake Mary Airbnb data is crucial. Leveraging the low regulation environment is key to maximizing your short term rental income potential. Let's dive into the specifics.
Key Lake Mary Airbnb Performance Metrics Overview
Monthly Airbnb Revenue Variations & Income Potential in Lake Mary (2026)
Understanding the monthly revenue variations for Airbnb listings in Lake Mary is key to maximizing your short term rental income potential. Seasonality significantly impacts earnings. Our analysis, based on data from the past 12 months, shows that the peak revenue month for STRs in Lake Mary is typically December, while October often presents the lowest earnings, highlighting opportunities for strategic pricing adjustments during shoulder and low seasons. Explore the typical Airbnb income in Lake Mary across different performance tiers:
- Best-in-class properties (Top 10%) achieve $6,422+ monthly, often utilizing dynamic pricing and superior guest experiences.
- Strong performing properties (Top 25%) earn $4,121 or more, indicating effective management and desirable locations/amenities.
- Typical properties (Median) generate around $2,576 per month, representing the average market performance.
- Entry-level properties (Bottom 25%) see earnings around $1,355, often with potential for optimization.
Average Monthly Airbnb Earnings Trend in Lake Mary
Lake Mary Airbnb Occupancy Rate Trends (2026)
Maximize your bookings by understanding the Lake Mary STR occupancy trends. Seasonal demand shifts significantly influence how often properties are booked. Typically, Februarysees the highest demand (peak season occupancy), while January experiences the lowest (low season). Effective strategies, like adjusting minimum stays or offering promotions, can boost occupancy during slower periods. Here's how different property tiers perform in Lake Mary:
- Best-in-class properties (Top 10%) achieve 84%+ occupancy, indicating high desirability and potentially optimized availability.
- Strong performing properties (Top 25%) maintain 73% or higher occupancy, suggesting good market fit and guest satisfaction.
- Typical properties (Median) have an occupancy rate around 52%.
- Entry-level properties (Bottom 25%) average 28% occupancy, potentially facing higher vacancy.
Average Monthly Occupancy Rate Trend in Lake Mary
Average Daily Rate (ADR) Airbnb Trends in Lake Mary (2026)
Effective short term rental pricing strategy in Lake Mary involves understanding monthly ADR fluctuations. The Average Daily Rate (ADR) for Airbnb in Lake Mary typically peaks in December and dips lowest during April. Leveraging Airbnb dynamic pricing tools or strategies based on this seasonality can significantly boost revenue. Here's a look at the typical nightly rates achieved:
- Best-in-class properties (Top 10%) command rates of $312+ per night, often due to premium features or locations.
- Strong performing properties (Top 25%) achieve nightly rates of $235 or more.
- Typical properties (Median) charge around $151 per night.
- Entry-level properties (Bottom 25%) earn around $102 per night.
Average Daily Rate (ADR) Trend by Month in Lake Mary
Get Live Lake Mary Market Intelligence 👇

Explore Real-time Analytics
Airbnb Seasonality Analysis & Trends in Lake Mary (2026)
Peak Season (December, June, August)
- Revenue averages $3,579 per month
- Occupancy rates average 55.9%
- Daily rates average $186
Shoulder Season
- Revenue averages $3,016 per month
- Occupancy maintains around 52.1%
- Daily rates hold near $178
Low Season (January, September, October)
- Revenue drops to average $2,513 per month
- Occupancy decreases to average 41.3%
- Daily rates adjust to average $182
Seasonality Insights for Lake Mary
- The Airbnb seasonality in Lake Mary shows moderate seasonality with distinct peak and low periods. While the sections above show seasonal averages, it's also insightful to look at the extremes:
- During the high season, the absolute peak month showcases Lake Mary's highest earning potential, with monthly revenues capable of climbing to $3,695, occupancy reaching a high of 59.4%, and ADRs peaking at $195.
- Conversely, the slowest single month of the year, typically falling within the low season, marks the market's lowest point. In this month, revenue might dip to $2,462, occupancy could drop to 39.7%, and ADRs may adjust down to $167.
- Understanding both the seasonal averages and these monthly peaks and troughs in revenue, occupancy, and ADR is crucial for maximizing your Airbnb profit potential in Lake Mary.
Seasonal Strategies for Maximizing Profit
- Peak Season: Maximize revenue through premium pricing and potentially longer minimum stays. Ensure high availability.
- Low Season: Offer competitive pricing, special promotions (e.g., extended stay discounts), and flexible cancellation policies. Target off-season travelers like remote workers or budget-conscious guests.
- Shoulder Seasons: Implement dynamic pricing that balances peak and low rates. Target weekend travelers or specific events. Offer slightly more flexible terms than peak season.
- Regularly analyze your own performance against these Lake Mary seasonality benchmarks and adjust your pricing and availability strategy accordingly.
Best Areas for Airbnb Investment in Lake Mary (2026)
Exploring the top neighborhoods for short-term rentals in Lake Mary? This section highlights key areas, outlining why they are attractive for hosts and guests, along with notable local attractions. Consider these locations based on your target guest profile and investment strategy.
| Neighborhood / Area | Why Host Here? (Target Guests & Appeal) | Key Attractions & Landmarks |
|---|---|---|
| Downtown Lake Mary | The vibrant heart of Lake Mary featuring shopping, dining, and entertainment options. It's popular for business travelers and visitors to the nearby corporate offices. | Central Park, Lake Mary Farmer's Market, Timacuan Golf Club, Lake Mary Museum |
| Lake Mary-Heathrow | Known for its upscale living and proximity to top-notch golf courses and dining. This area is ideal for those looking for a quiet yet luxurious feel near Lake Mary. | Heathrow Country Club, The Golf Club at Eaglebrooke, Indigo Lakes Golf Club, Local parks and nature trails |
| Colonial Town Park | A well-planned community with restaurants, shops, and local events. Offers a mix of urban convenience and suburban comfort, attracting families and young professionals. | Colonial Town Park shops, Café Murano, local dining options |
| Lake Mary Park | A scenic waterfront area that offers recreational facilities, it attracts families and nature lovers looking for outdoor activities. | Lake Mary Park, playgrounds, picnic areas, nature trails |
| Live Oak Reserve | A suburban community offering spacious homes and family-friendly environments, it's attractive for longer-term stays and family visits. | community parks, family-friendly amenities, access to good schools |
| Wellsprings Park | Close to natural attractions, this area is popular for those seeking a peaceful getaway in a natural setting, ideal for nature enthusiasts. | Wellsprings Park, local lakes, wildlife viewing areas |
| Sanford | Adjacent to Lake Mary, Sanford has a historic downtown area with a rich history and is known for its waterfront, making it attractive to tourists and short-term rentals. | Downtown Sanford, Lake Monroe, Central Florida Zoo, Sanford Riverwalk |
| Longwood | A nearby suburb that provides easy access to Lake Mary, Longwood is known for its charming neighborhoods and family-friendly atmosphere, appealing to longer-term visitors. | Lake Lotus Park, Longwood Historic District, splash pads, parks |
Understanding Airbnb License Requirements & STR Laws in Lake Mary (2026)
While Lake Mary, Florida, United States currently shows low STR regulations, specific Airbnb license requirements might still exist or change. Always verify the latest short term rental regulations and Airbnb license requirements directly with local government authorities for Lake Mary to ensure full compliance before hosting.
(Source: AirROI data, 2026, finding no licensed listings among those analyzed)
Top Performing Airbnb Properties in Lake Mary (2026)
Benchmark your potential! Explore examples of top-performing Airbnb properties in Lake Marybased on Trailing Twelve Month (TTM) revenue. Analyze their characteristics, revenue, occupancy rate, and ADR to understand what drives success in this market.

Walk to Lake: Stunning Central Florida Home!
Entire Place • 3 bedrooms
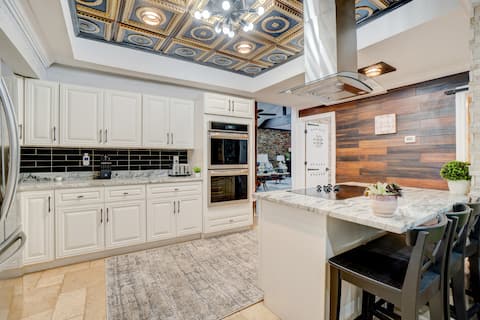
Markham Woods 4BR Pool Retreat near Attractions
Entire Place • 4 bedrooms
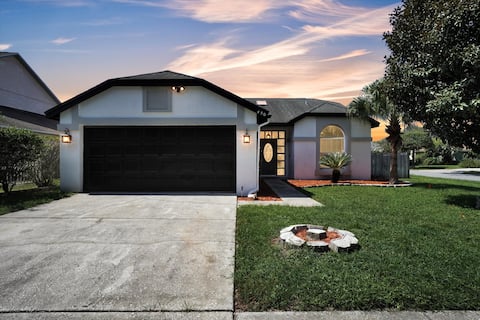
New! Sunroom Sanctuary | Hot Tub | Air Hockey
Entire Place • 3 bedrooms
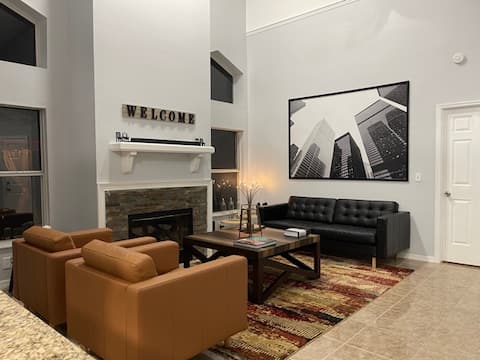
Fully renovated 5 bedroom with king size bed
Entire Place • 5 bedrooms
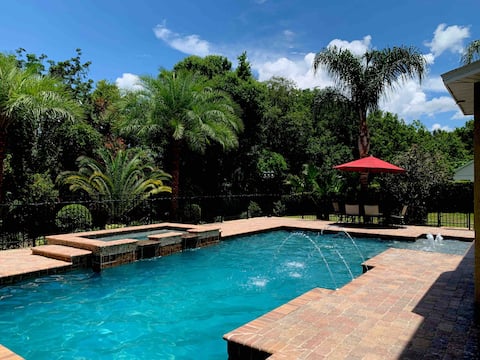
Gated community XL pool Home 2500sq/f
Entire Place • 3 bedrooms

Swim, Golf & Relax: Lovely Home in Lake Mary
Entire Place • 4 bedrooms
Note: Performance varies based on location, size, amenities, seasonality, and management quality. Data reflects the past 12 months.
Top Performing Airbnb Hosts in Lake Mary (2026)
Learn from the best! This table showcases top-performing Airbnb hosts in Lake Mary based on the number of properties managed and estimated total revenue over the past year. Analyze their scale and performance metrics.
| Host Name | Properties | Grossing Revenue | Stay Reviews | Avg Rating |
|---|---|---|---|---|
| Evolve | 4 | $148,654 | 52 | 4.32/5.0 |
| Ahmad | 3 | $112,030 | 241 | 4.83/5.0 |
| Jose E | 2 | $67,278 | 466 | 4.89/5.0 |
| Mandi | 1 | $64,313 | 28 | 4.79/5.0 |
| Suzy | 2 | $63,892 | 131 | 4.96/5.0 |
| Daniel | 1 | $63,330 | 107 | 4.98/5.0 |
| Heidy | 1 | $59,355 | 274 | 4.90/5.0 |
| Brenwood | 1 | $49,417 | 13 | 4.92/5.0 |
| Kyle And Maria | 1 | $49,278 | 216 | 4.84/5.0 |
| Jessa | 1 | $46,995 | 21 | 5.00/5.0 |
Analyzing the strategies of top hosts, such as their property selection, pricing, and guest communication, can offer valuable lessons for optimizing your own Airbnb operations in Lake Mary.
Dive Deeper: Advanced Lake Mary STR Market Data (2026)
Ready to unlock more insights? AirROI provides access to advanced metrics and comprehensive Airbnb data for Lake Mary. Explore detailed analytics beyond this report to refine your investment strategy, optimize pricing, and maximize your vacation rental profits.
Explore Advanced MetricsLake Mary Short-Term Rental Market Composition (2026): Property & Room Types
Room Type Distribution
Property Type Distribution
Market Composition Insights for Lake Mary
- The Lake Mary Airbnb market composition is heavily skewed towards Entire Home/Apt listings, which make up 92.7% of the 41 active rentals. This indicates strong guest preference for privacy and space.
- Looking at the property type distribution in Lake Mary, House properties are the most common (61%), reflecting the local real estate landscape.
- Houses represent a significant 61% portion, catering likely to families or larger groups.
- The presence of 19.5% Hotel/Boutique listings indicates integration with traditional hospitality.
- Smaller segments like others (combined 4.9%) offer potential for unique stay experiences.
Lake Mary Airbnb Room Capacity Analysis (2026): Bedroom Distribution
Distribution of Listings by Number of Bedrooms
Room Capacity Insights for Lake Mary
- The dominant room capacity in Lake Mary is 1 bedroom listings, making up 26.8% of the market. This suggests a strong demand for properties suitable for couples or solo travelers.
- Together, 1 bedroom and 3 bedrooms properties represent 51.2% of the active Airbnb listings in Lake Mary, indicating a high concentration in these sizes.
- A significant 39.0% of listings offer 3+ bedrooms, catering to larger groups and families seeking more space in Lake Mary.
Lake Mary Vacation Rental Guest Capacity Trends (2026)
Distribution of Listings by Guest Capacity
Guest Capacity Insights for Lake Mary
- The most common guest capacity trend in Lake Mary vacation rentals is listings accommodating 4 guests (26.8%). This suggests the primary traveler segment is likely small families or groups.
- Properties designed for 4 guests and 8+ guests dominate the Lake Mary STR market, accounting for 51.2% of listings.
- 41.5% of properties accommodate 6+ guests, serving the market segment for larger families or group travel in Lake Mary.
- On average, properties in Lake Mary are equipped to host 4.7 guests.
Lake Mary Airbnb Booking Patterns (2026): Available vs. Booked Days
Available Days Distribution
Booked Days Distribution
Booking Pattern Insights for Lake Mary
- The most common availability pattern in Lake Mary falls within the 181-270 days range, representing 36.6% of listings. This suggests many properties have significant open periods on their calendars.
- Approximately 63.4% of listings show high availability (181+ days open annually), indicating potential for increased bookings or specific owner usage patterns.
- For booked days, the 181-270 days range is most frequent in Lake Mary (36.6%), reflecting common guest stay durations or potential owner blocking patterns.
- A notable 43.9% of properties secure long booking periods (181+ days booked per year), highlighting successful long-term rental strategies or significant owner usage.
Lake Mary Airbnb Minimum Stay Requirements Analysis
Distribution of Listings by Minimum Night Requirement
1 Night
14 listings
34.1% of total
2 Nights
13 listings
31.7% of total
3 Nights
4 listings
9.8% of total
4-6 Nights
2 listings
4.9% of total
30+ Nights
8 listings
19.5% of total
Key Insights
- The most prevalent minimum stay requirement in Lake Mary is 1 Night, adopted by 34.1% of listings. This highlights the market's preference for shorter, flexible bookings.
- A strong majority (65.8%) of the Lake Mary Airbnb data shows acceptance of very short stays (1-2 nights), indicating a dynamic, high-turnover market.
- A significant segment (19.5%) caters to monthly stays (30+ nights) in Lake Mary, pointing to opportunities in the extended-stay market.
Recommendations
- Align with the market by considering a 1 Night minimum stay, as 34.1% of Lake Mary hosts use this setting.
- Explore offering discounts for stays of 30+ nights to attract the 19.5% of the market seeking extended stays.
- Adjust minimum nights based on seasonality – potentially shorter during low season and longer during peak demand periods in Lake Mary.
Lake Mary Airbnb Cancellation Policy Trends Analysis (2026)
Limited
1 listings
2.4% of total
Flexible
8 listings
19.5% of total
Moderate
18 listings
43.9% of total
Firm
7 listings
17.1% of total
Strict
7 listings
17.1% of total
Cancellation Policy Insights for Lake Mary
- The prevailing Airbnb cancellation policy trend in Lake Mary is Moderate, used by 43.9% of listings.
- There's a relatively balanced mix between guest-friendly (63.4%) and stricter (34.2%) policies, offering choices for different guest needs.
Recommendations for Hosts
- Consider adopting a Moderate policy to align with the 43.9% market standard in Lake Mary.
- Regularly review your cancellation policy against competitors and market demand shifts in Lake Mary.
Lake Mary STR Booking Lead Time Analysis (2026)
Average Booking Lead Time by Month
Booking Lead Time Insights for Lake Mary
- The overall average booking lead time for vacation rentals in Lake Mary is 40 days.
- Guests book furthest in advance for stays during November (average 56 days), likely coinciding with peak travel demand or local events.
- The shortest booking windows occur for stays in March (average 31 days), indicating more last-minute travel plans during this time.
- Seasonally, Winter (47 days avg.) sees the longest lead times, while Summer (37 days avg.) has the shortest, reflecting typical travel planning cycles.
Recommendations for Hosts
- Use the overall average lead time (40 days) as a baseline for your pricing and availability strategy in Lake Mary.
- For November stays, consider implementing length-of-stay discounts or slightly higher rates for bookings made less than 56 days out to capitalize on advance planning.
- Target marketing efforts for the Winter season well in advance (at least 47 days) to capture early planners.
- Monitor your own booking lead times against these Lake Mary averages to identify opportunities for dynamic pricing adjustments.
Popular & Essential Airbnb Amenities in Lake Mary (2026)
Amenity Prevalence
Amenity Insights for Lake Mary
- Essential amenities in Lake Mary that guests expect include: Air conditioning, Free parking on premises, Wifi, Smoke alarm, TV. Lacking these (any) could significantly impact bookings.
- Popular amenities like Heating, Fire extinguisher, Kitchen are common but not universal. Offering these can provide a competitive edge.
Recommendations for Hosts
- Ensure your listing includes all essential amenities for Lake Mary: Air conditioning, Free parking on premises, Wifi, Smoke alarm, TV.
- Prioritize adding missing essentials: TV.
- Consider adding popular differentiators like Heating or Fire extinguisher to increase appeal.
- Highlight unique or less common amenities you offer (e.g., hot tub, dedicated workspace, EV charger) in your listing description and photos.
- Regularly check competitor amenities in Lake Mary to stay competitive.
Lake Mary Airbnb Guest Demographics & Profile Analysis (2026)
Guest Profile Summary for Lake Mary
- The typical guest profile for Airbnb in Lake Mary consists of primarily domestic travelers (92%), often arriving from nearby Orlando, typically belonging to the Post-2000s (Gen Z/Alpha) group (50%), primarily speaking English or Spanish.
- Domestic travelers account for 91.7% of guests.
- Key international markets include United States (91.7%) and United Kingdom (2.2%).
- Top languages spoken are English (70.4%) followed by Spanish (20.9%).
- A significant demographic segment is the Post-2000s (Gen Z/Alpha) group, representing 50% of guests.
Recommendations for Hosts
- Target domestic marketing efforts towards travelers from Orlando and New York.
- Tailor amenities and listing descriptions to appeal to the dominant Post-2000s (Gen Z/Alpha) demographic (e.g., highlight fast WiFi, smart home features, local guides).
- Highlight unique local experiences or amenities relevant to the primary guest profile.
- Consider seasonal promotions aligned with peak travel times for key origin markets.
Nearby Short-Term Rental Market Comparison
How does the Lake Mary Airbnb market stack up against its neighbors? Compare key performance metrics like average monthly revenue, ADR, and occupancy rates in surrounding areas to understand the broader regional STR landscape.
| Market | Active Properties | Monthly Revenue | Daily Rate | Avg. Occupancy |
|---|---|---|---|---|
| Sailfish Point | 19 | $16,709 | $1587.63 | 48% |
| Anna Maria island | 587 | $7,996 | $823.96 | 41% |
| Anna Maria | 56 | $6,434 | $692.96 | 52% |
| Reunion | 12 | $6,321 | $580.45 | 44% |
| Vilano Beach | 173 | $5,571 | $442.95 | 45% |
| Indian Rocks Beach | 842 | $5,560 | $419.63 | 49% |
| Melbourne Beach | 275 | $5,384 | $488.83 | 43% |
| Siesta Key | 1,175 | $5,206 | $518.91 | 42% |
| Belleair Beach | 94 | $5,086 | $339.65 | 53% |
| Bradenton Beach | 122 | $4,977 | $507.12 | 42% |