Lake City Airbnb Market Analysis 2026: Short Term Rental Data & Vacation Rental Statistics in Florida, United States
Is Airbnb profitable in Lake City in 2026? Explore comprehensive Airbnb analytics for Lake City, Florida, United States to uncover income potential. This 2026 STR market report for Lake City, based on AirROI data from February 2025 to January 2026, reveals key trends in the niche market of 61 active listings.
Whether you're considering an Airbnb investment in Lake City, optimizing your existing vacation rental, or exploring rental arbitrage opportunities, understanding the Lake City Airbnb data is crucial. Leveraging the low regulation environment is key to maximizing your short term rental income potential. Let's dive into the specifics.
Key Lake City Airbnb Performance Metrics Overview
Monthly Airbnb Revenue Variations & Income Potential in Lake City (2026)
Understanding the monthly revenue variations for Airbnb listings in Lake City is key to maximizing your short term rental income potential. Seasonality significantly impacts earnings. Our analysis, based on data from the past 12 months, shows that the peak revenue month for STRs in Lake City is typically March, while January often presents the lowest earnings, highlighting opportunities for strategic pricing adjustments during shoulder and low seasons. Explore the typical Airbnb income in Lake City across different performance tiers:
- Best-in-class properties (Top 10%) achieve $3,604+ monthly, often utilizing dynamic pricing and superior guest experiences.
- Strong performing properties (Top 25%) earn $2,659 or more, indicating effective management and desirable locations/amenities.
- Typical properties (Median) generate around $1,478 per month, representing the average market performance.
- Entry-level properties (Bottom 25%) see earnings around $789, often with potential for optimization.
Average Monthly Airbnb Earnings Trend in Lake City
Lake City Airbnb Occupancy Rate Trends (2026)
Maximize your bookings by understanding the Lake City STR occupancy trends. Seasonal demand shifts significantly influence how often properties are booked. Typically, Marchsees the highest demand (peak season occupancy), while January experiences the lowest (low season). Effective strategies, like adjusting minimum stays or offering promotions, can boost occupancy during slower periods. Here's how different property tiers perform in Lake City:
- Best-in-class properties (Top 10%) achieve 76%+ occupancy, indicating high desirability and potentially optimized availability.
- Strong performing properties (Top 25%) maintain 61% or higher occupancy, suggesting good market fit and guest satisfaction.
- Typical properties (Median) have an occupancy rate around 38%.
- Entry-level properties (Bottom 25%) average 19% occupancy, potentially facing higher vacancy.
Average Monthly Occupancy Rate Trend in Lake City
Average Daily Rate (ADR) Airbnb Trends in Lake City (2026)
Effective short term rental pricing strategy in Lake City involves understanding monthly ADR fluctuations. The Average Daily Rate (ADR) for Airbnb in Lake City typically peaks in October and dips lowest during April. Leveraging Airbnb dynamic pricing tools or strategies based on this seasonality can significantly boost revenue. Here's a look at the typical nightly rates achieved:
- Best-in-class properties (Top 10%) command rates of $220+ per night, often due to premium features or locations.
- Strong performing properties (Top 25%) achieve nightly rates of $168 or more.
- Typical properties (Median) charge around $131 per night.
- Entry-level properties (Bottom 25%) earn around $97 per night.
Average Daily Rate (ADR) Trend by Month in Lake City
Get Live Lake City Market Intelligence 👇

Explore Real-time Analytics
Airbnb Seasonality Analysis & Trends in Lake City (2026)
Peak Season (March, August, February)
- Revenue averages $2,108 per month
- Occupancy rates average 48.1%
- Daily rates average $128
Shoulder Season
- Revenue averages $1,823 per month
- Occupancy maintains around 40.7%
- Daily rates hold near $142
Low Season (January, April, September)
- Revenue drops to average $1,477 per month
- Occupancy decreases to average 36.0%
- Daily rates adjust to average $137
Seasonality Insights for Lake City
- The Airbnb seasonality in Lake City shows moderate seasonality with distinct peak and low periods. While the sections above show seasonal averages, it's also insightful to look at the extremes:
- During the high season, the absolute peak month showcases Lake City's highest earning potential, with monthly revenues capable of climbing to $2,291, occupancy reaching a high of 54.6%, and ADRs peaking at $151.
- Conversely, the slowest single month of the year, typically falling within the low season, marks the market's lowest point. In this month, revenue might dip to $1,271, occupancy could drop to 29.0%, and ADRs may adjust down to $125.
- Understanding both the seasonal averages and these monthly peaks and troughs in revenue, occupancy, and ADR is crucial for maximizing your Airbnb profit potential in Lake City.
Seasonal Strategies for Maximizing Profit
- Peak Season: Maximize revenue through premium pricing and potentially longer minimum stays. Ensure high availability.
- Low Season: Offer competitive pricing, special promotions (e.g., extended stay discounts), and flexible cancellation policies. Target off-season travelers like remote workers or budget-conscious guests.
- Shoulder Seasons: Implement dynamic pricing that balances peak and low rates. Target weekend travelers or specific events. Offer slightly more flexible terms than peak season.
- Regularly analyze your own performance against these Lake City seasonality benchmarks and adjust your pricing and availability strategy accordingly.
Best Areas for Airbnb Investment in Lake City (2026)
Exploring the top neighborhoods for short-term rentals in Lake City? This section highlights key areas, outlining why they are attractive for hosts and guests, along with notable local attractions. Consider these locations based on your target guest profile and investment strategy.
| Neighborhood / Area | Why Host Here? (Target Guests & Appeal) | Key Attractions & Landmarks |
|---|---|---|
| Downtown Lake City | The bustling center of Lake City that offers a mix of shopping, dining, and entertainment. It attracts both business travelers and tourists, making it a prime location for Airbnb. | Lake City Mall, Olustee Park, Lake City Farmers Market, Columbia County Courthouse, Timucuan Ecological and Historic Preserve |
| Five Points | A charming neighborhood known for its community feel and proximity to local attractions. Ideal for families and travelers looking for a relaxing stay. | Five Points Park, Lake City Historical Society, Columbia County Museum, local shops and cafes |
| Lake Shore | A peaceful area near the scenic Lakeshore Drive, perfect for outdoor enthusiasts and those looking for a quiet getaway close to nature. | Lake Rosa Lee, Stephen Foster Folk Culture Center State Park, Harmon Park, Suwannee River |
| West Lake City | A developing area that is gaining popularity among travelers for its affordable options and proximity to major highways, making it accessible for exploring the region. | local grocery stores and markets, access to I-75 and I-10, nearby hiking trails |
| Southside Lake City | An up-and-coming area that features family-friendly neighborhoods and local parks. Great for those seeking community and nature close by. | Southside Recreation Center, Bud Smith Park, local dining options |
| North Lake City | Known for its spacious properties and accessibility, North Lake City appeals to larger groups and families looking for a comfortable stay. | Lake City Flea Market, local parks, cultural exhibits |
| St. Augustine Road Area | Offers a mix of suburban comfort and access to urban amenities. Attractive to both short-term and long-term visitors. | Women's Club of Lake City, local outdoor events, nearby shops |
| East Lake City | Features a growing community with easy access to amenities and local attractions, drawing in those looking for a quieter environment. | Eastside Park, Cedar River, local food trucks |
Understanding Airbnb License Requirements & STR Laws in Lake City (2026)
While Lake City, Florida, United States currently shows low STR regulations, specific Airbnb license requirements might still exist or change. Always verify the latest short term rental regulations and Airbnb license requirements directly with local government authorities for Lake City to ensure full compliance before hosting.
(Source: AirROI data, 2026, finding no licensed listings among those analyzed)
Top Performing Airbnb Properties in Lake City (2026)
Benchmark your potential! Explore examples of top-performing Airbnb properties in Lake Citybased on Trailing Twelve Month (TTM) revenue. Analyze their characteristics, revenue, occupancy rate, and ADR to understand what drives success in this market.
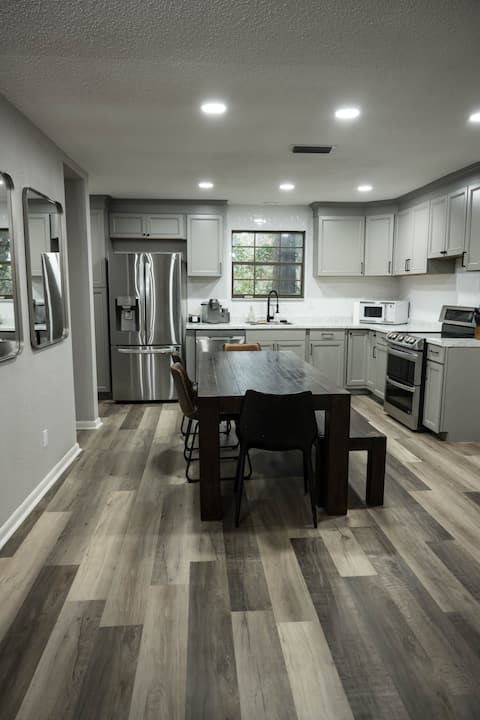
Creekside
Entire Place • 4 bedrooms
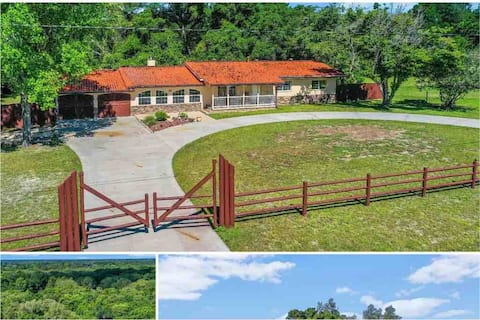
3 Bedroom 2 bath Home on 10 acres
Entire Place • 3 bedrooms

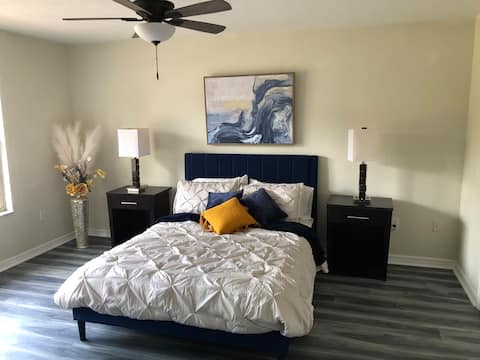
“The Peaceful Palace”
Entire Place • 2 bedrooms
Lake City Luxury New listing whole house
Entire Place • 3 bedrooms

Cute & Cozy FL Home/private backyard with deck
Entire Place • 3 bedrooms

Deerwood Cottage 3BR /2BA Brick Home
Entire Place • 3 bedrooms
Note: Performance varies based on location, size, amenities, seasonality, and management quality. Data reflects the past 12 months.
Top Performing Airbnb Hosts in Lake City (2026)
Learn from the best! This table showcases top-performing Airbnb hosts in Lake City based on the number of properties managed and estimated total revenue over the past year. Analyze their scale and performance metrics.
| Host Name | Properties | Grossing Revenue | Stay Reviews | Avg Rating |
|---|---|---|---|---|
| Noah | 6 | $104,856 | 272 | 4.85/5.0 |
| Ashley | 2 | $49,214 | 64 | 4.72/5.0 |
| Joann | 2 | $48,067 | 47 | 4.64/5.0 |
| Chelsey | 1 | $42,108 | 26 | 4.62/5.0 |
| Marianna | 2 | $35,717 | 340 | 4.90/5.0 |
| Shannan | 1 | $35,241 | 100 | 4.87/5.0 |
| Nicholas | 1 | $34,586 | 50 | 5.00/5.0 |
| Abby And Steve | 1 | $34,408 | 73 | 4.84/5.0 |
| Alyssa | 1 | $32,608 | 83 | 4.98/5.0 |
| David | 2 | $30,345 | 339 | 4.86/5.0 |
Analyzing the strategies of top hosts, such as their property selection, pricing, and guest communication, can offer valuable lessons for optimizing your own Airbnb operations in Lake City.
Dive Deeper: Advanced Lake City STR Market Data (2026)
Ready to unlock more insights? AirROI provides access to advanced metrics and comprehensive Airbnb data for Lake City. Explore detailed analytics beyond this report to refine your investment strategy, optimize pricing, and maximize your vacation rental profits.
Explore Advanced MetricsLake City Short-Term Rental Market Composition (2026): Property & Room Types
Room Type Distribution
Property Type Distribution
Market Composition Insights for Lake City
- The Lake City Airbnb market composition is heavily skewed towards Entire Home/Apt listings, which make up 90.2% of the 61 active rentals. This indicates strong guest preference for privacy and space.
- Looking at the property type distribution in Lake City, House properties are the most common (73.8%), reflecting the local real estate landscape.
- Houses represent a significant 73.8% portion, catering likely to families or larger groups.
- The presence of 6.6% Hotel/Boutique listings indicates integration with traditional hospitality.
- Smaller segments like others (combined 4.9%) offer potential for unique stay experiences.
Lake City Airbnb Room Capacity Analysis (2026): Bedroom Distribution
Distribution of Listings by Number of Bedrooms
Room Capacity Insights for Lake City
- The dominant room capacity in Lake City is 2 bedrooms listings, making up 36.1% of the market. This suggests a strong demand for properties suitable for couples or solo travelers.
- Together, 2 bedrooms and 3 bedrooms properties represent 68.9% of the active Airbnb listings in Lake City, indicating a high concentration in these sizes.
- A significant 37.7% of listings offer 3+ bedrooms, catering to larger groups and families seeking more space in Lake City.
Lake City Vacation Rental Guest Capacity Trends (2026)
Distribution of Listings by Guest Capacity
Guest Capacity Insights for Lake City
- The most common guest capacity trend in Lake City vacation rentals is listings accommodating 6 guests (26.2%). This suggests the primary traveler segment is likely larger groups.
- Properties designed for 6 guests and 4 guests dominate the Lake City STR market, accounting for 44.2% of listings.
- 55.7% of properties accommodate 6+ guests, serving the market segment for larger families or group travel in Lake City.
- On average, properties in Lake City are equipped to host 5.2 guests.
Lake City Airbnb Booking Patterns (2026): Available vs. Booked Days
Available Days Distribution
Booked Days Distribution
Booking Pattern Insights for Lake City
- The most common availability pattern in Lake City falls within the 271-366 days range, representing 50.8% of listings. This suggests many properties have significant open periods on their calendars.
- Approximately 86.9% of listings show high availability (181+ days open annually), indicating potential for increased bookings or specific owner usage patterns.
- For booked days, the 91-180 days range is most frequent in Lake City (37.7%), reflecting common guest stay durations or potential owner blocking patterns.
- A notable 13.1% of properties secure long booking periods (181+ days booked per year), highlighting successful long-term rental strategies or significant owner usage.
Lake City Airbnb Minimum Stay Requirements Analysis
Distribution of Listings by Minimum Night Requirement
1 Night
24 listings
39.3% of total
2 Nights
26 listings
42.6% of total
3 Nights
3 listings
4.9% of total
4-6 Nights
2 listings
3.3% of total
7-29 Nights
1 listings
1.6% of total
30+ Nights
5 listings
8.2% of total
Key Insights
- The most prevalent minimum stay requirement in Lake City is 2 Nights, adopted by 42.6% of listings. This highlights the market's preference for shorter, flexible bookings.
- A strong majority (81.9%) of the Lake City Airbnb data shows acceptance of very short stays (1-2 nights), indicating a dynamic, high-turnover market.
Recommendations
- Align with the market by considering a 2 Nights minimum stay, as 42.6% of Lake City hosts use this setting.
- Explore offering discounts for stays of 30+ nights to attract the 8.2% of the market seeking extended stays.
- Adjust minimum nights based on seasonality – potentially shorter during low season and longer during peak demand periods in Lake City.
Lake City Airbnb Cancellation Policy Trends Analysis (2026)
Limited
1 listings
1.6% of total
Flexible
16 listings
26.2% of total
Moderate
26 listings
42.6% of total
Firm
14 listings
23% of total
Strict
4 listings
6.6% of total
Cancellation Policy Insights for Lake City
- The prevailing Airbnb cancellation policy trend in Lake City is Moderate, used by 42.6% of listings.
- There's a relatively balanced mix between guest-friendly (68.8%) and stricter (29.6%) policies, offering choices for different guest needs.
- Strict cancellation policies are quite rare (6.6%), potentially making listings with this policy less competitive unless justified by high demand or property type.
Recommendations for Hosts
- Consider adopting a Moderate policy to align with the 42.6% market standard in Lake City.
- Using a Strict policy might deter some guests, as only 6.6% of listings use it. Evaluate if potential revenue protection outweighs possible lower booking rates.
- Regularly review your cancellation policy against competitors and market demand shifts in Lake City.
Lake City STR Booking Lead Time Analysis (2026)
Average Booking Lead Time by Month
Booking Lead Time Insights for Lake City
- The overall average booking lead time for vacation rentals in Lake City is 24 days.
- Guests book furthest in advance for stays during November (average 53 days), likely coinciding with peak travel demand or local events.
- The shortest booking windows occur for stays in September (average 11 days), indicating more last-minute travel plans during this time.
- Seasonally, Fall (29 days avg.) sees the longest lead times, while Winter (20 days avg.) has the shortest, reflecting typical travel planning cycles.
Recommendations for Hosts
- Use the overall average lead time (24 days) as a baseline for your pricing and availability strategy in Lake City.
- For November stays, consider implementing length-of-stay discounts or slightly higher rates for bookings made less than 53 days out to capitalize on advance planning.
- During September, focus on last-minute booking availability and promotions, as guests book with very short notice (11 days avg.).
- Target marketing efforts for the Fall season well in advance (at least 29 days) to capture early planners.
- Monitor your own booking lead times against these Lake City averages to identify opportunities for dynamic pricing adjustments.
Popular & Essential Airbnb Amenities in Lake City (2026)
Amenity Prevalence
Amenity Insights for Lake City
- Essential amenities in Lake City that guests expect include: Free parking on premises, Air conditioning, TV, Smoke alarm, Hot water. Lacking these (any) could significantly impact bookings.
- Popular amenities like Heating, Kitchen, Coffee maker are common but not universal. Offering these can provide a competitive edge.
- Warning: Wifi is not universally provided but is considered essential globally. Ensure reliable Wifi is offered.
Recommendations for Hosts
- Ensure your listing includes all essential amenities for Lake City: Free parking on premises, Air conditioning, TV, Smoke alarm, Hot water.
- Prioritize adding missing essentials: Air conditioning, TV, Smoke alarm, Hot water.
- Consider adding popular differentiators like Heating or Kitchen to increase appeal.
- Highlight unique or less common amenities you offer (e.g., hot tub, dedicated workspace, EV charger) in your listing description and photos.
- Regularly check competitor amenities in Lake City to stay competitive.
Lake City Airbnb Guest Demographics & Profile Analysis (2026)
Guest Profile Summary for Lake City
- The typical guest profile for Airbnb in Lake City consists of primarily domestic travelers (98%), often arriving from nearby Tampa, typically belonging to the Post-2000s (Gen Z/Alpha) group (50%), primarily speaking English or Spanish.
- Domestic travelers account for 98.1% of guests.
- Key international markets include United States (98.1%) and Honduras (0.2%).
- Top languages spoken are English (73.8%) followed by Spanish (17.1%).
- A significant demographic segment is the Post-2000s (Gen Z/Alpha) group, representing 50% of guests.
Recommendations for Hosts
- Target domestic marketing efforts towards travelers from Tampa and Orlando.
- Tailor amenities and listing descriptions to appeal to the dominant Post-2000s (Gen Z/Alpha) demographic (e.g., highlight fast WiFi, smart home features, local guides).
- Highlight unique local experiences or amenities relevant to the primary guest profile.
- Consider seasonal promotions aligned with peak travel times for key origin markets.
Nearby Short-Term Rental Market Comparison
How does the Lake City Airbnb market stack up against its neighbors? Compare key performance metrics like average monthly revenue, ADR, and occupancy rates in surrounding areas to understand the broader regional STR landscape.
| Market | Active Properties | Monthly Revenue | Daily Rate | Avg. Occupancy |
|---|---|---|---|---|
| St. Johns County | 12 | $6,964 | $592.43 | 47% |
| Ponte Vedra Beach | 224 | $5,720 | $574.75 | 43% |
| Vilano Beach | 173 | $5,571 | $442.95 | 45% |
| St. Simons | 91 | $4,162 | $379.84 | 42% |
| Jacksonville Beach | 763 | $4,123 | $328.32 | 49% |
| Saint Augustine | 1,749 | $3,586 | $287.24 | 46% |
| Montgomery | 11 | $3,557 | $246.45 | 54% |
| Saint Simons | 902 | $3,532 | $375.60 | 38% |
| Isle of Hope | 32 | $3,502 | $271.42 | 46% |
| Hammock Beach | 197 | $3,498 | $441.99 | 39% |