Key Colony Beach Airbnb Market Analysis 2026: Short Term Rental Data & Vacation Rental Statistics in Florida, United States
Is Airbnb profitable in Key Colony Beach in 2026? Explore comprehensive Airbnb analytics for Key Colony Beach, Florida, United States to uncover income potential. This 2026 STR market report for Key Colony Beach, based on AirROI data from February 2025 to January 2026, reveals key trends in the market of 264 active listings.
Whether you're considering an Airbnb investment in Key Colony Beach, optimizing your existing vacation rental, or exploring rental arbitrage opportunities, understanding the Key Colony Beach Airbnb data is crucial. Leveraging the low regulation environment is key to maximizing your short term rental income potential. Let's dive into the specifics.
Key Key Colony Beach Airbnb Performance Metrics Overview
Monthly Airbnb Revenue Variations & Income Potential in Key Colony Beach (2026)
Understanding the monthly revenue variations for Airbnb listings in Key Colony Beach is key to maximizing your short term rental income potential. Seasonality significantly impacts earnings. Our analysis, based on data from the past 12 months, shows that the peak revenue month for STRs in Key Colony Beach is typically March, while September often presents the lowest earnings, highlighting opportunities for strategic pricing adjustments during shoulder and low seasons. Explore the typical Airbnb income in Key Colony Beach across different performance tiers:
- Best-in-class properties (Top 10%) achieve $10,754+ monthly, often utilizing dynamic pricing and superior guest experiences.
- Strong performing properties (Top 25%) earn $7,814 or more, indicating effective management and desirable locations/amenities.
- Typical properties (Median) generate around $5,580 per month, representing the average market performance.
- Entry-level properties (Bottom 25%) see earnings around $3,533, often with potential for optimization.
Average Monthly Airbnb Earnings Trend in Key Colony Beach
Key Colony Beach Airbnb Occupancy Rate Trends (2026)
Maximize your bookings by understanding the Key Colony Beach STR occupancy trends. Seasonal demand shifts significantly influence how often properties are booked. Typically, Marchsees the highest demand (peak season occupancy), while October experiences the lowest (low season). Effective strategies, like adjusting minimum stays or offering promotions, can boost occupancy during slower periods. Here's how different property tiers perform in Key Colony Beach:
- Best-in-class properties (Top 10%) achieve 84%+ occupancy, indicating high desirability and potentially optimized availability.
- Strong performing properties (Top 25%) maintain 72% or higher occupancy, suggesting good market fit and guest satisfaction.
- Typical properties (Median) have an occupancy rate around 55%.
- Entry-level properties (Bottom 25%) average 33% occupancy, potentially facing higher vacancy.
Average Monthly Occupancy Rate Trend in Key Colony Beach
Average Daily Rate (ADR) Airbnb Trends in Key Colony Beach (2026)
Effective short term rental pricing strategy in Key Colony Beach involves understanding monthly ADR fluctuations. The Average Daily Rate (ADR) for Airbnb in Key Colony Beach typically peaks in January and dips lowest during September. Leveraging Airbnb dynamic pricing tools or strategies based on this seasonality can significantly boost revenue. Here's a look at the typical nightly rates achieved:
- Best-in-class properties (Top 10%) command rates of $616+ per night, often due to premium features or locations.
- Strong performing properties (Top 25%) achieve nightly rates of $442 or more.
- Typical properties (Median) charge around $329 per night.
- Entry-level properties (Bottom 25%) earn around $268 per night.
Average Daily Rate (ADR) Trend by Month in Key Colony Beach
Get Live Key Colony Beach Market Intelligence 👇

Explore Real-time Analytics
Airbnb Seasonality Analysis & Trends in Key Colony Beach (2026)
Peak Season (March, February, April)
- Revenue averages $8,515 per month
- Occupancy rates average 67.3%
- Daily rates average $394
Shoulder Season
- Revenue averages $5,890 per month
- Occupancy maintains around 49.9%
- Daily rates hold near $392
Low Season (August, September, October)
- Revenue drops to average $3,891 per month
- Occupancy decreases to average 39.5%
- Daily rates adjust to average $353
Seasonality Insights for Key Colony Beach
- The Airbnb seasonality in Key Colony Beach shows highly seasonal trends requiring careful strategy. While the sections above show seasonal averages, it's also insightful to look at the extremes:
- During the high season, the absolute peak month showcases Key Colony Beach's highest earning potential, with monthly revenues capable of climbing to $9,923, occupancy reaching a high of 73.9%, and ADRs peaking at $443.
- Conversely, the slowest single month of the year, typically falling within the low season, marks the market's lowest point. In this month, revenue might dip to $3,502, occupancy could drop to 37.4%, and ADRs may adjust down to $346.
- Understanding both the seasonal averages and these monthly peaks and troughs in revenue, occupancy, and ADR is crucial for maximizing your Airbnb profit potential in Key Colony Beach.
Seasonal Strategies for Maximizing Profit
- Peak Season: Maximize revenue through premium pricing and potentially longer minimum stays. Ensure high availability.
- Low Season: Offer competitive pricing, special promotions (e.g., extended stay discounts), and flexible cancellation policies. Target off-season travelers like remote workers or budget-conscious guests.
- Shoulder Seasons: Implement dynamic pricing that balances peak and low rates. Target weekend travelers or specific events. Offer slightly more flexible terms than peak season.
- Regularly analyze your own performance against these Key Colony Beach seasonality benchmarks and adjust your pricing and availability strategy accordingly.
Best Areas for Airbnb Investment in Key Colony Beach (2026)
Exploring the top neighborhoods for short-term rentals in Key Colony Beach? This section highlights key areas, outlining why they are attractive for hosts and guests, along with notable local attractions. Consider these locations based on your target guest profile and investment strategy.
| Neighborhood / Area | Why Host Here? (Target Guests & Appeal) | Key Attractions & Landmarks |
|---|---|---|
| Key Colony Beach | A charming, quiet island community that offers a relaxed atmosphere perfect for families and couples. Its close proximity to the beach and various water activities makes it an attractive destination for vacationers. | The Cabana Club, Coco Plum Beach, Calusa Beach, Florida Keys Kayak Tours, Dolphin Research Center, Robbie's of Islamorada |
| Marathon | Just a short drive from Key Colony Beach, Marathon is known for its beautiful beaches and attractions. It's a great base for exploring the Florida Keys, making it appealing for tourists looking for a central location. | Seven Mile Bridge, Sombrero Beach, Curry Hammock State Park, The Turtle Hospital, Crane Point Museum & Nature Center, Marathon Wildlife Sanctuary |
| Islamorada | Famous for its fishing, diving, and artistic community, Islamorada attracts adventure seekers and those looking for unique experiences in the Keys. Visitors appreciate its upscale dining and shopping options. | Theater of the Sea, Islamorada Beer Company, Founders Park, Windley Key Fossil Reef Geological State Park, History of Diving Museum, Dolphin Cove |
| Key West | Key West is a vibrant spot known for its nightlife, history, and beautiful sunsets. Although a bit further, it’s a popular day trip for guests staying in Key Colony Beach, providing diverse entertainment options. | Mallory Square, Ernest Hemingway Home and Museum, Duval Street, Key West Butterfly & Nature Conservatory, Fort Zachary Taylor Historic State Park, Southernmost Point |
| Big Pine Key | Famous for its natural beauty and the endangered Key deer, Big Pine Key provides a more laid-back atmosphere for guests who want to escape the hustle and bustle while still being close to activities. | National Key Deer Refuge, Blue Hole, Bahia Honda State Park, Looe Key Reef, Great White Heron National Wildlife Refuge |
| Cudjoe Key | Cudjoe Key offers a peaceful getaway in the Florida Keys with easy access to fishing, boating, and snorkeling, making it attractive to those looking for outdoor adventures. | Cudjoe Key Marina, Sugarloaf Key, Boat Rentals, Fishing Charters, Snorkeling Tours |
| Summerland Key | A serene, residential area that’s perfect for families and those seeking tranquility while still close to local attractions and water activities. | Summerland Key Islander, Local Restaurants, Kayaking Tours, Fishing Charters, Nearby State Parks |
| Duck Key | Known for its resorts and luxury waterfront properties, Duck Key appeals to guests looking for a more upscale experience in the Florida Keys surrounded by nature and recreational activities. | Duck Key marina, Hawks Cay Resort, Fishing and boating, Kayaking, Spa Services |
Understanding Airbnb License Requirements & STR Laws in Key Colony Beach (2026)
While Key Colony Beach, Florida, United States currently shows low STR regulations, specific Airbnb license requirements might still exist or change. Always verify the latest short term rental regulations and Airbnb license requirements directly with local government authorities for Key Colony Beach to ensure full compliance before hosting.
(Source: AirROI data, 2026, finding no licensed listings among those analyzed)
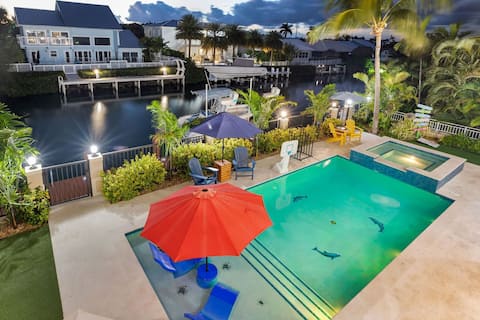
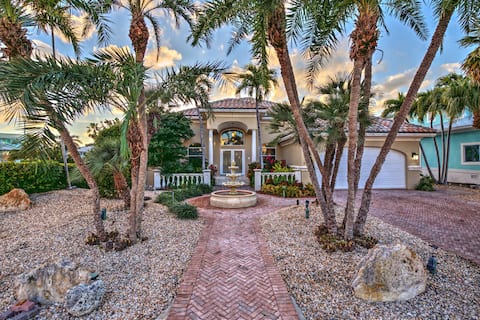
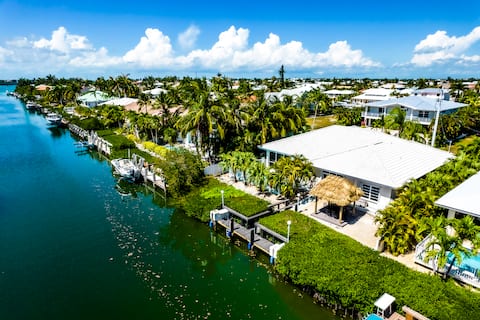
Top Performing Airbnb Properties in Key Colony Beach (2026)
Benchmark your potential! Explore examples of top-performing Airbnb properties in Key Colony Beachbased on Trailing Twelve Month (TTM) revenue. Analyze their characteristics, revenue, occupancy rate, and ADR to understand what drives success in this market.
Costamar! 5 bed 7 bath pool dock ice mach elevator
Entire Place • 5 bedrooms
Waterfront Oasis with Boat Dock & Pool!
Entire Place • 4 bedrooms
*Newly Renovated Single Family Home w/Private Pool
Entire Place • 4 bedrooms

Pet Friendly Half Duplex Pool Home with Boat Slip
Entire Place • 4 bedrooms

Paradise Cove! 50ft Dock Pool BBQ
Entire Place • 3 bedrooms

Watch Dolphins play in Shelter Cove while you swim
Entire Place • 3 bedrooms
Note: Performance varies based on location, size, amenities, seasonality, and management quality. Data reflects the past 12 months.
Top Performing Airbnb Hosts in Key Colony Beach (2026)
Learn from the best! This table showcases top-performing Airbnb hosts in Key Colony Beach based on the number of properties managed and estimated total revenue over the past year. Analyze their scale and performance metrics.
| Host Name | Properties | Grossing Revenue | Stay Reviews | Avg Rating |
|---|---|---|---|---|
| Kim | 23 | $1,864,882 | 4975 | 4.92/5.0 |
| Cindy | 18 | $1,089,376 | 1884 | 4.82/5.0 |
| Leslie | 26 | $1,089,073 | 362 | 4.85/5.0 |
| Keys 2 Joy | 18 | $940,692 | 446 | 4.79/5.0 |
| Vacation Rentals Of The Fla Ke | 17 | $501,608 | 339 | 4.71/5.0 |
| Sandy Palms | 4 | $449,112 | 31 | 4.95/5.0 |
| Coco Plum | 7 | $350,784 | 36 | 4.84/5.0 |
| Luis | 3 | $299,716 | 42 | 5.00/5.0 |
| Pamela | 6 | $282,999 | 106 | 4.89/5.0 |
| Fred | 3 | $188,190 | 290 | 4.92/5.0 |
Analyzing the strategies of top hosts, such as their property selection, pricing, and guest communication, can offer valuable lessons for optimizing your own Airbnb operations in Key Colony Beach.
Dive Deeper: Advanced Key Colony Beach STR Market Data (2026)
Ready to unlock more insights? AirROI provides access to advanced metrics and comprehensive Airbnb data for Key Colony Beach. Explore detailed analytics beyond this report to refine your investment strategy, optimize pricing, and maximize your vacation rental profits.
Explore Advanced MetricsKey Colony Beach Short-Term Rental Market Composition (2026): Property & Room Types
Room Type Distribution
Property Type Distribution
Market Composition Insights for Key Colony Beach
- The Key Colony Beach Airbnb market composition is heavily skewed towards Entire Home/Apt listings, which make up 99.6% of the 264 active rentals. This indicates strong guest preference for privacy and space.
- Looking at the property type distribution in Key Colony Beach, House properties are the most common (76.1%), reflecting the local real estate landscape.
- Houses represent a significant 76.1% portion, catering likely to families or larger groups.
- Smaller segments like outdoor/unique, hotel/boutique (combined 1.2%) offer potential for unique stay experiences.
Key Colony Beach Airbnb Room Capacity Analysis (2026): Bedroom Distribution
Distribution of Listings by Number of Bedrooms
Room Capacity Insights for Key Colony Beach
- The dominant room capacity in Key Colony Beach is 2 bedrooms listings, making up 39% of the market. This suggests a strong demand for properties suitable for couples or solo travelers.
- Together, 2 bedrooms and 3 bedrooms properties represent 70.1% of the active Airbnb listings in Key Colony Beach, indicating a high concentration in these sizes.
- A significant 45.8% of listings offer 3+ bedrooms, catering to larger groups and families seeking more space in Key Colony Beach.
Key Colony Beach Vacation Rental Guest Capacity Trends (2026)
Distribution of Listings by Guest Capacity
Guest Capacity Insights for Key Colony Beach
- The most common guest capacity trend in Key Colony Beach vacation rentals is listings accommodating 4 guests (34.1%). This suggests the primary traveler segment is likely small families or groups.
- Properties designed for 4 guests and 8+ guests dominate the Key Colony Beach STR market, accounting for 59.1% of listings.
- 53.7% of properties accommodate 6+ guests, serving the market segment for larger families or group travel in Key Colony Beach.
- On average, properties in Key Colony Beach are equipped to host 5.6 guests.
Key Colony Beach Airbnb Booking Patterns (2026): Available vs. Booked Days
Available Days Distribution
Booked Days Distribution
Booking Pattern Insights for Key Colony Beach
- The most common availability pattern in Key Colony Beach falls within the 271-366 days range, representing 34.8% of listings. This suggests many properties have significant open periods on their calendars.
- Approximately 63.2% of listings show high availability (181+ days open annually), indicating potential for increased bookings or specific owner usage patterns.
- For booked days, the 181-270 days range is most frequent in Key Colony Beach (31.4%), reflecting common guest stay durations or potential owner blocking patterns.
- A notable 38.2% of properties secure long booking periods (181+ days booked per year), highlighting successful long-term rental strategies or significant owner usage.
Key Colony Beach Airbnb Minimum Stay Requirements Analysis
Distribution of Listings by Minimum Night Requirement
1 Night
1 listings
0.4% of total
2 Nights
13 listings
4.9% of total
4-6 Nights
13 listings
4.9% of total
7-29 Nights
158 listings
59.8% of total
30+ Nights
79 listings
29.9% of total
Key Insights
- The most prevalent minimum stay requirement in Key Colony Beach is 7-29 Nights, adopted by 59.8% of listings. This highlights the market's preference for shorter, flexible bookings.
- Very short stays (1-2 nights) are less common (5.3%), suggesting hosts prefer slightly longer bookings to optimize turnover.
- A significant segment (29.9%) caters to monthly stays (30+ nights) in Key Colony Beach, pointing to opportunities in the extended-stay market.
Recommendations
- Align with the market by considering a 7-29 Nights minimum stay, as 59.8% of Key Colony Beach hosts use this setting.
- If feasible, allowing 1-night stays, especially midweek or during low season, could capture last-minute bookings, as only 0.4% currently do.
- Explore offering discounts for stays of 30+ nights to attract the 29.9% of the market seeking extended stays.
- Adjust minimum nights based on seasonality – potentially shorter during low season and longer during peak demand periods in Key Colony Beach.
Key Colony Beach Airbnb Cancellation Policy Trends Analysis (2026)
Super Strict 30 Days
21 listings
8% of total
Super Strict 60 Days
61 listings
23.1% of total
Limited
2 listings
0.8% of total
Flexible
10 listings
3.8% of total
Moderate
12 listings
4.5% of total
Firm
100 listings
37.9% of total
Strict
58 listings
22% of total
Cancellation Policy Insights for Key Colony Beach
- The prevailing Airbnb cancellation policy trend in Key Colony Beach is Firm, used by 37.9% of listings.
- A majority (59.9%) of hosts in Key Colony Beach utilize Firm or Strict policies, indicating a market where hosts prioritize booking security.
Recommendations for Hosts
- Consider adopting a Firm policy to align with the 37.9% market standard in Key Colony Beach.
- Regularly review your cancellation policy against competitors and market demand shifts in Key Colony Beach.
Key Colony Beach STR Booking Lead Time Analysis (2026)
Average Booking Lead Time by Month
Booking Lead Time Insights for Key Colony Beach
- The overall average booking lead time for vacation rentals in Key Colony Beach is 106 days.
- Guests book furthest in advance for stays during February (average 163 days), likely coinciding with peak travel demand or local events.
- The shortest booking windows occur for stays in August (average 78 days), indicating more last-minute travel plans during this time.
- Seasonally, Winter (141 days avg.) sees the longest lead times, while Summer (80 days avg.) has the shortest, reflecting typical travel planning cycles.
Recommendations for Hosts
- Use the overall average lead time (106 days) as a baseline for your pricing and availability strategy in Key Colony Beach.
- For February stays, consider implementing length-of-stay discounts or slightly higher rates for bookings made less than 163 days out to capitalize on advance planning.
- Target marketing efforts for the Winter season well in advance (at least 141 days) to capture early planners.
- Monitor your own booking lead times against these Key Colony Beach averages to identify opportunities for dynamic pricing adjustments.
Popular & Essential Airbnb Amenities in Key Colony Beach (2026)
Amenity Prevalence
Amenity Insights for Key Colony Beach
- Essential amenities in Key Colony Beach that guests expect include: Air conditioning, Wifi, TV, Washer, Kitchen, Smoke alarm, Coffee maker, Dryer, Refrigerator. Lacking these (any) could significantly impact bookings.
- Popular amenities like Fire extinguisher are common but not universal. Offering these can provide a competitive edge.
Recommendations for Hosts
- Ensure your listing includes all essential amenities for Key Colony Beach: Air conditioning, Wifi, TV, Washer, Kitchen, Smoke alarm, Coffee maker, Dryer, Refrigerator.
- Prioritize adding missing essentials: Wifi, TV, Washer, Kitchen, Smoke alarm, Coffee maker, Dryer, Refrigerator.
- Consider adding popular differentiators like Fire extinguisher to increase appeal.
- Highlight unique or less common amenities you offer (e.g., hot tub, dedicated workspace, EV charger) in your listing description and photos.
- Regularly check competitor amenities in Key Colony Beach to stay competitive.
Key Colony Beach Airbnb Guest Demographics & Profile Analysis (2026)
Guest Profile Summary for Key Colony Beach
- The typical guest profile for Airbnb in Key Colony Beach consists of primarily domestic travelers (95%), often arriving from nearby Miami, typically belonging to the Post-2000s (Gen Z/Alpha) group (50%), primarily speaking English or Spanish.
- Domestic travelers account for 95.1% of guests.
- Key international markets include United States (95.1%) and United Kingdom (1.6%).
- Top languages spoken are English (72.5%) followed by Spanish (10.8%).
- A significant demographic segment is the Post-2000s (Gen Z/Alpha) group, representing 50% of guests.
Recommendations for Hosts
- Target domestic marketing efforts towards travelers from Miami and Orlando.
- Tailor amenities and listing descriptions to appeal to the dominant Post-2000s (Gen Z/Alpha) demographic (e.g., highlight fast WiFi, smart home features, local guides).
- Highlight unique local experiences or amenities relevant to the primary guest profile.
- Consider seasonal promotions aligned with peak travel times for key origin markets.
Nearby Short-Term Rental Market Comparison
How does the Key Colony Beach Airbnb market stack up against its neighbors? Compare key performance metrics like average monthly revenue, ADR, and occupancy rates in surrounding areas to understand the broader regional STR landscape.
| Market | Active Properties | Monthly Revenue | Daily Rate | Avg. Occupancy |
|---|---|---|---|---|
| Stock Island | 107 | $9,731 | $733.54 | 47% |
| Bal Harbour Village | 37 | $8,846 | $850.63 | 34% |
| Key West | 1,137 | $7,525 | $630.09 | 47% |
| Pinecrest | 11 | $6,117 | $861.24 | 43% |
| North Bay Village | 120 | $6,032 | $561.12 | 44% |
| Duck Key | 60 | $5,308 | $504.94 | 43% |
| Little Torch Key | 20 | $5,131 | $701.83 | 29% |
| Marathon | 987 | $4,795 | $489.03 | 42% |
| Key Biscayne | 104 | $4,470 | $448.61 | 49% |
| Miami Shores | 90 | $4,360 | $453.13 | 47% |