Key Biscayne Airbnb Market Analysis 2026: Short Term Rental Data & Vacation Rental Statistics in Florida, United States
Is Airbnb profitable in Key Biscayne in 2026? Explore comprehensive Airbnb analytics for Key Biscayne, Florida, United States to uncover income potential. This 2026 STR market report for Key Biscayne, based on AirROI data from February 2025 to January 2026, reveals key trends in the niche market of 104 active listings.
Whether you're considering an Airbnb investment in Key Biscayne, optimizing your existing vacation rental, or exploring rental arbitrage opportunities, understanding the Key Biscayne Airbnb data is crucial. Leveraging the low regulation environment is key to maximizing your short term rental income potential. Let's dive into the specifics.
Key Key Biscayne Airbnb Performance Metrics Overview
Monthly Airbnb Revenue Variations & Income Potential in Key Biscayne (2026)
Understanding the monthly revenue variations for Airbnb listings in Key Biscayne is key to maximizing your short term rental income potential. Seasonality significantly impacts earnings. Our analysis, based on data from the past 12 months, shows that the peak revenue month for STRs in Key Biscayne is typically March, while September often presents the lowest earnings, highlighting opportunities for strategic pricing adjustments during shoulder and low seasons. Explore the typical Airbnb income in Key Biscayne across different performance tiers:
- Best-in-class properties (Top 10%) achieve $12,229+ monthly, often utilizing dynamic pricing and superior guest experiences.
- Strong performing properties (Top 25%) earn $8,802 or more, indicating effective management and desirable locations/amenities.
- Typical properties (Median) generate around $5,029 per month, representing the average market performance.
- Entry-level properties (Bottom 25%) see earnings around $2,916, often with potential for optimization.
Average Monthly Airbnb Earnings Trend in Key Biscayne
Key Biscayne Airbnb Occupancy Rate Trends (2026)
Maximize your bookings by understanding the Key Biscayne STR occupancy trends. Seasonal demand shifts significantly influence how often properties are booked. Typically, Marchsees the highest demand (peak season occupancy), while September experiences the lowest (low season). Effective strategies, like adjusting minimum stays or offering promotions, can boost occupancy during slower periods. Here's how different property tiers perform in Key Biscayne:
- Best-in-class properties (Top 10%) achieve 85%+ occupancy, indicating high desirability and potentially optimized availability.
- Strong performing properties (Top 25%) maintain 73% or higher occupancy, suggesting good market fit and guest satisfaction.
- Typical properties (Median) have an occupancy rate around 52%.
- Entry-level properties (Bottom 25%) average 32% occupancy, potentially facing higher vacancy.
Average Monthly Occupancy Rate Trend in Key Biscayne
Average Daily Rate (ADR) Airbnb Trends in Key Biscayne (2026)
Effective short term rental pricing strategy in Key Biscayne involves understanding monthly ADR fluctuations. The Average Daily Rate (ADR) for Airbnb in Key Biscayne typically peaks in February and dips lowest during September. Leveraging Airbnb dynamic pricing tools or strategies based on this seasonality can significantly boost revenue. Here's a look at the typical nightly rates achieved:
- Best-in-class properties (Top 10%) command rates of $957+ per night, often due to premium features or locations.
- Strong performing properties (Top 25%) achieve nightly rates of $629 or more.
- Typical properties (Median) charge around $404 per night.
- Entry-level properties (Bottom 25%) earn around $208 per night.
Average Daily Rate (ADR) Trend by Month in Key Biscayne
Get Live Key Biscayne Market Intelligence 👇

Explore Real-time Analytics
Airbnb Seasonality Analysis & Trends in Key Biscayne (2026)
Peak Season (March, February, April)
- Revenue averages $9,468 per month
- Occupancy rates average 69.3%
- Daily rates average $511
Shoulder Season
- Revenue averages $6,082 per month
- Occupancy maintains around 48.3%
- Daily rates hold near $489
Low Season (August, September, October)
- Revenue drops to average $3,934 per month
- Occupancy decreases to average 41.2%
- Daily rates adjust to average $461
Seasonality Insights for Key Biscayne
- The Airbnb seasonality in Key Biscayne shows highly seasonal trends requiring careful strategy. While the sections above show seasonal averages, it's also insightful to look at the extremes:
- During the high season, the absolute peak month showcases Key Biscayne's highest earning potential, with monthly revenues capable of climbing to $10,255, occupancy reaching a high of 72.2%, and ADRs peaking at $520.
- Conversely, the slowest single month of the year, typically falling within the low season, marks the market's lowest point. In this month, revenue might dip to $2,900, occupancy could drop to 35.0%, and ADRs may adjust down to $452.
- Understanding both the seasonal averages and these monthly peaks and troughs in revenue, occupancy, and ADR is crucial for maximizing your Airbnb profit potential in Key Biscayne.
Seasonal Strategies for Maximizing Profit
- Peak Season: Maximize revenue through premium pricing and potentially longer minimum stays. Ensure high availability.
- Low Season: Offer competitive pricing, special promotions (e.g., extended stay discounts), and flexible cancellation policies. Target off-season travelers like remote workers or budget-conscious guests.
- Shoulder Seasons: Implement dynamic pricing that balances peak and low rates. Target weekend travelers or specific events. Offer slightly more flexible terms than peak season.
- Regularly analyze your own performance against these Key Biscayne seasonality benchmarks and adjust your pricing and availability strategy accordingly.
Best Areas for Airbnb Investment in Key Biscayne (2026)
Exploring the top neighborhoods for short-term rentals in Key Biscayne? This section highlights key areas, outlining why they are attractive for hosts and guests, along with notable local attractions. Consider these locations based on your target guest profile and investment strategy.
| Neighborhood / Area | Why Host Here? (Target Guests & Appeal) | Key Attractions & Landmarks |
|---|---|---|
| Village Green | A charming neighborhood with lush greenery and a tranquil atmosphere, perfect for families and those seeking relaxation. Close to parks and local amenities. | Crandon Park, Bill Baggs Cape Florida State Park, Key Biscayne Village Green Park, Beach Access, Local Shops and Cafes |
| Beachfront Area | Direct access to the stunning beaches of Key Biscayne, making it ideal for sun-seekers and water sports enthusiasts. Fantastic views and a vibrant beach culture. | Key Biscayne Beach, Cape Florida Lighthouse, Water Sports Rentals, Nature Trails, Picnic Areas |
| Coconut Grove | Though a bit further, this area is known for its bohemian vibe, eclectic shops, and outdoor cafes. Attracts a diverse crowd looking for a unique experience. | CocoWalk, Vizcaya Museum and Gardens, Rivas Park, Bayshore Drive, Coconut Grove Arts Festival |
| Crandon Boulevard | The main commercial thoroughfare of Key Biscayne, hosting numerous shops, cafes, and restaurants. High foot traffic area ideal for hosting tourists. | Local Restaurants, Shopping Venues, Ice Cream Shops, Fitness Centers, Grocery Stores |
| Hibiscus Island | An exclusive enclave with luxurious properties and a serene environment. Perfect for high-end vacation rentals and affluent guests. | Private Beach Access, Luxury Residences, Gated Community Features, Secluded Parks, Scenic Views |
| Cape Florida | Home to the historic lighthouse and scenic beaches, this area is great for tourists interested in nature and history. | Cape Florida Lighthouse, Lighthouse Park, Beach Access, Kayaking Tours, Historical Tours |
| Key Biscayne Lighthouse | Iconic landmark attracting visitors interested in history and photography, with beautiful landscapes and ocean views. | Cape Florida Lighthouse, Nature Trails, Historic Sites, Photography Spots, Beach Areas |
| Bayside Area | Offers restaurants and bars with viewings of the bay, great for nightlife and social activities. Attracts younger crowds and socialites. | Waterfront Dining, Nightlife Venues, Parks and Playgrounds, Access to Boating Activities, Live Music Locations |
Understanding Airbnb License Requirements & STR Laws in Key Biscayne (2026)
While Key Biscayne, Florida, United States currently shows low STR regulations, specific Airbnb license requirements might still exist or change. Always verify the latest short term rental regulations and Airbnb license requirements directly with local government authorities for Key Biscayne to ensure full compliance before hosting.
(Source: AirROI data, 2026, based on 1% licensed listings)
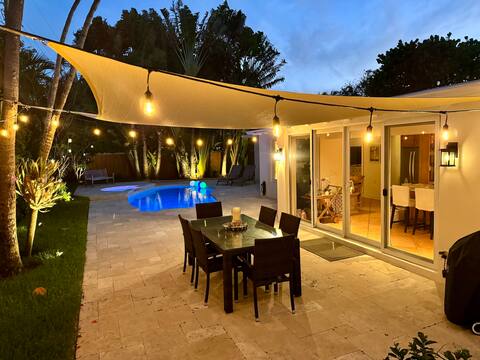
Top Performing Airbnb Properties in Key Biscayne (2026)
Benchmark your potential! Explore examples of top-performing Airbnb properties in Key Biscaynebased on Trailing Twelve Month (TTM) revenue. Analyze their characteristics, revenue, occupancy rate, and ADR to understand what drives success in this market.

Luxury 4-Bedroom Villa in Key Biscayne
Entire Place • 4 bedrooms

Condo on Key Biscayne Oceanfront
Entire Place • 3 bedrooms
Casa Las Palmas in Key Biscayne.
Entire Place • 4 bedrooms

Tropical Retreat with Beach & Resort Amenities
Entire Place • 3 bedrooms

KEY BISCAYNE BEACH VACATION #3
Entire Place • 3 bedrooms

Oceanfront Family Condo – Calm Beach Getaway
Entire Place • 3 bedrooms
Note: Performance varies based on location, size, amenities, seasonality, and management quality. Data reflects the past 12 months.
Top Performing Airbnb Hosts in Key Biscayne (2026)
Learn from the best! This table showcases top-performing Airbnb hosts in Key Biscayne based on the number of properties managed and estimated total revenue over the past year. Analyze their scale and performance metrics.
| Host Name | Properties | Grossing Revenue | Stay Reviews | Avg Rating |
|---|---|---|---|---|
| Gloria Ibarra | 6 | $408,841 | 164 | 4.79/5.0 |
| Quentin | 7 | $386,806 | 413 | 4.81/5.0 |
| Vanesa | 1 | $313,488 | 9 | 5.00/5.0 |
| Silvia | 3 | $287,868 | 209 | 4.80/5.0 |
| Sheryl | 3 | $272,039 | 122 | 4.77/5.0 |
| Florida Stays | 8 | $237,284 | 43 | 3.38/5.0 |
| Lucia | 2 | $209,844 | 65 | 4.96/5.0 |
| Ammos Vacation Rentals | 2 | $163,254 | 20 | 4.43/5.0 |
| Sofía & Daniel | 3 | $160,683 | 36 | 4.78/5.0 |
| Alberto | 1 | $149,277 | 59 | 4.95/5.0 |
Analyzing the strategies of top hosts, such as their property selection, pricing, and guest communication, can offer valuable lessons for optimizing your own Airbnb operations in Key Biscayne.
Dive Deeper: Advanced Key Biscayne STR Market Data (2026)
Ready to unlock more insights? AirROI provides access to advanced metrics and comprehensive Airbnb data for Key Biscayne. Explore detailed analytics beyond this report to refine your investment strategy, optimize pricing, and maximize your vacation rental profits.
Explore Advanced MetricsKey Biscayne Short-Term Rental Market Composition (2026): Property & Room Types
Room Type Distribution
Property Type Distribution
Market Composition Insights for Key Biscayne
- The Key Biscayne Airbnb market composition is heavily skewed towards Entire Home/Apt listings, which make up 98.1% of the 104 active rentals. This indicates strong guest preference for privacy and space.
- Looking at the property type distribution in Key Biscayne, Apartment/Condo properties are the most common (86.5%), reflecting the local real estate landscape.
Key Biscayne Airbnb Room Capacity Analysis (2026): Bedroom Distribution
Distribution of Listings by Number of Bedrooms
Room Capacity Insights for Key Biscayne
- The dominant room capacity in Key Biscayne is 1 bedroom listings, making up 38.5% of the market. This suggests a strong demand for properties suitable for couples or solo travelers.
- Together, 1 bedroom and 3 bedrooms properties represent 61.6% of the active Airbnb listings in Key Biscayne, indicating a high concentration in these sizes.
- A significant 34.7% of listings offer 3+ bedrooms, catering to larger groups and families seeking more space in Key Biscayne.
Key Biscayne Vacation Rental Guest Capacity Trends (2026)
Distribution of Listings by Guest Capacity
Guest Capacity Insights for Key Biscayne
- The most common guest capacity trend in Key Biscayne vacation rentals is listings accommodating 4 guests (31.7%). This suggests the primary traveler segment is likely small families or groups.
- Properties designed for 4 guests and 8+ guests dominate the Key Biscayne STR market, accounting for 55.7% of listings.
- 37.5% of properties accommodate 6+ guests, serving the market segment for larger families or group travel in Key Biscayne.
- On average, properties in Key Biscayne are equipped to host 5.2 guests.
Key Biscayne Airbnb Booking Patterns (2026): Available vs. Booked Days
Available Days Distribution
Booked Days Distribution
Booking Pattern Insights for Key Biscayne
- The most common availability pattern in Key Biscayne falls within the 271-366 days range, representing 42.3% of listings. This suggests many properties have significant open periods on their calendars.
- Approximately 62.5% of listings show high availability (181+ days open annually), indicating potential for increased bookings or specific owner usage patterns.
- For booked days, the 181-270 days range is most frequent in Key Biscayne (29.8%), reflecting common guest stay durations or potential owner blocking patterns.
- A notable 38.5% of properties secure long booking periods (181+ days booked per year), highlighting successful long-term rental strategies or significant owner usage.
Key Biscayne Airbnb Minimum Stay Requirements Analysis
Distribution of Listings by Minimum Night Requirement
1 Night
10 listings
9.6% of total
2 Nights
6 listings
5.8% of total
3 Nights
9 listings
8.7% of total
4-6 Nights
20 listings
19.2% of total
7-29 Nights
13 listings
12.5% of total
30+ Nights
46 listings
44.2% of total
Key Insights
- The most prevalent minimum stay requirement in Key Biscayne is 30+ Nights, adopted by 44.2% of listings. This highlights the market's preference for longer commitments.
- Very short stays (1-2 nights) are less common (15.4%), suggesting hosts prefer slightly longer bookings to optimize turnover.
- A significant segment (44.2%) caters to monthly stays (30+ nights) in Key Biscayne, pointing to opportunities in the extended-stay market.
Recommendations
- Align with the market by considering a 30+ Nights minimum stay, as 44.2% of Key Biscayne hosts use this setting.
- If feasible, allowing 1-night stays, especially midweek or during low season, could capture last-minute bookings, as only 9.6% currently do.
- Explore offering discounts for stays of 30+ nights to attract the 44.2% of the market seeking extended stays.
- Adjust minimum nights based on seasonality – potentially shorter during low season and longer during peak demand periods in Key Biscayne.
Key Biscayne Airbnb Cancellation Policy Trends Analysis (2026)
Super Strict 30 Days
10 listings
9.6% of total
Limited
2 listings
1.9% of total
Flexible
6 listings
5.8% of total
Moderate
21 listings
20.2% of total
Firm
42 listings
40.4% of total
Strict
23 listings
22.1% of total
Cancellation Policy Insights for Key Biscayne
- The prevailing Airbnb cancellation policy trend in Key Biscayne is Firm, used by 40.4% of listings.
- A majority (62.5%) of hosts in Key Biscayne utilize Firm or Strict policies, indicating a market where hosts prioritize booking security.
Recommendations for Hosts
- Consider adopting a Firm policy to align with the 40.4% market standard in Key Biscayne.
- Regularly review your cancellation policy against competitors and market demand shifts in Key Biscayne.
Key Biscayne STR Booking Lead Time Analysis (2026)
Average Booking Lead Time by Month
Booking Lead Time Insights for Key Biscayne
- The overall average booking lead time for vacation rentals in Key Biscayne is 62 days.
- Guests book furthest in advance for stays during February (average 90 days), likely coinciding with peak travel demand or local events.
- The shortest booking windows occur for stays in September (average 28 days), indicating more last-minute travel plans during this time.
- Seasonally, Winter (89 days avg.) sees the longest lead times, while Fall (45 days avg.) has the shortest, reflecting typical travel planning cycles.
Recommendations for Hosts
- Use the overall average lead time (62 days) as a baseline for your pricing and availability strategy in Key Biscayne.
- For February stays, consider implementing length-of-stay discounts or slightly higher rates for bookings made less than 90 days out to capitalize on advance planning.
- Target marketing efforts for the Winter season well in advance (at least 89 days) to capture early planners.
- Monitor your own booking lead times against these Key Biscayne averages to identify opportunities for dynamic pricing adjustments.
Popular & Essential Airbnb Amenities in Key Biscayne (2026)
Amenity Prevalence
Amenity Insights for Key Biscayne
- Essential amenities in Key Biscayne that guests expect include: Wifi, Air conditioning, TV, Kitchen, Pool, Smoke alarm. Lacking these (any) could significantly impact bookings.
- Popular amenities like Free parking on premises, Hair dryer, Coffee maker are common but not universal. Offering these can provide a competitive edge.
Recommendations for Hosts
- Ensure your listing includes all essential amenities for Key Biscayne: Wifi, Air conditioning, TV, Kitchen, Pool, Smoke alarm.
- Prioritize adding missing essentials: Air conditioning, TV, Kitchen, Pool, Smoke alarm.
- Consider adding popular differentiators like Free parking on premises or Hair dryer to increase appeal.
- Highlight unique or less common amenities you offer (e.g., hot tub, dedicated workspace, EV charger) in your listing description and photos.
- Regularly check competitor amenities in Key Biscayne to stay competitive.
Key Biscayne Airbnb Guest Demographics & Profile Analysis (2026)
Guest Profile Summary for Key Biscayne
- The typical guest profile for Airbnb in Key Biscayne consists of primarily domestic travelers (79%), often arriving from nearby New York, typically belonging to the Post-2000s (Gen Z/Alpha) group (50%), primarily speaking English or Spanish.
- Domestic travelers account for 78.7% of guests.
- Key international markets include United States (78.7%) and Argentina (2.2%).
- Top languages spoken are English (54.4%) followed by Spanish (22.3%).
- A significant demographic segment is the Post-2000s (Gen Z/Alpha) group, representing 50% of guests.
Recommendations for Hosts
- Target domestic marketing efforts towards travelers from New York and Miami.
- Tailor amenities and listing descriptions to appeal to the dominant Post-2000s (Gen Z/Alpha) demographic (e.g., highlight fast WiFi, smart home features, local guides).
- Highlight unique local experiences or amenities relevant to the primary guest profile.
- Consider seasonal promotions aligned with peak travel times for key origin markets.
Nearby Short-Term Rental Market Comparison
How does the Key Biscayne Airbnb market stack up against its neighbors? Compare key performance metrics like average monthly revenue, ADR, and occupancy rates in surrounding areas to understand the broader regional STR landscape.
| Market | Active Properties | Monthly Revenue | Daily Rate | Avg. Occupancy |
|---|---|---|---|---|
| Stock Island | 107 | $9,731 | $733.54 | 47% |
| Bal Harbour Village | 37 | $8,846 | $850.63 | 34% |
| Key West | 1,137 | $7,525 | $630.09 | 47% |
| Lake Clarke Shores | 26 | $6,710 | $516.52 | 46% |
| Lighthouse Point | 75 | $6,205 | $472.94 | 51% |
| Pinecrest | 11 | $6,117 | $861.24 | 43% |
| North Bay Village | 120 | $6,032 | $561.12 | 44% |
| Duck Key | 60 | $5,308 | $504.94 | 43% |
| Little Torch Key | 20 | $5,131 | $701.83 | 29% |
| Tequesta | 43 | $4,920 | $376.96 | 50% |