Juno Beach Airbnb Market Analysis 2026: Short Term Rental Data & Vacation Rental Statistics in Florida, United States
Is Airbnb profitable in Juno Beach in 2026? Explore comprehensive Airbnb analytics for Juno Beach, Florida, United States to uncover income potential. This 2026 STR market report for Juno Beach, based on AirROI data from February 2025 to January 2026, reveals key trends in the niche market of 39 active listings.
Whether you're considering an Airbnb investment in Juno Beach, optimizing your existing vacation rental, or exploring rental arbitrage opportunities, understanding the Juno Beach Airbnb data is crucial. Navigating the high regulation landscape is key to maximizing your short term rental income potential. Let's dive into the specifics.
Key Juno Beach Airbnb Performance Metrics Overview
Monthly Airbnb Revenue Variations & Income Potential in Juno Beach (2026)
Understanding the monthly revenue variations for Airbnb listings in Juno Beach is key to maximizing your short term rental income potential. Seasonality significantly impacts earnings. Our analysis, based on data from the past 12 months, shows that the peak revenue month for STRs in Juno Beach is typically March, while September often presents the lowest earnings, highlighting opportunities for strategic pricing adjustments during shoulder and low seasons. Explore the typical Airbnb income in Juno Beach across different performance tiers:
- Best-in-class properties (Top 10%) achieve $11,576+ monthly, often utilizing dynamic pricing and superior guest experiences.
- Strong performing properties (Top 25%) earn $8,670 or more, indicating effective management and desirable locations/amenities.
- Typical properties (Median) generate around $4,807 per month, representing the average market performance.
- Entry-level properties (Bottom 25%) see earnings around $2,472, often with potential for optimization.
Average Monthly Airbnb Earnings Trend in Juno Beach
Juno Beach Airbnb Occupancy Rate Trends (2026)
Maximize your bookings by understanding the Juno Beach STR occupancy trends. Seasonal demand shifts significantly influence how often properties are booked. Typically, Februarysees the highest demand (peak season occupancy), while September experiences the lowest (low season). Effective strategies, like adjusting minimum stays or offering promotions, can boost occupancy during slower periods. Here's how different property tiers perform in Juno Beach:
- Best-in-class properties (Top 10%) achieve 79%+ occupancy, indicating high desirability and potentially optimized availability.
- Strong performing properties (Top 25%) maintain 66% or higher occupancy, suggesting good market fit and guest satisfaction.
- Typical properties (Median) have an occupancy rate around 47%.
- Entry-level properties (Bottom 25%) average 26% occupancy, potentially facing higher vacancy.
Average Monthly Occupancy Rate Trend in Juno Beach
Average Daily Rate (ADR) Airbnb Trends in Juno Beach (2026)
Effective short term rental pricing strategy in Juno Beach involves understanding monthly ADR fluctuations. The Average Daily Rate (ADR) for Airbnb in Juno Beach typically peaks in January and dips lowest during August. Leveraging Airbnb dynamic pricing tools or strategies based on this seasonality can significantly boost revenue. Here's a look at the typical nightly rates achieved:
- Best-in-class properties (Top 10%) command rates of $612+ per night, often due to premium features or locations.
- Strong performing properties (Top 25%) achieve nightly rates of $489 or more.
- Typical properties (Median) charge around $357 per night.
- Entry-level properties (Bottom 25%) earn around $263 per night.
Average Daily Rate (ADR) Trend by Month in Juno Beach
Get Live Juno Beach Market Intelligence 👇

Explore Real-time Analytics
Airbnb Seasonality Analysis & Trends in Juno Beach (2026)
Peak Season (March, February, January)
- Revenue averages $8,868 per month
- Occupancy rates average 56.0%
- Daily rates average $487
Shoulder Season
- Revenue averages $5,757 per month
- Occupancy maintains around 46.7%
- Daily rates hold near $396
Low Season (August, September, October)
- Revenue drops to average $3,725 per month
- Occupancy decreases to average 37.7%
- Daily rates adjust to average $348
Seasonality Insights for Juno Beach
- The Airbnb seasonality in Juno Beach shows highly seasonal trends requiring careful strategy. While the sections above show seasonal averages, it's also insightful to look at the extremes:
- During the high season, the absolute peak month showcases Juno Beach's highest earning potential, with monthly revenues capable of climbing to $9,523, occupancy reaching a high of 64.1%, and ADRs peaking at $587.
- Conversely, the slowest single month of the year, typically falling within the low season, marks the market's lowest point. In this month, revenue might dip to $3,198, occupancy could drop to 34.1%, and ADRs may adjust down to $315.
- Understanding both the seasonal averages and these monthly peaks and troughs in revenue, occupancy, and ADR is crucial for maximizing your Airbnb profit potential in Juno Beach.
Seasonal Strategies for Maximizing Profit
- Peak Season: Maximize revenue through premium pricing and potentially longer minimum stays. Ensure high availability.
- Low Season: Offer competitive pricing, special promotions (e.g., extended stay discounts), and flexible cancellation policies. Target off-season travelers like remote workers or budget-conscious guests.
- Shoulder Seasons: Implement dynamic pricing that balances peak and low rates. Target weekend travelers or specific events. Offer slightly more flexible terms than peak season.
- Regularly analyze your own performance against these Juno Beach seasonality benchmarks and adjust your pricing and availability strategy accordingly.
Best Areas for Airbnb Investment in Juno Beach (2026)
Exploring the top neighborhoods for short-term rentals in Juno Beach? This section highlights key areas, outlining why they are attractive for hosts and guests, along with notable local attractions. Consider these locations based on your target guest profile and investment strategy.
| Neighborhood / Area | Why Host Here? (Target Guests & Appeal) | Key Attractions & Landmarks |
|---|---|---|
| Juno Beach | A peaceful coastal town known for its beautiful beaches and laid-back atmosphere. Ideal for travelers looking for a relaxing beach getaway with proximity to restaurants and outdoor activities. | Juno Beach Pier, Loggerhead Marinelife Center, Juno Beach Park, Inlet Park, Dry Tortugas National Park, Guanabanas Restaurant |
| Palm Beach Gardens | Adjacent to Juno Beach, this area is famous for its upscale shopping, golf courses, and beautiful parks. Attracts both families and golf enthusiasts seeking a more suburban vacation experience. | The Gardens Mall, PGA National Resort, Macroburst Water Park, Downtown at the Gardens, Loxahatchee River, Palm Beach Gardens Golf Club |
| Singer Island | Known for its beautiful beaches and luxury resorts, Singer Island is popular among travelers looking for upscale accommodations and water sports activities. | Singer Island Beach, Riviera Beach, Phil Foster Park, Ocean Reef Park, Diving and snorkeling hotspots, Snorkeling at the Blue Heron Bridge |
| West Palm Beach | A vibrant city with a rich cultural scene, West Palm Beach is packed with dining, shopping, and entertainment options, making it an excellent choice for travelers wanting more than just a beach stay. | Clematis Street, Norton Museum of Art, CityPlace, Kravis Center for the Performing Arts, Palm Beach Zoo, South Florida Science Center and Aquarium |
| Tequesta | A quaint town near Juno Beach, Tequesta offers a small-town feel with a variety of local eateries and boutique shopping, ideal for travelers seeking a quiet retreat. | Tequesta Park, Coral Cove Park, Jonathan Dickinson State Park, Local art galleries, Tequesta Country Club |
| Lake Worth Beach | A quirky beach town with a vibrant arts community. Great for visitors looking for unique shops, art, and cultural experiences along with beautiful beaches. | Lake Worth Beach, Lake Worth Playhouse, Cultural Council for Palm Beach County, Artisor, Bamboo Garden |
| Delray Beach | A lively beach town known for its vibrant nightlife, restaurants, and arts scene. Popular among young travelers and those looking for entertainment along with sun and sand. | Atlantic Avenue, Delray Beach Pavilion, Old School Square, Cornell Art Museum, Sandoway Discovery Center |
| Boynton Beach | A friendly coastal city that offers access to both beach and inland activities. Attractive to families and budget-conscious travelers looking for affordable beach options. | Boynton Beach Oceanfront Park, Gulfstream Park, Boynton Beach Mall, Mangrove Park, Lantana Nature Preserve |
Understanding Airbnb License Requirements & STR Laws in Juno Beach (2026)
Yes, Juno Beach, Florida, United States enforces high STR regulations. Obtaining a license and ensuring compliance is almost certainly required according to current 2026 STR laws. Always verify the latest short term rental regulations and Airbnb license requirements directly with local government authorities for Juno Beach to ensure full compliance before hosting.
(Source: AirROI data, 2026, based on 100% licensed listings)
Top Performing Airbnb Properties in Juno Beach (2026)
Benchmark your potential! Explore examples of top-performing Airbnb properties in Juno Beachbased on Trailing Twelve Month (TTM) revenue. Analyze their characteristics, revenue, occupancy rate, and ADR to understand what drives success in this market.
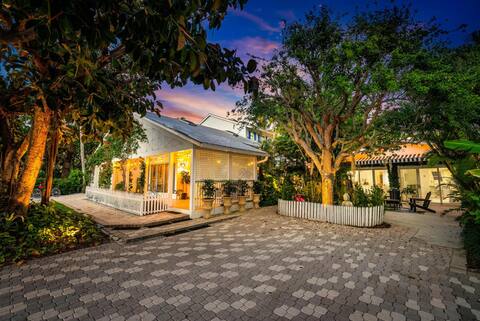
Little Key West, Private 1 Min Walk Beach Entrance
Entire Place • 4 bedrooms
Juno Beach House
Entire Place • 4 bedrooms

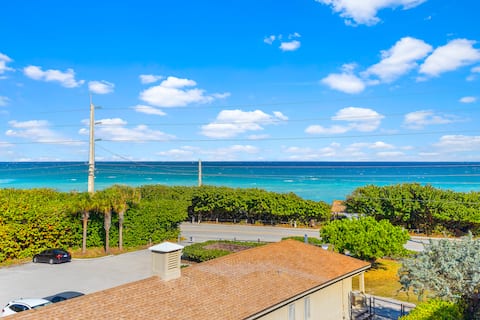
Sunset Ridge Cottage Pool, Views
Entire Place • 3 bedrooms
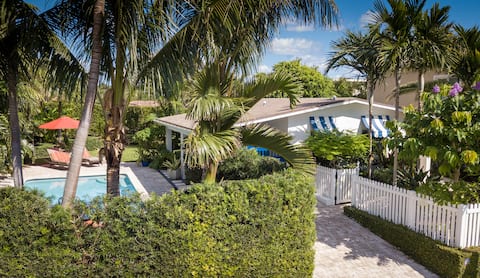
A Stone's Throw Away Cottage
Entire Place • 2 bedrooms
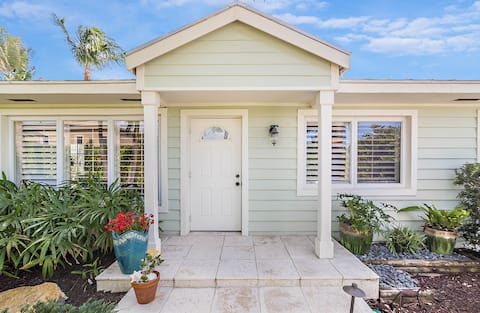
Bright & Airy Luxury Cottage on Juno Beach
Entire Place • 2 bedrooms
Juno Beach House w/ Private Pool: Walk to Beach!
Entire Place • 3 bedrooms
Note: Performance varies based on location, size, amenities, seasonality, and management quality. Data reflects the past 12 months.
Top Performing Airbnb Hosts in Juno Beach (2026)
Learn from the best! This table showcases top-performing Airbnb hosts in Juno Beach based on the number of properties managed and estimated total revenue over the past year. Analyze their scale and performance metrics.
| Host Name | Properties | Grossing Revenue | Stay Reviews | Avg Rating |
|---|---|---|---|---|
| Katie & Lance | 7 | $469,860 | 203 | 4.99/5.0 |
| Kelly | 2 | $330,364 | 39 | 4.97/5.0 |
| Gary | 10 | $321,515 | 1024 | 4.88/5.0 |
| Greg | 1 | $154,026 | 63 | 4.86/5.0 |
| Evolve | 2 | $110,318 | 95 | 4.95/5.0 |
| Jeremy | 1 | $109,821 | 69 | 5.00/5.0 |
| Virginia | 1 | $97,836 | 39 | 4.92/5.0 |
| Patrick | 1 | $92,846 | 51 | 4.94/5.0 |
| Tarun | 1 | $74,479 | 110 | 4.84/5.0 |
| Roman | 1 | $72,522 | 16 | 5.00/5.0 |
Analyzing the strategies of top hosts, such as their property selection, pricing, and guest communication, can offer valuable lessons for optimizing your own Airbnb operations in Juno Beach.
Dive Deeper: Advanced Juno Beach STR Market Data (2026)
Ready to unlock more insights? AirROI provides access to advanced metrics and comprehensive Airbnb data for Juno Beach. Explore detailed analytics beyond this report to refine your investment strategy, optimize pricing, and maximize your vacation rental profits.
Explore Advanced MetricsJuno Beach Short-Term Rental Market Composition (2026): Property & Room Types
Room Type Distribution
Property Type Distribution
Market Composition Insights for Juno Beach
- The Juno Beach Airbnb market composition is heavily skewed towards Entire Home/Apt listings, which make up 71.8% of the 39 active rentals. This indicates strong guest preference for privacy and space.
- Looking at the property type distribution in Juno Beach, House properties are the most common (46.2%), reflecting the local real estate landscape.
- Houses represent a significant 46.2% portion, catering likely to families or larger groups.
- The presence of 25.6% Hotel/Boutique listings indicates integration with traditional hospitality.
Juno Beach Airbnb Room Capacity Analysis (2026): Bedroom Distribution
Distribution of Listings by Number of Bedrooms
Room Capacity Insights for Juno Beach
- The dominant room capacity in Juno Beach is 2 bedrooms listings, making up 35.9% of the market. This suggests a strong demand for properties suitable for couples or solo travelers.
- Together, 2 bedrooms and 1 bedroom properties represent 69.2% of the active Airbnb listings in Juno Beach, indicating a high concentration in these sizes.
- A significant 28.2% of listings offer 3+ bedrooms, catering to larger groups and families seeking more space in Juno Beach.
Juno Beach Vacation Rental Guest Capacity Trends (2026)
Distribution of Listings by Guest Capacity
Guest Capacity Insights for Juno Beach
- The most common guest capacity trend in Juno Beach vacation rentals is listings accommodating 6 guests (25.6%). This suggests the primary traveler segment is likely larger groups.
- Properties designed for 6 guests and 4 guests dominate the Juno Beach STR market, accounting for 51.2% of listings.
- 43.6% of properties accommodate 6+ guests, serving the market segment for larger families or group travel in Juno Beach.
- On average, properties in Juno Beach are equipped to host 4.6 guests.
Juno Beach Airbnb Booking Patterns (2026): Available vs. Booked Days
Available Days Distribution
Booked Days Distribution
Booking Pattern Insights for Juno Beach
- The most common availability pattern in Juno Beach falls within the 181-270 days range, representing 61.5% of listings. This suggests many properties have significant open periods on their calendars.
- Approximately 82.0% of listings show high availability (181+ days open annually), indicating potential for increased bookings or specific owner usage patterns.
- For booked days, the 91-180 days range is most frequent in Juno Beach (59%), reflecting common guest stay durations or potential owner blocking patterns.
- A notable 23.1% of properties secure long booking periods (181+ days booked per year), highlighting successful long-term rental strategies or significant owner usage.
Juno Beach Airbnb Minimum Stay Requirements Analysis
Distribution of Listings by Minimum Night Requirement
1 Night
1 listings
2.6% of total
2 Nights
7 listings
17.9% of total
3 Nights
2 listings
5.1% of total
4-6 Nights
4 listings
10.3% of total
7-29 Nights
4 listings
10.3% of total
30+ Nights
21 listings
53.8% of total
Key Insights
- The most prevalent minimum stay requirement in Juno Beach is 30+ Nights, adopted by 53.8% of listings. This highlights the market's preference for longer commitments.
- A significant segment (53.8%) caters to monthly stays (30+ nights) in Juno Beach, pointing to opportunities in the extended-stay market.
Recommendations
- Align with the market by considering a 30+ Nights minimum stay, as 53.8% of Juno Beach hosts use this setting.
- If feasible, allowing 1-night stays, especially midweek or during low season, could capture last-minute bookings, as only 2.6% currently do.
- Explore offering discounts for stays of 30+ nights to attract the 53.8% of the market seeking extended stays.
- Adjust minimum nights based on seasonality – potentially shorter during low season and longer during peak demand periods in Juno Beach.
Juno Beach Airbnb Cancellation Policy Trends Analysis (2026)
Limited
1 listings
2.6% of total
Super Strict 30 Days
1 listings
2.6% of total
Moderate
1 listings
2.6% of total
Firm
29 listings
74.4% of total
Strict
7 listings
17.9% of total
Cancellation Policy Insights for Juno Beach
- The prevailing Airbnb cancellation policy trend in Juno Beach is Firm, used by 74.4% of listings.
- A majority (92.3%) of hosts in Juno Beach utilize Firm or Strict policies, indicating a market where hosts prioritize booking security.
Recommendations for Hosts
- Consider adopting a Firm policy to align with the 74.4% market standard in Juno Beach.
- Regularly review your cancellation policy against competitors and market demand shifts in Juno Beach.
Juno Beach STR Booking Lead Time Analysis (2026)
Average Booking Lead Time by Month
Booking Lead Time Insights for Juno Beach
- The overall average booking lead time for vacation rentals in Juno Beach is 54 days.
- Guests book furthest in advance for stays during February (average 83 days), likely coinciding with peak travel demand or local events.
- The shortest booking windows occur for stays in September (average 32 days), indicating more last-minute travel plans during this time.
- Seasonally, Winter (72 days avg.) sees the longest lead times, while Summer (37 days avg.) has the shortest, reflecting typical travel planning cycles.
Recommendations for Hosts
- Use the overall average lead time (54 days) as a baseline for your pricing and availability strategy in Juno Beach.
- For February stays, consider implementing length-of-stay discounts or slightly higher rates for bookings made less than 83 days out to capitalize on advance planning.
- Target marketing efforts for the Winter season well in advance (at least 72 days) to capture early planners.
- Monitor your own booking lead times against these Juno Beach averages to identify opportunities for dynamic pricing adjustments.
Popular & Essential Airbnb Amenities in Juno Beach (2026)
Amenity Prevalence
Amenity Insights for Juno Beach
- Essential amenities in Juno Beach that guests expect include: Smoke alarm, Coffee maker, Essentials, Air conditioning, Free parking on premises, Wifi, Refrigerator, TV, Microwave, Heating. Lacking these (any) could significantly impact bookings.
Recommendations for Hosts
- Ensure your listing includes all essential amenities for Juno Beach: Smoke alarm, Coffee maker, Essentials, Air conditioning, Free parking on premises, Wifi, Refrigerator, TV, Microwave, Heating.
- Prioritize adding missing essentials: Refrigerator, TV, Microwave, Heating.
- Highlight unique or less common amenities you offer (e.g., hot tub, dedicated workspace, EV charger) in your listing description and photos.
- Regularly check competitor amenities in Juno Beach to stay competitive.
Juno Beach Airbnb Guest Demographics & Profile Analysis (2026)
Guest Profile Summary for Juno Beach
- The typical guest profile for Airbnb in Juno Beach consists of primarily domestic travelers (96%), often arriving from nearby Miami, typically belonging to the Post-2000s (Gen Z/Alpha) group (50%), primarily speaking English or Spanish.
- Domestic travelers account for 96.4% of guests.
- Key international markets include United States (96.4%) and France (0.9%).
- Top languages spoken are English (69%) followed by Spanish (18%).
- A significant demographic segment is the Post-2000s (Gen Z/Alpha) group, representing 50% of guests.
Recommendations for Hosts
- Target domestic marketing efforts towards travelers from Miami and New York.
- Tailor amenities and listing descriptions to appeal to the dominant Post-2000s (Gen Z/Alpha) demographic (e.g., highlight fast WiFi, smart home features, local guides).
- Highlight unique local experiences or amenities relevant to the primary guest profile.
- Consider seasonal promotions aligned with peak travel times for key origin markets.
Nearby Short-Term Rental Market Comparison
How does the Juno Beach Airbnb market stack up against its neighbors? Compare key performance metrics like average monthly revenue, ADR, and occupancy rates in surrounding areas to understand the broader regional STR landscape.
| Market | Active Properties | Monthly Revenue | Daily Rate | Avg. Occupancy |
|---|---|---|---|---|
| Sailfish Point | 19 | $16,709 | $1587.63 | 48% |
| Bal Harbour Village | 37 | $8,846 | $850.63 | 34% |
| Lake Clarke Shores | 26 | $6,710 | $516.52 | 46% |
| Lighthouse Point | 75 | $6,205 | $472.94 | 51% |
| Pinecrest | 11 | $6,117 | $861.24 | 43% |
| North Bay Village | 120 | $6,032 | $561.12 | 44% |
| Tequesta | 43 | $4,920 | $376.96 | 50% |
| Parkland | 17 | $4,637 | $369.21 | 47% |
| Ocean Ridge | 14 | $4,588 | $602.78 | 48% |
| Key Biscayne | 104 | $4,470 | $448.61 | 49% |