Jensen Beach Airbnb Market Analysis 2026: Short Term Rental Data & Vacation Rental Statistics in Florida, United States
Is Airbnb profitable in Jensen Beach in 2026? Explore comprehensive Airbnb analytics for Jensen Beach, Florida, United States to uncover income potential. This 2026 STR market report for Jensen Beach, based on AirROI data from February 2025 to January 2026, reveals key trends in the market of 394 active listings.
Whether you're considering an Airbnb investment in Jensen Beach, optimizing your existing vacation rental, or exploring rental arbitrage opportunities, understanding the Jensen Beach Airbnb data is crucial. Leveraging the low regulation environment is key to maximizing your short term rental income potential. Let's dive into the specifics.
Key Jensen Beach Airbnb Performance Metrics Overview
Monthly Airbnb Revenue Variations & Income Potential in Jensen Beach (2026)
Understanding the monthly revenue variations for Airbnb listings in Jensen Beach is key to maximizing your short term rental income potential. Seasonality significantly impacts earnings. Our analysis, based on data from the past 12 months, shows that the peak revenue month for STRs in Jensen Beach is typically March, while September often presents the lowest earnings, highlighting opportunities for strategic pricing adjustments during shoulder and low seasons. Explore the typical Airbnb income in Jensen Beach across different performance tiers:
- Best-in-class properties (Top 10%) achieve $6,620+ monthly, often utilizing dynamic pricing and superior guest experiences.
- Strong performing properties (Top 25%) earn $4,303 or more, indicating effective management and desirable locations/amenities.
- Typical properties (Median) generate around $2,602 per month, representing the average market performance.
- Entry-level properties (Bottom 25%) see earnings around $1,386, often with potential for optimization.
Average Monthly Airbnb Earnings Trend in Jensen Beach
Jensen Beach Airbnb Occupancy Rate Trends (2026)
Maximize your bookings by understanding the Jensen Beach STR occupancy trends. Seasonal demand shifts significantly influence how often properties are booked. Typically, Marchsees the highest demand (peak season occupancy), while September experiences the lowest (low season). Effective strategies, like adjusting minimum stays or offering promotions, can boost occupancy during slower periods. Here's how different property tiers perform in Jensen Beach:
- Best-in-class properties (Top 10%) achieve 80%+ occupancy, indicating high desirability and potentially optimized availability.
- Strong performing properties (Top 25%) maintain 63% or higher occupancy, suggesting good market fit and guest satisfaction.
- Typical properties (Median) have an occupancy rate around 44%.
- Entry-level properties (Bottom 25%) average 25% occupancy, potentially facing higher vacancy.
Average Monthly Occupancy Rate Trend in Jensen Beach
Average Daily Rate (ADR) Airbnb Trends in Jensen Beach (2026)
Effective short term rental pricing strategy in Jensen Beach involves understanding monthly ADR fluctuations. The Average Daily Rate (ADR) for Airbnb in Jensen Beach typically peaks in January and dips lowest during August. Leveraging Airbnb dynamic pricing tools or strategies based on this seasonality can significantly boost revenue. Here's a look at the typical nightly rates achieved:
- Best-in-class properties (Top 10%) command rates of $369+ per night, often due to premium features or locations.
- Strong performing properties (Top 25%) achieve nightly rates of $263 or more.
- Typical properties (Median) charge around $193 per night.
- Entry-level properties (Bottom 25%) earn around $144 per night.
Average Daily Rate (ADR) Trend by Month in Jensen Beach
Get Live Jensen Beach Market Intelligence 👇

Explore Real-time Analytics
Airbnb Seasonality Analysis & Trends in Jensen Beach (2026)
Peak Season (March, February, April)
- Revenue averages $5,059 per month
- Occupancy rates average 64.6%
- Daily rates average $226
Shoulder Season
- Revenue averages $2,951 per month
- Occupancy maintains around 40.2%
- Daily rates hold near $228
Low Season (August, September, October)
- Revenue drops to average $2,257 per month
- Occupancy decreases to average 33.9%
- Daily rates adjust to average $215
Seasonality Insights for Jensen Beach
- The Airbnb seasonality in Jensen Beach shows highly seasonal trends requiring careful strategy. While the sections above show seasonal averages, it's also insightful to look at the extremes:
- During the high season, the absolute peak month showcases Jensen Beach's highest earning potential, with monthly revenues capable of climbing to $6,187, occupancy reaching a high of 73.5%, and ADRs peaking at $256.
- Conversely, the slowest single month of the year, typically falling within the low season, marks the market's lowest point. In this month, revenue might dip to $1,955, occupancy could drop to 31.0%, and ADRs may adjust down to $206.
- Understanding both the seasonal averages and these monthly peaks and troughs in revenue, occupancy, and ADR is crucial for maximizing your Airbnb profit potential in Jensen Beach.
Seasonal Strategies for Maximizing Profit
- Peak Season: Maximize revenue through premium pricing and potentially longer minimum stays. Ensure high availability.
- Low Season: Offer competitive pricing, special promotions (e.g., extended stay discounts), and flexible cancellation policies. Target off-season travelers like remote workers or budget-conscious guests.
- Shoulder Seasons: Implement dynamic pricing that balances peak and low rates. Target weekend travelers or specific events. Offer slightly more flexible terms than peak season.
- Regularly analyze your own performance against these Jensen Beach seasonality benchmarks and adjust your pricing and availability strategy accordingly.
Best Areas for Airbnb Investment in Jensen Beach (2026)
Exploring the top neighborhoods for short-term rentals in Jensen Beach? This section highlights key areas, outlining why they are attractive for hosts and guests, along with notable local attractions. Consider these locations based on your target guest profile and investment strategy.
| Neighborhood / Area | Why Host Here? (Target Guests & Appeal) | Key Attractions & Landmarks |
|---|---|---|
| Ocean Drive | A scenic beachfront area known for its stunning views and lively atmosphere. Ideal for tourists looking for a beachfront experience with dining and shopping options nearby. | Jensen Beach Park, Stuart Beach, Florida Oceanographic Coastal Center, Sailfish Splash Waterpark, Gulfstream Sailing, Jensen Beach Golf Club |
| Downtown Jensen Beach | The heart of Jensen Beach, featuring a quaint small-town vibe with local shops, cafes, and restaurants. Great for those who want to experience local culture and community. | Jensen Beach Community Center, Indian Riverside Park, The Treasure Coast, Historic Downtown Jensen Beach, Local Art Galleries |
| Hutchinson Island | A barrier island featuring pristine beaches and nature preserves, perfect for those looking for a more secluded and natural getaway. | Hutchinson Island Beaches, Jeanette's Pier, Bathtub Reef Beach, Hutchinson Island Natural Wildlife Refuge |
| Savannas Preserve State Park | A beautiful natural area perfect for eco-tourism and outdoor activities, attracting nature lovers and families seeking adventure. | Hiking Trails, Biking Trails, Wildlife Viewing, Kayaking, Educational Programs |
| Balloon Fiesta Park | A unique location that hosts various festivals and events, appealing to visitors seeking fun activities and local festivities throughout the year. | Local Festivals, Picnic Areas, Playgrounds |
| Indiantown Road | Close to shopping centers and major roads, convenient for guests who want easy access to local attractions and amenities. | Shopping Malls, Restaurants, Golf Courses, Parks |
| Stuart | Just a short drive from Jensen Beach, Stuart offers a vibrant downtown with shops and entertainment, ideal for those looking to explore nearby areas. | Stuart Downtown Historic District, Stuart Riverwalk, Elliott Museum, Lyric Theatre, Boat Rentals |
| Martin County Beaches | Offering a stretch of beautiful coastline, this area attracts beach lovers and those wanting a one-of-a-kind beach vacation while remaining close to Jensen Beach. | Carlin Park, Psalty's Beach Bar and Grill, Jupiter Island, Beachfront Rentals |
Understanding Airbnb License Requirements & STR Laws in Jensen Beach (2026)
While Jensen Beach, Florida, United States currently shows low STR regulations, specific Airbnb license requirements might still exist or change. Always verify the latest short term rental regulations and Airbnb license requirements directly with local government authorities for Jensen Beach to ensure full compliance before hosting.
(Source: AirROI data, 2026, finding no licensed listings among those analyzed)
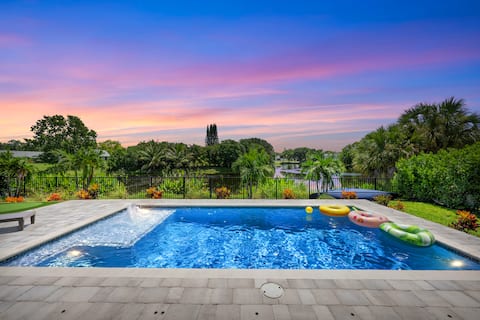
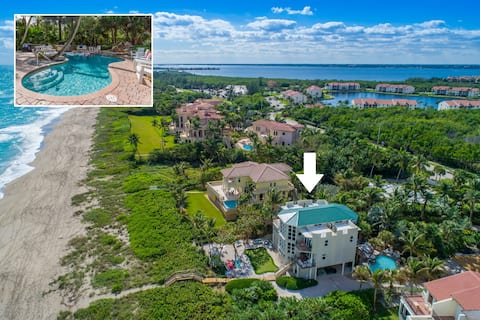
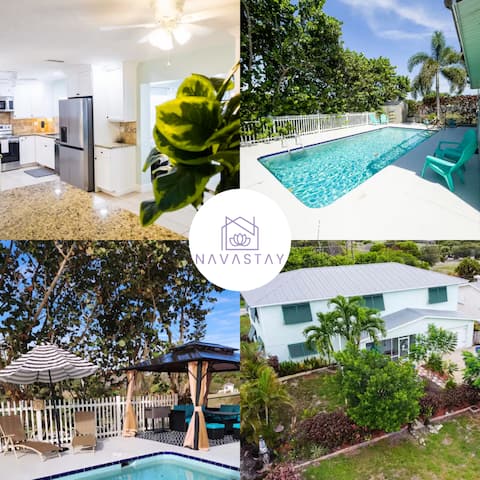
Top Performing Airbnb Properties in Jensen Beach (2026)
Benchmark your potential! Explore examples of top-performing Airbnb properties in Jensen Beachbased on Trailing Twelve Month (TTM) revenue. Analyze their characteristics, revenue, occupancy rate, and ADR to understand what drives success in this market.

Ocean access | Pool & Hot Tub| Bay Beach | Arcade!
Entire Place • 5 bedrooms
Mini-Golf*Heated Saltwater Pool*New*Lake Front!
Entire Place • 4 bedrooms

Margarita-Ville on the water! Stunning Sunsets!
Entire Place • 5 bedrooms
Chateau de la Mer: Beach Jewel w/pool+hot tub+more!
Entire Place • 9 bedrooms

New*Mini-Golf*Heat or Chill Saltwater Pool*Arcade
Entire Place • 4 bedrooms
Skyline Breeze: Heated Pool & Game Room in Jensen
Entire Place • 6 bedrooms
Note: Performance varies based on location, size, amenities, seasonality, and management quality. Data reflects the past 12 months.
Top Performing Airbnb Hosts in Jensen Beach (2026)
Learn from the best! This table showcases top-performing Airbnb hosts in Jensen Beach based on the number of properties managed and estimated total revenue over the past year. Analyze their scale and performance metrics.
| Host Name | Properties | Grossing Revenue | Stay Reviews | Avg Rating |
|---|---|---|---|---|
| Evolve | 16 | $494,332 | 466 | 4.60/5.0 |
| Christi And Stefan Sorensen | 3 | $343,333 | 328 | 4.97/5.0 |
| Liette | 5 | $341,279 | 150 | 4.89/5.0 |
| William | 8 | $290,855 | 239 | 4.99/5.0 |
| Mike-Jenn-Lisa | 5 | $267,983 | 151 | 4.94/5.0 |
| Matt | 10 | $265,295 | 416 | 4.91/5.0 |
| Bob | 3 | $201,988 | 23 | 5.00/5.0 |
| Danielle | 7 | $187,313 | 87 | 4.73/5.0 |
| Elercia | 1 | $178,360 | 61 | 4.98/5.0 |
| Kimi Johnson | 2 | $145,201 | 70 | 4.96/5.0 |
Analyzing the strategies of top hosts, such as their property selection, pricing, and guest communication, can offer valuable lessons for optimizing your own Airbnb operations in Jensen Beach.
Dive Deeper: Advanced Jensen Beach STR Market Data (2026)
Ready to unlock more insights? AirROI provides access to advanced metrics and comprehensive Airbnb data for Jensen Beach. Explore detailed analytics beyond this report to refine your investment strategy, optimize pricing, and maximize your vacation rental profits.
Explore Advanced MetricsJensen Beach Short-Term Rental Market Composition (2026): Property & Room Types
Room Type Distribution
Property Type Distribution
Market Composition Insights for Jensen Beach
- The Jensen Beach Airbnb market composition is heavily skewed towards Entire Home/Apt listings, which make up 97.7% of the 394 active rentals. This indicates strong guest preference for privacy and space.
- Looking at the property type distribution in Jensen Beach, House properties are the most common (71.8%), reflecting the local real estate landscape.
- Houses represent a significant 71.8% portion, catering likely to families or larger groups.
- Smaller segments like others, outdoor/unique, hotel/boutique, unique stays (combined 4.1%) offer potential for unique stay experiences.
Jensen Beach Airbnb Room Capacity Analysis (2026): Bedroom Distribution
Distribution of Listings by Number of Bedrooms
Room Capacity Insights for Jensen Beach
- The dominant room capacity in Jensen Beach is 2 bedrooms listings, making up 50.3% of the market. This suggests a strong demand for properties suitable for couples or solo travelers.
- Together, 2 bedrooms and 1 bedroom properties represent 70.9% of the active Airbnb listings in Jensen Beach, indicating a high concentration in these sizes.
- A significant 24.7% of listings offer 3+ bedrooms, catering to larger groups and families seeking more space in Jensen Beach.
Jensen Beach Vacation Rental Guest Capacity Trends (2026)
Distribution of Listings by Guest Capacity
Guest Capacity Insights for Jensen Beach
- The most common guest capacity trend in Jensen Beach vacation rentals is listings accommodating 4 guests (29.9%). This suggests the primary traveler segment is likely small families or groups.
- Properties designed for 4 guests and 6 guests dominate the Jensen Beach STR market, accounting for 59.3% of listings.
- 47.6% of properties accommodate 6+ guests, serving the market segment for larger families or group travel in Jensen Beach.
- On average, properties in Jensen Beach are equipped to host 5.1 guests.
Jensen Beach Airbnb Booking Patterns (2026): Available vs. Booked Days
Available Days Distribution
Booked Days Distribution
Booking Pattern Insights for Jensen Beach
- The most common availability pattern in Jensen Beach falls within the 271-366 days range, representing 45.2% of listings. This suggests many properties have significant open periods on their calendars.
- Approximately 79.2% of listings show high availability (181+ days open annually), indicating potential for increased bookings or specific owner usage patterns.
- For booked days, the 91-180 days range is most frequent in Jensen Beach (34.8%), reflecting common guest stay durations or potential owner blocking patterns.
- A notable 21.9% of properties secure long booking periods (181+ days booked per year), highlighting successful long-term rental strategies or significant owner usage.
Jensen Beach Airbnb Minimum Stay Requirements Analysis
Distribution of Listings by Minimum Night Requirement
1 Night
20 listings
5.1% of total
2 Nights
73 listings
18.5% of total
3 Nights
30 listings
7.6% of total
4-6 Nights
58 listings
14.7% of total
7-29 Nights
63 listings
16% of total
30+ Nights
150 listings
38.1% of total
Key Insights
- The most prevalent minimum stay requirement in Jensen Beach is 30+ Nights, adopted by 38.1% of listings. This highlights the market's preference for longer commitments.
- A significant segment (38.1%) caters to monthly stays (30+ nights) in Jensen Beach, pointing to opportunities in the extended-stay market.
Recommendations
- Align with the market by considering a 30+ Nights minimum stay, as 38.1% of Jensen Beach hosts use this setting.
- If feasible, allowing 1-night stays, especially midweek or during low season, could capture last-minute bookings, as only 5.1% currently do.
- Explore offering discounts for stays of 30+ nights to attract the 38.1% of the market seeking extended stays.
- Adjust minimum nights based on seasonality – potentially shorter during low season and longer during peak demand periods in Jensen Beach.
Jensen Beach Airbnb Cancellation Policy Trends Analysis (2026)
Super Strict 30 Days
8 listings
2% of total
Limited
7 listings
1.8% of total
Super Strict 60 Days
1 listings
0.3% of total
Flexible
61 listings
15.5% of total
Moderate
77 listings
19.5% of total
Firm
164 listings
41.6% of total
Strict
76 listings
19.3% of total
Cancellation Policy Insights for Jensen Beach
- The prevailing Airbnb cancellation policy trend in Jensen Beach is Firm, used by 41.6% of listings.
- A majority (60.9%) of hosts in Jensen Beach utilize Firm or Strict policies, indicating a market where hosts prioritize booking security.
Recommendations for Hosts
- Consider adopting a Firm policy to align with the 41.6% market standard in Jensen Beach.
- Regularly review your cancellation policy against competitors and market demand shifts in Jensen Beach.
Jensen Beach STR Booking Lead Time Analysis (2026)
Average Booking Lead Time by Month
Booking Lead Time Insights for Jensen Beach
- The overall average booking lead time for vacation rentals in Jensen Beach is 65 days.
- Guests book furthest in advance for stays during February (average 123 days), likely coinciding with peak travel demand or local events.
- The shortest booking windows occur for stays in September (average 28 days), indicating more last-minute travel plans during this time.
- Seasonally, Winter (94 days avg.) sees the longest lead times, while Summer (38 days avg.) has the shortest, reflecting typical travel planning cycles.
Recommendations for Hosts
- Use the overall average lead time (65 days) as a baseline for your pricing and availability strategy in Jensen Beach.
- For February stays, consider implementing length-of-stay discounts or slightly higher rates for bookings made less than 123 days out to capitalize on advance planning.
- Target marketing efforts for the Winter season well in advance (at least 94 days) to capture early planners.
- Monitor your own booking lead times against these Jensen Beach averages to identify opportunities for dynamic pricing adjustments.
Popular & Essential Airbnb Amenities in Jensen Beach (2026)
Amenity Prevalence
Amenity Insights for Jensen Beach
- Essential amenities in Jensen Beach that guests expect include: Air conditioning, Wifi, Free parking on premises, TV, Kitchen, Smoke alarm. Lacking these (any) could significantly impact bookings.
- Popular amenities like Dishes and silverware, Refrigerator, Coffee maker are common but not universal. Offering these can provide a competitive edge.
Recommendations for Hosts
- Ensure your listing includes all essential amenities for Jensen Beach: Air conditioning, Wifi, Free parking on premises, TV, Kitchen, Smoke alarm.
- Prioritize adding missing essentials: Air conditioning, Wifi, Free parking on premises, TV, Kitchen, Smoke alarm.
- Consider adding popular differentiators like Dishes and silverware or Refrigerator to increase appeal.
- Highlight unique or less common amenities you offer (e.g., hot tub, dedicated workspace, EV charger) in your listing description and photos.
- Regularly check competitor amenities in Jensen Beach to stay competitive.
Jensen Beach Airbnb Guest Demographics & Profile Analysis (2026)
Guest Profile Summary for Jensen Beach
- The typical guest profile for Airbnb in Jensen Beach consists of primarily domestic travelers (94%), often arriving from nearby Miami, typically belonging to the Post-2000s (Gen Z/Alpha) group (50%), primarily speaking English or Spanish.
- Domestic travelers account for 94.4% of guests.
- Key international markets include United States (94.4%) and Canada (1.9%).
- Top languages spoken are English (69.9%) followed by Spanish (16.4%).
- A significant demographic segment is the Post-2000s (Gen Z/Alpha) group, representing 50% of guests.
Recommendations for Hosts
- Target domestic marketing efforts towards travelers from Miami and Orlando.
- Tailor amenities and listing descriptions to appeal to the dominant Post-2000s (Gen Z/Alpha) demographic (e.g., highlight fast WiFi, smart home features, local guides).
- Highlight unique local experiences or amenities relevant to the primary guest profile.
- Consider seasonal promotions aligned with peak travel times for key origin markets.
Nearby Short-Term Rental Market Comparison
How does the Jensen Beach Airbnb market stack up against its neighbors? Compare key performance metrics like average monthly revenue, ADR, and occupancy rates in surrounding areas to understand the broader regional STR landscape.
| Market | Active Properties | Monthly Revenue | Daily Rate | Avg. Occupancy |
|---|---|---|---|---|
| Sailfish Point | 19 | $16,709 | $1587.63 | 48% |
| Lake Clarke Shores | 26 | $6,710 | $516.52 | 46% |
| Reunion | 12 | $6,321 | $580.45 | 44% |
| Lighthouse Point | 75 | $6,205 | $472.94 | 51% |
| Melbourne Beach | 275 | $5,384 | $488.83 | 43% |
| Tequesta | 43 | $4,920 | $376.96 | 50% |
| Juno Beach | 39 | $4,807 | $377.00 | 47% |
| Parkland | 17 | $4,637 | $369.21 | 47% |
| Ocean Ridge | 14 | $4,588 | $602.78 | 48% |
| Plantation | 121 | $4,249 | $438.64 | 44% |